After some of the recent controversy about the state of the evidence supporting ACE’s recommendations [1] I started thinking about how best we could study leafleting, and I think there is a strong opportunity for someone to do a much higher power study than has been managed before, with relatively low effort.
Disclaimer: All of the views/plans presented therein are my own, and not officially affiliated with or endorsed by Mercy For Animals.
The primary takeaway is that most of the studies conducted so far have not been controlled making it impossible to infer the effect of leafleting versus a general trend towards vegetarianism. The studies which have used controls have also always had extremely small control groups, the largest being 57, meaning none of them had the power to measure any statistically significant results.
This has left leafleting effectiveness estimates almost entirely dominated by personal judgements, despite the fact it is a significant tool used by effective animal charities. [2]
1.2 A summary of my plan
At a large university (pseudo)-randomly split the students evenly into two groups, and put leaflets into the pigeonholes of all members of one of the groups, and none of the other. Then send a follow up survey (possibly incentivised) to all students, a week later, asking:
A question to determine if they were leafleted or not, without directly asking.
If they have changed their diet in the last two weeks, and if so, how.
This would provide a controlled trial with a sample size of many thousands if the survey response rate was high enough (see 3.4), enough to find an effect size of approximately 1/75-1/250 leaflets creating one vegetarian (depending on sample size, as it ranges from 2,500 to 10,000, see 3.5).
1.3 My aim for this post
After contacting my university it turns out running such a study in Cambridge would not be possible (as the Student union/faculty will not email out a survey, and due to other considerations, see 3.1). However I think such a study could still be extremely valuable if conducted elsewhere.
By laying out the plan in detail I hope to both get feedback on areas which could be improved, and hopefully find a university at which it could be implemented.
2. Detailed plan
2.1 Preparations
Determine which students you will leaflet, either using some kind of randomisation or any natural divisions that exist (see 3.1).
Contact the student union/university itself and ask if they would email the survey out to the entire student population. Getting the survey to reach everyone is very important, so it would be worth working hard on this, meeting them in person if necessary etc. Also write some articles about the survey to feature in online student newspapers (the TAB etc.) and discuss getting them published in advance. For both of these playing up the fact it is a potentially large and important study being conducted by university students would probably be helpful. Incentivising the survey responses with a fairly large amount (e.g. £5 each) might also be most useful at this stage, as even if it does not boost response rate very much (see 3.5) getting the survey emailed out to everyone is very important.
Work with Statisticians Without Borders (or similar experts) to check the statistics behind the study all work out, and pre-register the study, including which effects we are will be looking for (such as a higher than base-rate number of people who were leafleted turning vegetarian).
Obtain as many leaflets are you are expecting to hand out (in the UK Animal Equality distribute them to students to hand out for free). Contact/hire an online survey company to set up a survey that is linked with the university’s emails or similar, so that each student can only fill it out once. The survey should also have the following questions:
What is your last name? Or similar question designed to determine if they were leafleted or not (see 3.1).
Have you changed your diet in the last two weeks? If they select yes them being presented with two further questions:
Which label best described your diet before the change? Options:
Meat Reduction Diet (A diet reducing meat consumption, for example Meatless Mondays)
Pescetarian Diet (eat fish, egg, and milk products, but no other meat (including chicken))
Vegetarian Diet (eat egg and milk products, but no meat (including fish or chicken))
Vegan Diet (eat no meat (including fish or chicken), milk products, egg, or other animal products)
No specific diet (A diet with no specific preferences or exclusions)
Other __________________________
Which label best describes your diet after the change? With the same options.
If the survey was incentivised there would then be a tickbox for “I would like a £5 amazon voucher” and a submit button, which would take them to a ‘thank you’ page with a referral link to send to their friends, and the information that they would get another £2 amazon voucher for each of their friends that used it and filled out the survey.
2.2 Implementation
Once all the setup is completed, find one-two days where 4 volunteers/workers are free, split into two groups and work through putting leaflets in the pigeonholes of all the students of all the colleges you arranged to. (For the practicalities of this we have found filling two suitcases with leaflets allowed two people to transport about 2,500 at once). We have been able to give out an average of 1000 leaflets an hour as part of a two person team when mass-leafleting like this, so it might be possible to do it in only one day, or two days with only two people. One week later send out the survey (open for one week) via all your available channels, with a follow up reminder 3 days later if possible. If the response rate is too low possibly consider trying to boost it via additional methods such as facebook advertising. At the end of the week close the survey.
2.3 Analysis
Although the underlying statistics in case case seem quite simple (see 3.5), I would suggest letting statisticians without borders or other experts do the analysis, according to the pre-registered methodology. This would just involve looking for difference between the control and leafleted group in the rate veg*n dietary change, such as increased number of people reducing meat consumption. (Again see 3.5)
3.Explanation of the Details
3.1 How to split the population into two groups
I was inspired to come up with this after realising that approximately half of the Cambridge colleges allow mass-pigeonholing all of their students (and all cambridge students have a pigeonhole), and the other half none, creating a natural division. However there are actually several factors that make Cambridge colleges a non-ideal partition for this survey and whilst it turns out that the Cambridge Student union would not send out a survey in any case, these considerations also apply to any other collegiate university that such a survey might be run at:
i. Different colleges have different cultures and institutions, e.g. different cafeterias, which may serve differing qualities of vegetarian/vegan food, influencing the effectiveness of leafleting.
ii. Demographic confounders, as different colleges have different subject and gender ratios, which may correlate with leaflet response rates. I consider this a less important consideration as it could be controlled for with careful study design. (Such as by asking about gender and subject in the survey)
iii. An additional point against Cambridge is that quite a lot of pro-veggie leafleting has already been carried out, including mass-pigeonholing of many colleges in previous years.
iv. Any form of clustered randomisation reduces statistical power, although I am not sure about the size of this effect (see 3.5)
However more generally I think the important criteria for good ways of splitting the student population into two groups are:
i. It being possible to selectively leaflet all of the students in one group and none in the other.
ii. Which group any student falls into being easily discernible via a simple survey question which does not rely on the student remembering being leafleted/could influence the students’ later answers.
iii. Splitting the student population into approximately equal sized groups to maximise statistical power.
iv. The splitting being random, or at least not correlated with anything that should affect the response to leafleting.
With these conditions in mind I think the ideal method might be to find a university where all students could in theory be leafleted, and then selectively only leafleting those whose surname starts with a letter in the first half of the alphabet (e.g. a-m) or some similar system. A potential issue with this could be that last name starting letter may influence the base chance to go vegetarian (as it could reflect class or similar distinctions), however when splitting the population into only 2 groups this seems unlikely to be an issue.
As names are written on all student pigeonholes I would think most randomisation systems would need to depend on them, however there is a trade off as the more random a system the harder it would be to implement when actually doing the leafleting.
3.2 Survey Questions
I think the important considerations in choosing what questions to put on the survey would be:
i. Finding out something which we can actually put a value on, such as people going vegetarian (as opposed to say, changing their views about meat, where the impact is much less clear).
ii. Minimising the chance of influencing the answer, which would be an issue if you were e.g. asking them about if they had been leafleted, making them think back to it.
iii. Within a given effect, choosing the question that maximises statistical power. iv. Keeping the survey short, to maximise response rate.
In 2.1 I reused one of the diet questions from MFA 2013 study on leafleting [3], cutting out the irrelevent options and and adapting them to a much shorter (two weeks vs 3 months) timescale, which should greatly increase the statistical power. This is however at the cost of capturing longer term effects, such as the leaflets not having a direct effect but making people more susceptible to other veg*n outreach, which is discussed further in the next section
3.3 Practical survey considerations
I think actual leafleting should be carried out as rapidly as possible, ideally over a one or two day period, so that the amount of time people have to pick up and read the leaflet is as uniform as possible before the survey goes out.
One week after distributing the leaflets a survey (open for one week) should be sent out to the entire student population, consisting of one question about any changes they may have had in diet over the last 2 weeks, and then another to determine if they fall in the leafleting group or the control. I chose this as I think one week is enough for everyone to have checked their pigeonhole, and I think most people will then either read the leaflet immediately or at least in the same day, or throw it away. Any diet changes then have a few days to kick in before the survey goes out.
I chose this short turn around to maximise the power of the survey, as the shorter the timescale the lower the base rate of people converting to vegetarianism, and so the greater the statistical power. I suspect this is a trade off between power and looking at the long-term effects however, and probably cuts off some important effects. It might be worth conducting a follow up survey a few months later, to see both if the initial effects last, which would be very useful in estimating the value of leafleting in its own right, and also to see if any additional ones manifest.
3.4 Incentivisation
It is possible that incentivising the survey to boast response rate would be worth it, however it would significantly add to the cost of the survey, and I am unsure of the benefits. I have not been able to find any conclusive research as to how it would influence the expected response rate, with some papers even finding incentivized surveys got lower response rates.
Even if it does not boost response rate, it seems that incentivising the survey would increase the willingness by university-wide groups such as the student union to share the survey. This is very important as if we cannot get the survey emailed out to the entire student population evenly then this would not only reduce the sample size, but also mean the we may end up with a non-representative sample.
If the survey was incentivised I would suggest offering a reward of say a £5 amazon voucher to each student who fills out the survey, plus a bonus £2 for every other students you refer who fills it out. The referral bonus should hopefully engender a strong sharing amongst friends affect, which should lead to a high response rate, although I have found no studies on this, so it is only intuition.
A survey company may need to be brought in to create and set up the referral and reward systems, which could add to the costs. As part of this some system would need to be in place to stop people filling out the survey multiple times (such as requiring a unique university email address for everyone filling out the survey, or using a university authentication system as discussed in my plan for Cambridge).
3.5 Statistical power estimations
The power estimates are quite strongly dependant on what the base rate of students going vegetarian/reducing meat consumption are. I have looked at looked at ACEs 2013 study to get the proportion of students going vegetarian in a given two week period as 0.234% [4]
Note that if using university colleges or similar large groups as the way to split the students then the power would be reduced due to clustering [5], but I do not know how to estimate this effect. The following calculations are thus for a system like the name-based randomisation described at the end of 3.1
For simplicity this is looking only at people going vegetarian as a result of reading the leaflet, although as a study like this would likely be investigating multiple hypotheses such as the effects of the leaflets on vegetarianism and veganism separately, I have made a bonferroni correction [6] of ⅕ meaning the following are calculated for alpha = 0.01
To get the following figures I plugged the base rate of 0.234% and samples sizes into the above calculator, found the smallest effect size in the treatment population that gave 90% power, and subtracted the base rate to get the detectable effects of the leafleting. [7]
A sample of 10,000 would give a 90% chance of finding an 1⁄202 effect if it existed (i.e would provide a 90% chance to finding out if one in every 202 leaflets turned a student vegetarian)
A sample of 5,000 would give a 90% chance of finding an 1⁄124 effect if it existed
A sample of 2,500 would give a 90% chance of finding an 1⁄73 effect if it existed
(All assuming the sample was split evenly between control and treatment groups)
The average unversity size in the UK seems to be about 20,000 students making survey sizes of 10,000, 5,000 and 2,500 represent approximately 50%, 25% and 12.5% response rates respectively.
All these figures are exceedingly rough, and more could be calculated to find the power to detect e.g. conversions to veganism or general meat reduction, but they serve to show that with a relatively low response rate (12.5%) we could attain significant statistical power, particularly more than enough to test some existing claims, such as the 1⁄50 or 1⁄75 figure leaflets to a vegetarian figure [8]
4. Final Thoughts 4.1 Limitations
A few things to consider are that the results of a study like this would not be obviously an immediately generalizable to other cases. Leaflets in pigeonholes could have a very different effect than when handed out normally. Student populations are also probably far more likely to respond positively to pro-vegetarian messages, although as most of the outreach currently seems to target them anyway this is not much of an issue.
There is also a significant range of values in which it would be effectively impossible to tell if leaflets had an effect, but they could still be considered very effective if they did. E.g. if 1⁄10,000 leaflets made someone turn vegetarian this would work out to approximately £600 per vegetarian created [9] which some might consider worth it (if they wanted to e.g. offset their own diet), but would also require such a large enough sample (~7 million people) [10] as to be effectively untestable.
As such I think a likely outcome of a study like this would be finding no statistically significant effect, but animal charities continuing with leafleting regardless, which might well be justified.
4.2 Predicted cost
If no incentive was used with the survey, then the cost of the entire could be extremely low, basically just that of the leaflets, approximately 4p each in the UK, and 20-30 person hours of doing set up and handing out the leaflets. At 10,000 leaflets and £10 an hour this would put the entire cost of the study at £700 ($900) or less.
If the suggested £5 per response and £2 referrals incentives were supplied, despite being a fairly large reward per person this would allow for a 10,000 person (representing a 50% response rate for a typical university, if all the students could be emailed the survey) study to be conducted for around £75,000 ($90,000), which would have orders of magnitude more power than any other study conducted to date.
4.3 Conclusion
Despite some subtleties about exactly how to split up the groups and maximise response the response rate to the survey I think there is a strong opportunity here, and that a study run using this methodology would be significantly valuable.
The main issue seems to be the availability of universities with pigeonholes and cooperative faculties/student unions to email out the survey. As such I would be interested in hearing from students at any universities they think fit the criteria. In the meantime please give me feedback on any areas you think are flawed, or ways things could be improved.
[4] As ACE published all the data from their study [3], I was able to look at the ‘control’ responses from people who did not receive a leaflet, or who received one unrelated to reducing animal product consumption. Removing all those who did not answer the relevant questions, I was left with 356 people who filled in their present diet, as well as what it had been 3 month previously. Counting the number of vegetarians who had reported being something other than vegetarian 3 months previously (and excluding one vegan who because vegetarian) I got a base rate of 5⁄356 students becoming vegetarian in a 3 month period, or ⅙*5/356 = 0.234% becoming vegetarian in a two week period.
[9] When mass-leafleting colleges as in this study as a team of two we were able to hand out 1000 leaflets an hour. I have been told the leaflets cost 4p each, and assuming paying the leafleters £10 an hour this gives a total cost of £600 (2*10*£10 = £200 to pay the leafleters, and $0.04*10,000 = £400 for the cost of the leaflets).
[10] obtained by setting p2 in the calculator to 0.0021, 0.0001 (or 1⁄10,000) more than the base rate of p1 = 0.002, with a power of 90%.
Proposed methodology for leafleting study
After some of the recent controversy about the state of the evidence supporting ACE’s recommendations [1] I started thinking about how best we could study leafleting, and I think there is a strong opportunity for someone to do a much higher power study than has been managed before, with relatively low effort.
Disclaimer: All of the views/plans presented therein are my own, and not officially affiliated with or endorsed by Mercy For Animals.
1. Background
1.1 A brief overview of previous research
A good review of the previous studies on leafletting effectiveness can be found here: http://veganoutreach.org/les-fall-2016/
The primary takeaway is that most of the studies conducted so far have not been controlled making it impossible to infer the effect of leafleting versus a general trend towards vegetarianism. The studies which have used controls have also always had extremely small control groups, the largest being 57, meaning none of them had the power to measure any statistically significant results.
This has left leafleting effectiveness estimates almost entirely dominated by personal judgements, despite the fact it is a significant tool used by effective animal charities. [2]
1.2 A summary of my plan
At a large university (pseudo)-randomly split the students evenly into two groups, and put leaflets into the pigeonholes of all members of one of the groups, and none of the other. Then send a follow up survey (possibly incentivised) to all students, a week later, asking:
A question to determine if they were leafleted or not, without directly asking.
If they have changed their diet in the last two weeks, and if so, how.
This would provide a controlled trial with a sample size of many thousands if the survey response rate was high enough (see 3.4), enough to find an effect size of approximately 1/75-1/250 leaflets creating one vegetarian (depending on sample size, as it ranges from 2,500 to 10,000, see 3.5).
1.3 My aim for this post
After contacting my university it turns out running such a study in Cambridge would not be possible (as the Student union/faculty will not email out a survey, and due to other considerations, see 3.1). However I think such a study could still be extremely valuable if conducted elsewhere.
By laying out the plan in detail I hope to both get feedback on areas which could be improved, and hopefully find a university at which it could be implemented.
2. Detailed plan
2.1 Preparations
Determine which students you will leaflet, either using some kind of randomisation or any natural divisions that exist (see 3.1).
Contact the student union/university itself and ask if they would email the survey out to the entire student population. Getting the survey to reach everyone is very important, so it would be worth working hard on this, meeting them in person if necessary etc. Also write some articles about the survey to feature in online student newspapers (the TAB etc.) and discuss getting them published in advance. For both of these playing up the fact it is a potentially large and important study being conducted by university students would probably be helpful. Incentivising the survey responses with a fairly large amount (e.g. £5 each) might also be most useful at this stage, as even if it does not boost response rate very much (see 3.5) getting the survey emailed out to everyone is very important.
Work with Statisticians Without Borders (or similar experts) to check the statistics behind the study all work out, and pre-register the study, including which effects we are will be looking for (such as a higher than base-rate number of people who were leafleted turning vegetarian).
Obtain as many leaflets are you are expecting to hand out (in the UK Animal Equality distribute them to students to hand out for free).
Contact/hire an online survey company to set up a survey that is linked with the university’s emails or similar, so that each student can only fill it out once. The survey should also have the following questions:
What is your last name? Or similar question designed to determine if they were leafleted or not (see 3.1).
Have you changed your diet in the last two weeks?
If they select yes them being presented with two further questions:
Which label best described your diet before the change?
Options:
Meat Reduction Diet (A diet reducing meat consumption, for example Meatless Mondays)
Pescetarian Diet (eat fish, egg, and milk products, but no other meat (including chicken))
Vegetarian Diet (eat egg and milk products, but no meat (including fish or chicken))
Vegan Diet (eat no meat (including fish or chicken), milk products, egg, or other animal products)
No specific diet (A diet with no specific preferences or exclusions)
Other __________________________
Which label best describes your diet after the change?
With the same options.
If the survey was incentivised there would then be a tickbox for “I would like a £5 amazon voucher” and a submit button, which would take them to a ‘thank you’ page with a referral link to send to their friends, and the information that they would get another £2 amazon voucher for each of their friends that used it and filled out the survey.
2.2 Implementation
Once all the setup is completed, find one-two days where 4 volunteers/workers are free, split into two groups and work through putting leaflets in the pigeonholes of all the students of all the colleges you arranged to. (For the practicalities of this we have found filling two suitcases with leaflets allowed two people to transport about 2,500 at once). We have been able to give out an average of 1000 leaflets an hour as part of a two person team when mass-leafleting like this, so it might be possible to do it in only one day, or two days with only two people.
One week later send out the survey (open for one week) via all your available channels, with a follow up reminder 3 days later if possible. If the response rate is too low possibly consider trying to boost it via additional methods such as facebook advertising. At the end of the week close the survey.
2.3 Analysis
Although the underlying statistics in case case seem quite simple (see 3.5), I would suggest letting statisticians without borders or other experts do the analysis, according to the pre-registered methodology. This would just involve looking for difference between the control and leafleted group in the rate veg*n dietary change, such as increased number of people reducing meat consumption. (Again see 3.5)
3.Explanation of the Details
3.1 How to split the population into two groups
I was inspired to come up with this after realising that approximately half of the Cambridge colleges allow mass-pigeonholing all of their students (and all cambridge students have a pigeonhole), and the other half none, creating a natural division. However there are actually several factors that make Cambridge colleges a non-ideal partition for this survey and whilst it turns out that the Cambridge Student union would not send out a survey in any case, these considerations also apply to any other collegiate university that such a survey might be run at:
i. Different colleges have different cultures and institutions, e.g. different cafeterias, which may serve differing qualities of vegetarian/vegan food, influencing the effectiveness of leafleting.
ii. Demographic confounders, as different colleges have different subject and gender ratios, which may correlate with leaflet response rates. I consider this a less important consideration as it could be controlled for with careful study design. (Such as by asking about gender and subject in the survey)
iii. An additional point against Cambridge is that quite a lot of pro-veggie leafleting has already been carried out, including mass-pigeonholing of many colleges in previous years.
iv. Any form of clustered randomisation reduces statistical power, although I am not sure about the size of this effect (see 3.5)
However more generally I think the important criteria for good ways of splitting the student population into two groups are:
i. It being possible to selectively leaflet all of the students in one group and none in the other.
ii. Which group any student falls into being easily discernible via a simple survey question which does not rely on the student remembering being leafleted/could influence the students’ later answers.
iii. Splitting the student population into approximately equal sized groups to maximise statistical power.
iv. The splitting being random, or at least not correlated with anything that should affect the response to leafleting.
With these conditions in mind I think the ideal method might be to find a university where all students could in theory be leafleted, and then selectively only leafleting those whose surname starts with a letter in the first half of the alphabet (e.g. a-m) or some similar system. A potential issue with this could be that last name starting letter may influence the base chance to go vegetarian (as it could reflect class or similar distinctions), however when splitting the population into only 2 groups this seems unlikely to be an issue.
As names are written on all student pigeonholes I would think most randomisation systems would need to depend on them, however there is a trade off as the more random a system the harder it would be to implement when actually doing the leafleting.
3.2 Survey Questions
I think the important considerations in choosing what questions to put on the survey would be:
i. Finding out something which we can actually put a value on, such as people going vegetarian (as opposed to say, changing their views about meat, where the impact is much less clear).
ii. Minimising the chance of influencing the answer, which would be an issue if you were e.g. asking them about if they had been leafleted, making them think back to it.
iii. Within a given effect, choosing the question that maximises statistical power.
iv. Keeping the survey short, to maximise response rate.
In 2.1 I reused one of the diet questions from MFA 2013 study on leafleting [3], cutting out the irrelevent options and and adapting them to a much shorter (two weeks vs 3 months) timescale, which should greatly increase the statistical power. This is however at the cost of capturing longer term effects, such as the leaflets not having a direct effect but making people more susceptible to other veg*n outreach, which is discussed further in the next section
3.3 Practical survey considerations
I think actual leafleting should be carried out as rapidly as possible, ideally over a one or two day period, so that the amount of time people have to pick up and read the leaflet is as uniform as possible before the survey goes out.
One week after distributing the leaflets a survey (open for one week) should be sent out to the entire student population, consisting of one question about any changes they may have had in diet over the last 2 weeks, and then another to determine if they fall in the leafleting group or the control. I chose this as I think one week is enough for everyone to have checked their pigeonhole, and I think most people will then either read the leaflet immediately or at least in the same day, or throw it away. Any diet changes then have a few days to kick in before the survey goes out.
I chose this short turn around to maximise the power of the survey, as the shorter the timescale the lower the base rate of people converting to vegetarianism, and so the greater the statistical power. I suspect this is a trade off between power and looking at the long-term effects however, and probably cuts off some important effects. It might be worth conducting a follow up survey a few months later, to see both if the initial effects last, which would be very useful in estimating the value of leafleting in its own right, and also to see if any additional ones manifest.
3.4 Incentivisation
It is possible that incentivising the survey to boast response rate would be worth it, however it would significantly add to the cost of the survey, and I am unsure of the benefits. I have not been able to find any conclusive research as to how it would influence the expected response rate, with some papers even finding incentivized surveys got lower response rates.
Even if it does not boost response rate, it seems that incentivising the survey would increase the willingness by university-wide groups such as the student union to share the survey. This is very important as if we cannot get the survey emailed out to the entire student population evenly then this would not only reduce the sample size, but also mean the we may end up with a non-representative sample.
If the survey was incentivised I would suggest offering a reward of say a £5 amazon voucher to each student who fills out the survey, plus a bonus £2 for every other students you refer who fills it out. The referral bonus should hopefully engender a strong sharing amongst friends affect, which should lead to a high response rate, although I have found no studies on this, so it is only intuition.
A survey company may need to be brought in to create and set up the referral and reward systems, which could add to the costs. As part of this some system would need to be in place to stop people filling out the survey multiple times (such as requiring a unique university email address for everyone filling out the survey, or using a university authentication system as discussed in my plan for Cambridge).
3.5 Statistical power estimations
The power estimates are quite strongly dependant on what the base rate of students going vegetarian/reducing meat consumption are. I have looked at looked at ACEs 2013 study to get the proportion of students going vegetarian in a given two week period as 0.234% [4]
For all the following power calculations I used: https://www.stat.ubc.ca/~rollin/stats/ssize/b2.html
Note that if using university colleges or similar large groups as the way to split the students then the power would be reduced due to clustering [5], but I do not know how to estimate this effect. The following calculations are thus for a system like the name-based randomisation described at the end of 3.1
For simplicity this is looking only at people going vegetarian as a result of reading the leaflet, although as a study like this would likely be investigating multiple hypotheses such as the effects of the leaflets on vegetarianism and veganism separately, I have made a bonferroni correction [6] of ⅕ meaning the following are calculated for alpha = 0.01
To get the following figures I plugged the base rate of 0.234% and samples sizes into the above calculator, found the smallest effect size in the treatment population that gave 90% power, and subtracted the base rate to get the detectable effects of the leafleting. [7]
A sample of 10,000 would give a 90% chance of finding an 1⁄202 effect if it existed (i.e would provide a 90% chance to finding out if one in every 202 leaflets turned a student vegetarian)
A sample of 5,000 would give a 90% chance of finding an 1⁄124 effect if it existed
A sample of 2,500 would give a 90% chance of finding an 1⁄73 effect if it existed
(All assuming the sample was split evenly between control and treatment groups)
The average unversity size in the UK seems to be about 20,000 students making survey sizes of 10,000, 5,000 and 2,500 represent approximately 50%, 25% and 12.5% response rates respectively.
All these figures are exceedingly rough, and more could be calculated to find the power to detect e.g. conversions to veganism or general meat reduction, but they serve to show that with a relatively low response rate (12.5%) we could attain significant statistical power, particularly more than enough to test some existing claims, such as the 1⁄50 or 1⁄75 figure leaflets to a vegetarian figure [8]
4. Final Thoughts
4.1 Limitations
A few things to consider are that the results of a study like this would not be obviously an immediately generalizable to other cases. Leaflets in pigeonholes could have a very different effect than when handed out normally. Student populations are also probably far more likely to respond positively to pro-vegetarian messages, although as most of the outreach currently seems to target them anyway this is not much of an issue.
There is also a significant range of values in which it would be effectively impossible to tell if leaflets had an effect, but they could still be considered very effective if they did. E.g. if 1⁄10,000 leaflets made someone turn vegetarian this would work out to approximately £600 per vegetarian created [9] which some might consider worth it (if they wanted to e.g. offset their own diet), but would also require such a large enough sample (~7 million people) [10] as to be effectively untestable.
As such I think a likely outcome of a study like this would be finding no statistically significant effect, but animal charities continuing with leafleting regardless, which might well be justified.
4.2 Predicted cost
If no incentive was used with the survey, then the cost of the entire could be extremely low, basically just that of the leaflets, approximately 4p each in the UK, and 20-30 person hours of doing set up and handing out the leaflets. At 10,000 leaflets and £10 an hour this would put the entire cost of the study at £700 ($900) or less.
If the suggested £5 per response and £2 referrals incentives were supplied, despite being a fairly large reward per person this would allow for a 10,000 person (representing a 50% response rate for a typical university, if all the students could be emailed the survey) study to be conducted for around £75,000 ($90,000), which would have orders of magnitude more power than any other study conducted to date.
4.3 Conclusion
Despite some subtleties about exactly how to split up the groups and maximise response the response rate to the survey I think there is a strong opportunity here, and that a study run using this methodology would be significantly valuable.
The main issue seems to be the availability of universities with pigeonholes and cooperative faculties/student unions to email out the survey. As such I would be interested in hearing from students at any universities they think fit the criteria.
In the meantime please give me feedback on any areas you think are flawed, or ways things could be improved.
[1] https://medium.com/@harrisonnathan/re-evaluating-animal-charity-evaluators-c164231406f7
[2] e.g Mercy For Animals, one of ACE’s top recommended charities pays its fellows to do this.
[3] https://animalcharityevaluators.org/research/interventions/leafleting/2013-leafleting-study/#main
[4] As ACE published all the data from their study [3], I was able to look at the ‘control’ responses from people who did not receive a leaflet, or who received one unrelated to reducing animal product consumption. Removing all those who did not answer the relevant questions, I was left with 356 people who filled in their present diet, as well as what it had been 3 month previously.
Counting the number of vegetarians who had reported being something other than vegetarian 3 months previously (and excluding one vegan who because vegetarian) I got a base rate of 5⁄356 students becoming vegetarian in a 3 month period, or ⅙*5/356 = 0.234% becoming vegetarian in a two week period.
[5] For an explanation of clustering see e.g. http://www.healthknowledge.org.uk/public-health-textbook/research-methods/1a-epidemiology/clustered-data
[6] https://en.wikipedia.org/wiki/Bonferroni_correction There might well be better ways of doing this, I just went with something I could easily use.
[7] In detail for the n = 10,000 case:
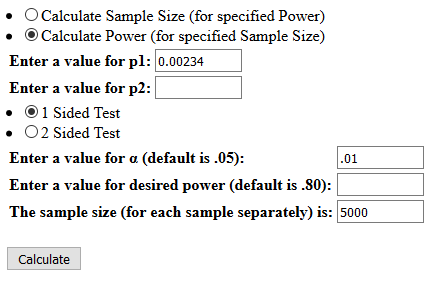
I entered the figures into the calculator as so:
I then entered values for p2 until finding the lowest that gave a power of 90%, which turned out to be 0.0073:
This corresponds to the leaflets having an effect of p2 - p1 = 0.00496 = 1⁄202.
[8]https://ccc.farmsanctuary.org/the-powerful-impact-of-college-leafleting-part-1/
[9] When mass-leafleting colleges as in this study as a team of two we were able to hand out 1000 leaflets an hour. I have been told the leaflets cost 4p each, and assuming paying the leafleters £10 an hour this gives a total cost of £600 (2*10*£10 = £200 to pay the leafleters, and $0.04*10,000 = £400 for the cost of the leaflets).
[10] obtained by setting p2 in the calculator to 0.0021, 0.0001 (or 1⁄10,000) more than the base rate of p1 = 0.002, with a power of 90%.