The value of actual sales data for understanding meat consumption
A study on meat and animal-product consumption in the Tesco 1.0 dataset
Cover photo by Bruno Kelzer
In this cross-posted PHAIR blog post, we provide an overview of our recent, open-access article, “Every little helps: Exploring meat and animal product consumption in the Tesco 1.0 dataset“, available here. We delve into the findings of our study with Dr. Chris Bryant and Katharina Hofmann, highlighting the benefits of using actual sales data and its implications for future research on meat reduction.
The Need for Behavioural Data on Meat Consumption
Meat and animal product consumption has been linked to several ethical, health, and environmental issues that affect our planet. The industry contributes to various environmental problems, such as climate change, deforestation, and the overuse of freshwater (Clark et al., 2020, Eshel et al., 2014, Theurl et al., 2020). Animal agriculture is a key contributor to global human-induced GHG emissions, emitting approximately 8.1 gigatons (Gt) carbon dioxide equivalents (CO2eq) (FAO, 2010), corresponding to 14.5% of global anthropogenic GHG emissions in 2013 (Gerber et al., 2013). According to the World Bank report, animal agriculture is also responsible for a large share of deforestation, for example, in the Amazon. Compared with 1970, 91% “of the increment of the cleared area has been converted to cattle ranching” (Margulis 2004, p. 9).
Animal agriculture also poses a threat to public health, exacerbating antibiotic resistance while constituting one of the most common sources of food-borne illness and zoonotic disease (Aiyar & Pingali, 2020; Canica et al., 2019; Fosse et al., 2008). Furthermore, animals bear the brunt of the impact, with, for example, 99% of U.S.-based farmed animals being raised on factory farms (Reese-Anthis, 2021). As factory farms are focused on efficiency and profit, they often disregard the natural needs and behavioural tendencies of animals (Broom, 1991), since the costs of raising animals humanely are often deemed economically unviable (Webster, 2001).
Although a great deal of recent research has focused on reducing meat consumption and promoting meat alternatives, most studies have relied on self-reported dietary data (e.g., see the review by Kwasny et al., 2022). This is where the importance of actual sales data for meat consumption research comes into play. Compared to self-reported data, actual sales data have an edge as they are more reliable and provide a better representation of dietary habits.
Compared to self-report data, actual sales data have an edge as they are more reliable and provide a better representation of dietary habits.
As self-reported data can often have biases and inaccuracies, analysts can use actual sales data to get a more accurate picture of what people are consuming. We used the Open Access Tesco 1.0 dataset (Aiello et al., 2020) to explore the consumption of meat and animal products in the UK, and identified regional, seasonal, and sociodemographic variations.
The Tesco 1.0 Dataset
The Tesco 1.0 dataset plays a crucial role in providing valuable insights into actual dietary habits based on real food purchase data. It contains records of over 420 million real food purchases made by 1.6 million loyalty card holders across 411 Tesco stores in London in 2015. The data is aggregated most granularly at the level of monthly purchases of 11 broad food categories in 4833 lower super output areas (LSOA) – see figure 1 below.
Regional and Seasonal Variations
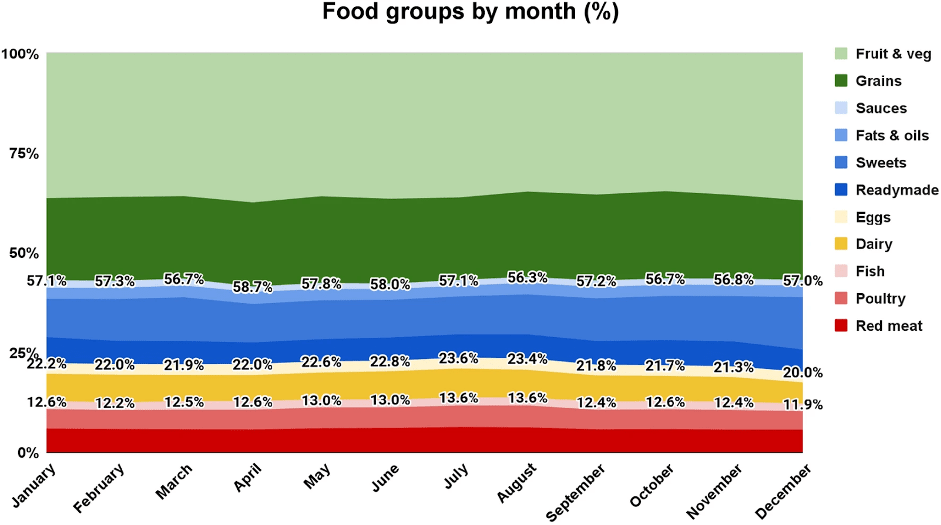
Our analysis of the Tesco 1.0 dataset shows that the spring and summer months had the highest consumption of meat and animal products, including poultry, which decreased in autumn (see figure 2 below). Though these seasonal trends in meat consumption are useful in identifying areas for meat-reduction campaigns, it is worth noting that the dataset only contains 12 months of data. Thus, seasonal trends cannot be identified over several years.
Sociodemographic Factors
To explore the socio-demographics of shoppers represented in the Tesco 1.0 dataset, we used another open access dataset – the LSOA Atlas – which provides summary demographics for each of the LSOAs in Greater London. This allowed us to identify several demographic predictors of meat consumption, some of which are surprising. For instance, it was found that areas with older, lower education, and more conservative voter-support had a lower proportion of meat purchases. This latter finding is interesting as it’s contrary to what self-report data at the individual-level might suggest about meat consumption as a function of political orientation (e.g., Hodson & Earle, 2018). On the other hand, the data also showed that a lower proportion of meat purchases could be observed in areas with a higher population density, better health, and more Hindus. These findings were in line with our hypotheses about meat consumption.
Benefits and Limitations
The dataset has some limitations, which are important to point out. Most notably, it only contains data for one grocery store, in one city, over one year and may not be generalisable to other times, locations, or retailers. The dataset also does not provide information on waste or how food was prepared. It also does not speak to the intentions behind the food purchases. For example, though the dataset provides information about the gender of the purchaser, it cannot illuminate whether the purchaser was shopping for themselves versus shopping for their partner or families. This is important to bear in mind when considering any gender differences in the data. Furthermore, some of the relationships we observed between demographic variables and meat purchases were relatively small, though statistically significant due to the large sample, and therefore should be interpreted with care.
Limitations aside, the Tesco 1.0 dataset can serve as a useful resource for meat reduction research. Our findings provide insights into regional, seasonal, and sociodemographic variations in animal product consumption. Future research using purchase data would benefit from datasets that relate to other parts of the UK, and internationally, to investigate wider cultural differences in meat consumption. Purchase data research would also benefit from having information on the family structure of shoppers, as well as having datasets that extend beyond a solitary year to consider seasonal trends in a more protracted manner.
This is really great, and thanks for highlighting where to get the data—I wouldn’t have heard about this otherwise.
Regarding this:
That’s definitely an interesting finding. Is it possible that some of these factors, such as lower education, are associated with lower income—thus less able to afford a lot of meat? Alternatively, might there also be differences in where people shop; perhaps they get meat from another store or local butcher?
I agree that sales data can be much more informative, or informative in different ways, than self-report data, so this is really nice to see
Executive summary: A study analyzing the Tesco 1.0 dataset of food purchases finds benefits in using actual sales data to understand meat consumption, though some limitations exist.
Key points:
Actual sales data like Tesco provides more reliable insights into meat consumption than self-reports.
Analysis found seasonal and demographic variations in meat purchases.
Data limitations include single retailer, city, and year coverage.
Results highlight value of sales data to inform meat reduction efforts.
Future research would benefit from extended, multi-location purchase datasets.
Relating purchases to family structure could reveal more on intended consumption.
This comment was auto-generated by the EA Forum Team. Feel free to point out issues with this summary by replying to the comment, and contact us if you have feedback.