Cash Transfers as a Simple First Argument
Summary
The beauty of GiveDirectly is that while it is unlikely to be the very best use of funds on the margin, it probably has the most robust case of any intervention that is plausibly close to being the very best. It seems to me that GiveDirectly is immune to the knee-jerk criticisms of EA (besides ‘charity starts at home’, but even then there are some domestic cash transfer options.)
As such, it has occurred to me that this is probably the best starter argument I can make to a friend who is EA-agnostic. Hoping to flesh out that case here—read on for more detail, but the main points are as follows:
There is a pretty clear logarithmic relationship between personal income and self-reported happiness, both within and across countries.
Even if all we do is transfer cash, no strings attached, happiness data suggests an average American could have an altruistic return of ~40x and a rich American ~600x.
(If you think that’s good, GiveWell believes there are several options ~15x better!)
Arguably, some of the ‘cost’ (the presumed dip in your happiness) could be recouped by the feeling that your actions are having a disproportionately positive impact.
Data and Discussion
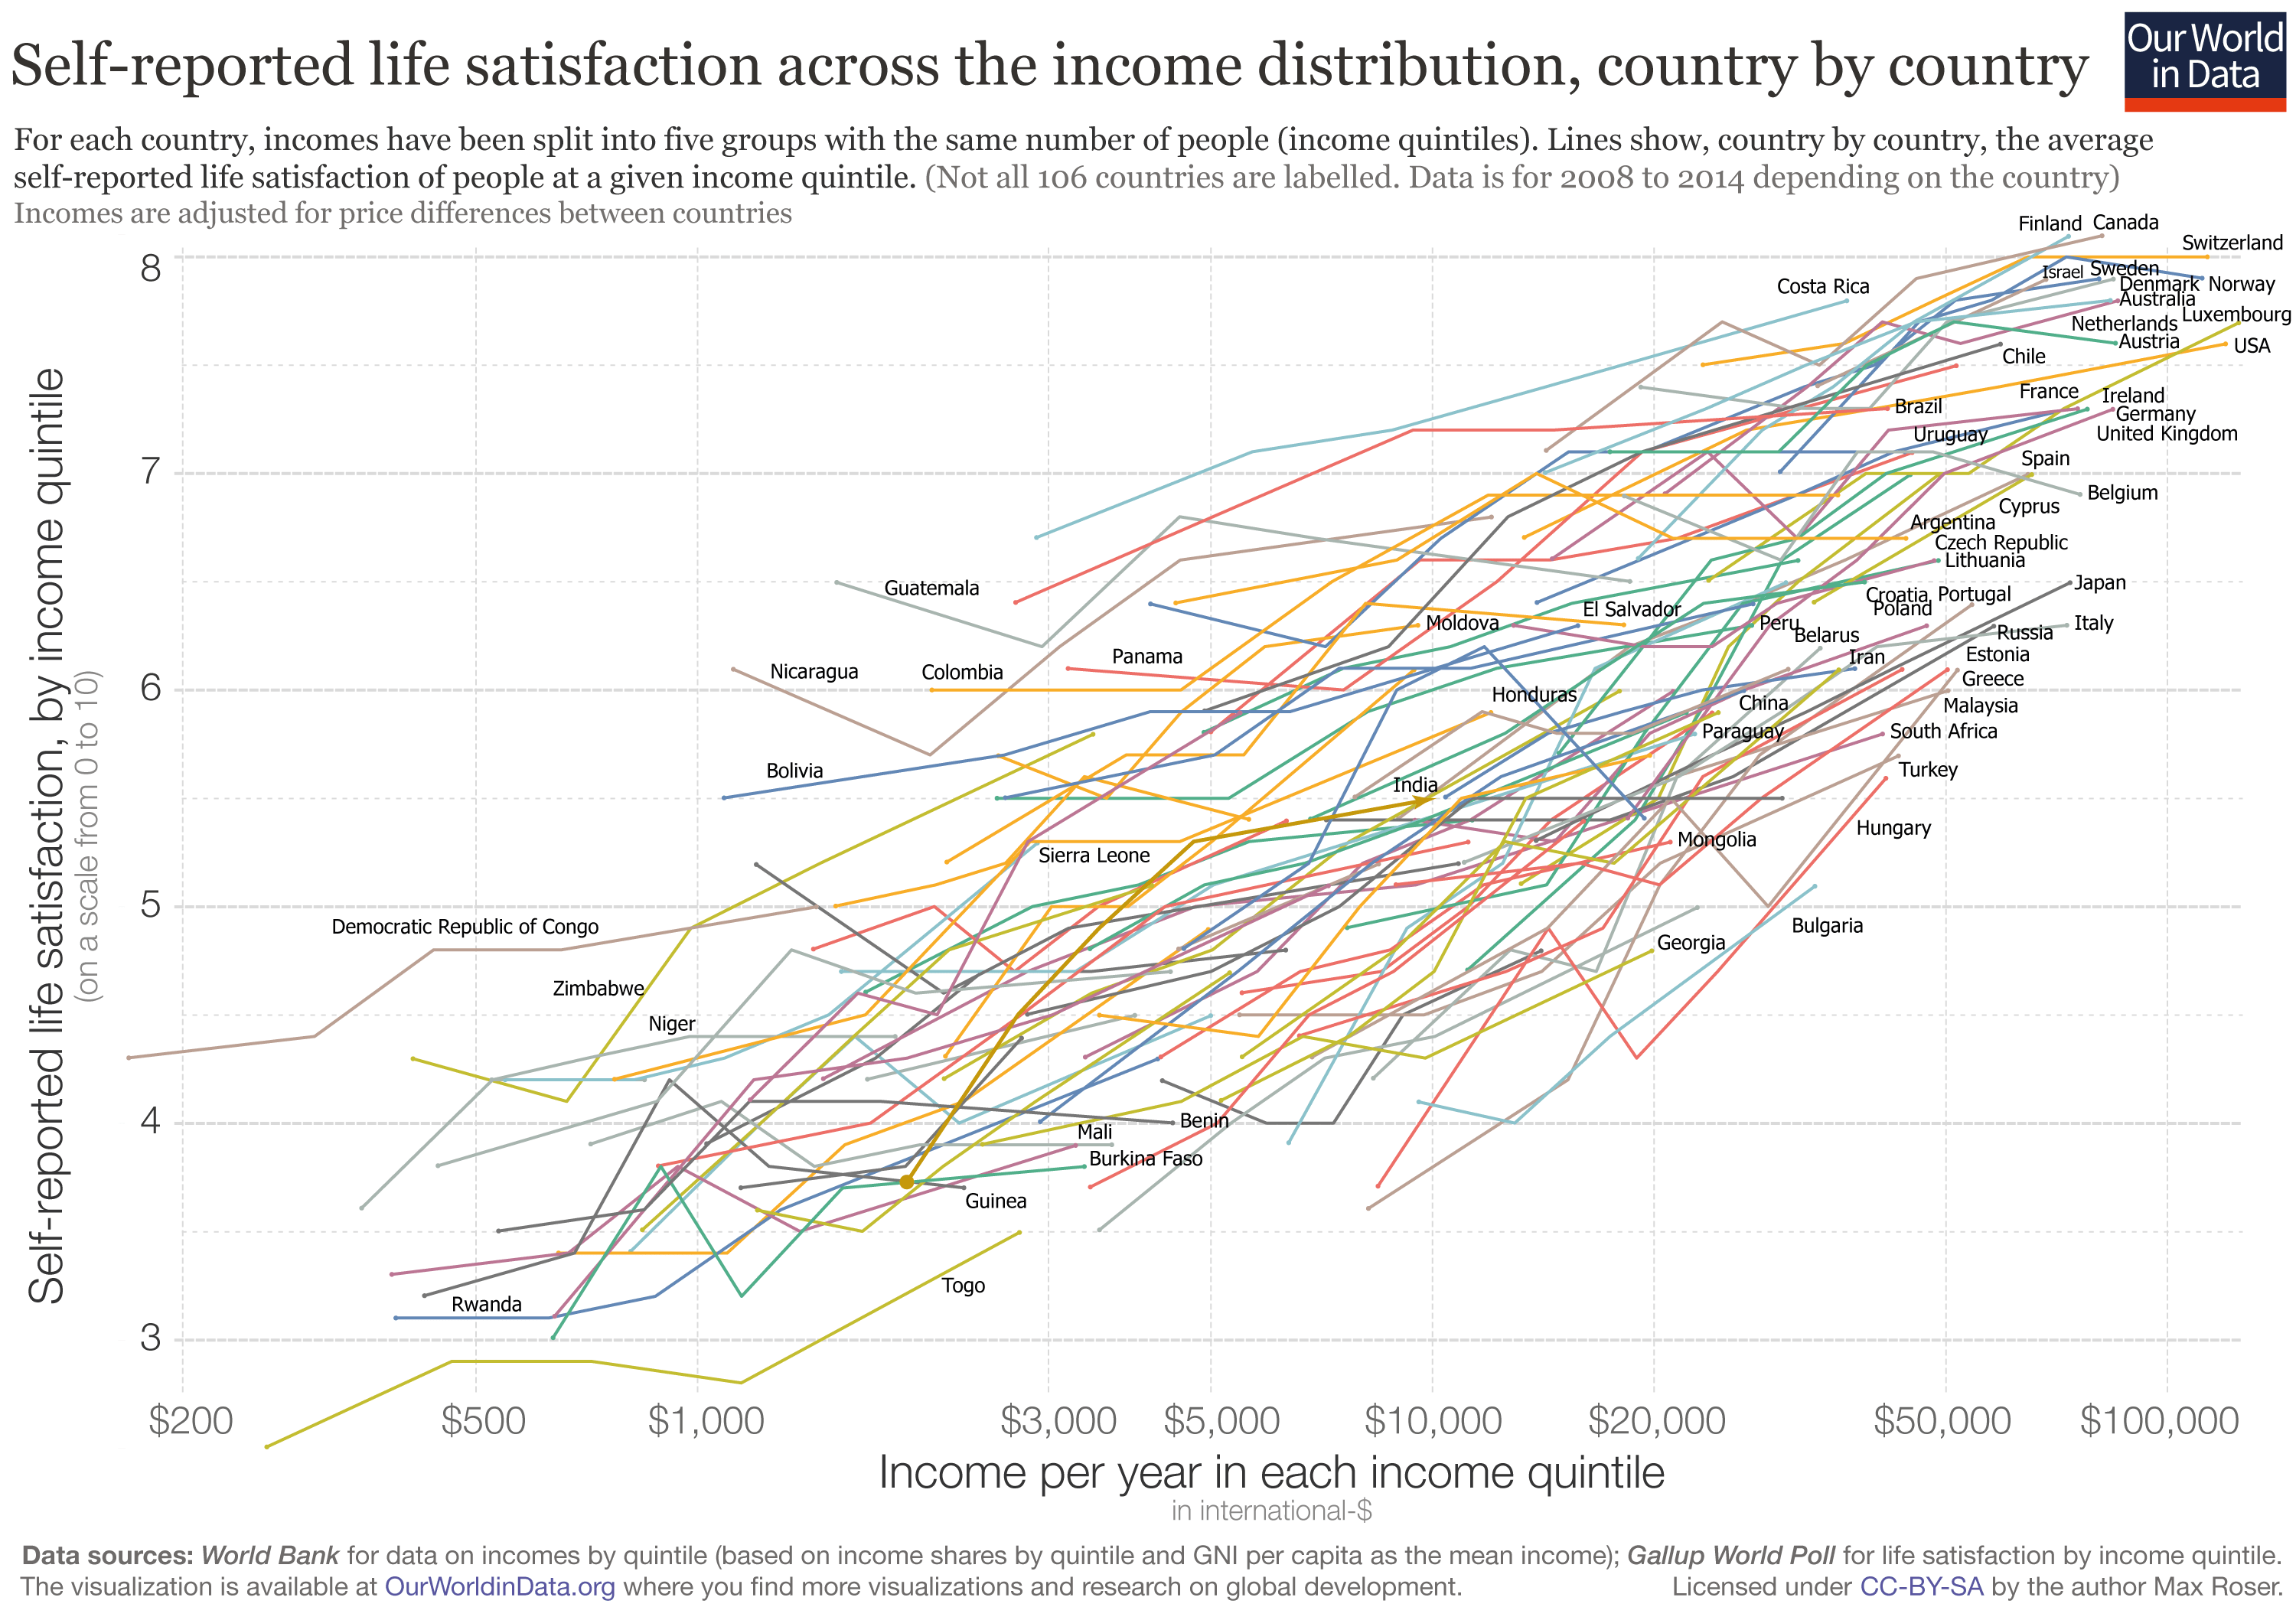
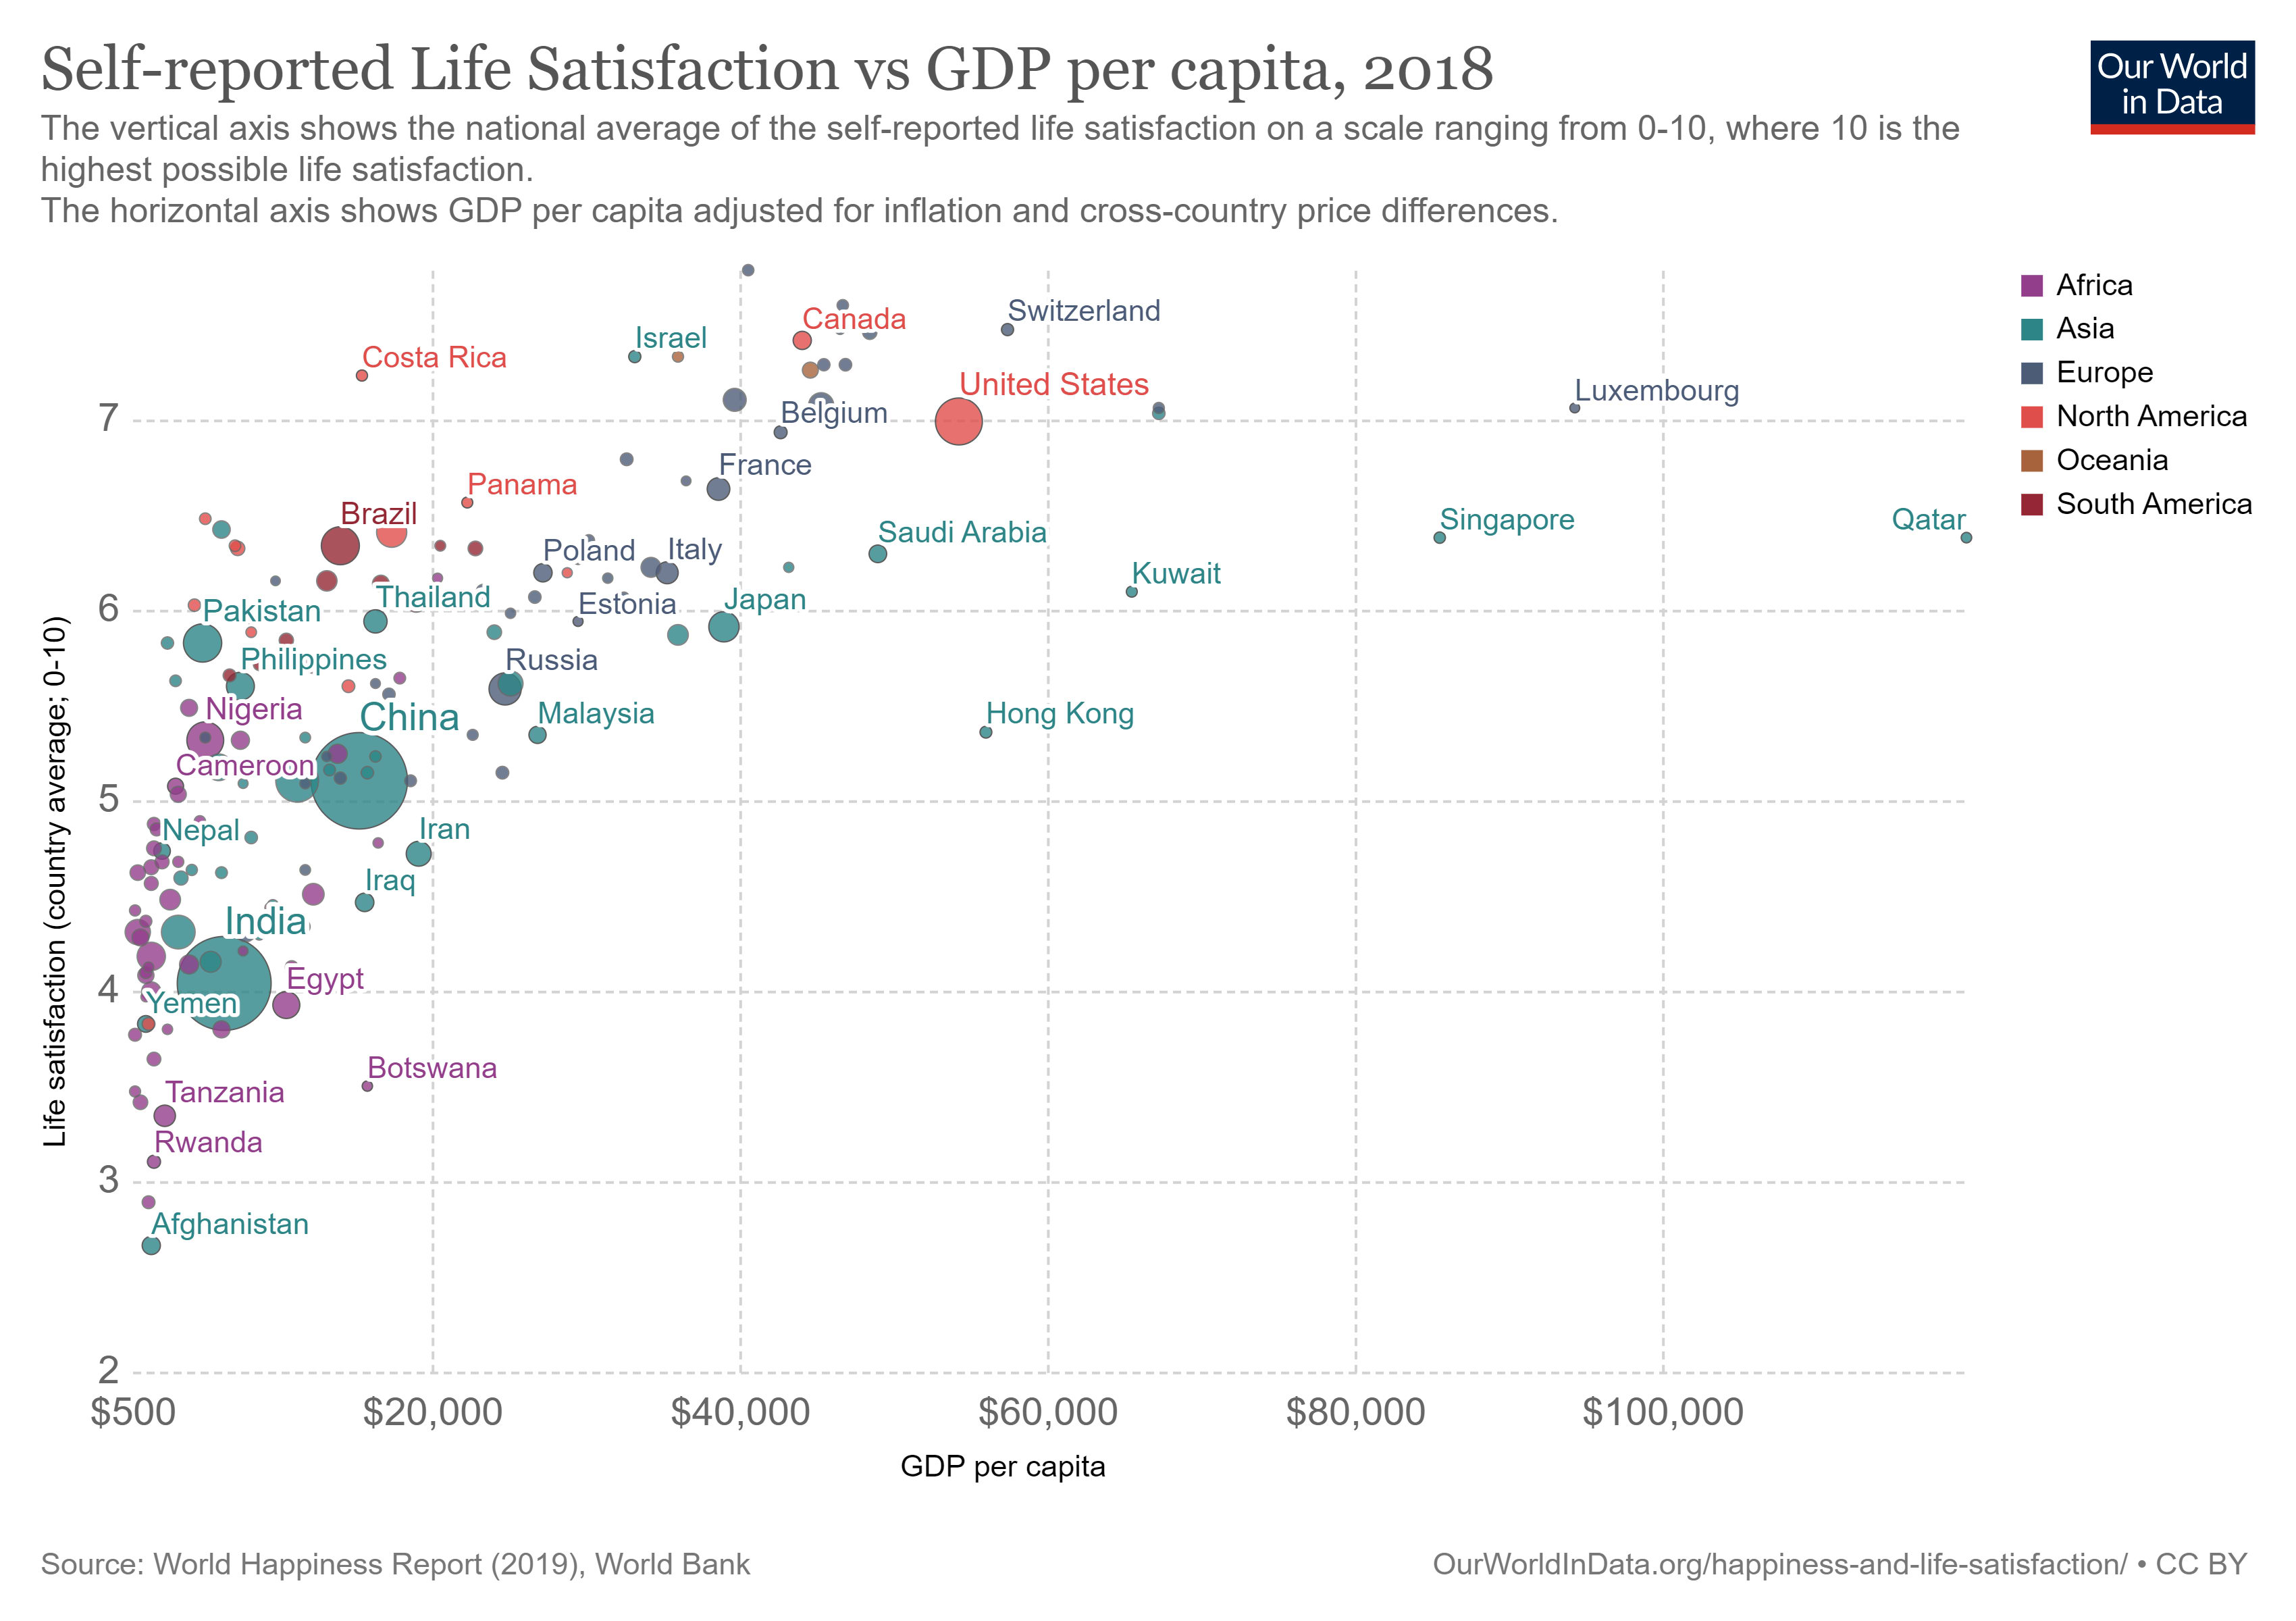
The log-linear relationship between income and happiness (as best represented by Our World in Data, e.g. Figures 1&2) was one of the main threads that first got me thinking with an EA bent. While admittedly many of the causes I now value can at first seem quite abstract and questionable, I found that this was very difficult to ignore from the start.
Although there’s a lot going on in Figure 1, and the underlying data isn’t fully public, just by zooming in and tracing some short trendlines we can make the following observations:
Looking at the bottom left of Figure 1, between the $1k and $3k tick marks, there is a cluster of several of the world’s poorest countries. It seems that a fair trend line across that interval would travel from 3.9 to 4.5 self-reported life satisfaction.
The mean personal income in the US is around $54k. Approximating from the graph, it looks like cutting this in half would correspond to life satisfaction falling on average from 7.3 to 7.1. If $27k costs 0.2 and funds 13.5*0.6 units of person-happiness (as per bullet #1), the altruistic return would be ~40x.
Similarly, let’s consider a rich American, say $500k personal income. It appears, roughly, that giving up $400k would again set this person back about 0.2 life satisfaction on average (~7.7 to 7.5). This would be enough to fund 200 of the aforementioned cash transfers, for an altruistic return of 600x.
Out of interest, by my calculation the population-weighted global average self-reported life satisfaction at present is about 5.1. Global GDP per capita in International Dollars is around $17.5k, which for an individual right now averages closer to 5.75.
Insofar as this thought experiment has any value whatsoever, it suggests that the total utility gains from a perfectly altruistic world might max out at something like 12% (at current GDP), whereas an individual in a rich country has the opportunity to contribute hundreds of times more than that (on the current margin).
Caveats
I do not have access to the underlying quintile data used by OWID
I believe only about 85% of a GiveDirectly donation ends up in the hands of end users, though this is probably made up for by the fact that they use the 15% in order to allocate to people who are in the very best position to benefit from those marginal dollars.
This is obviously a very simplistic representation of how a cash transfer would play out, but it makes a ton of intuitive sense, and the implications could withstand an awful lot of numerical error. I view this as sort of a lower bound, or a guiding principle to show that spending marginal dollars on myself or my peers can be difficult to justify.
Hi there, I agree it’s an interesting opening argument. I was wondering if you had seen this article before, which takes a similar approach: https://80000hours.org/career-guide/making-a-difference/
One concern about this approach is that I think it can seem obviously “low leverage” to the types of people focused on entrepreneurship, policy change and research (some of the people we most want to appeal to), and can give them the impression that EA is mainly about ‘high confidence’ giving rather than ‘high expected value’ giving, which is already a one of the most common misconceptions out there.
Hi Benjamin,
I totally forgot about that article, thank you for pointing it out! That is an excellent resource.
Your concern totally makes sense. Something I’ve been thinking about lately is whether EA should make a more concerted effort to promote ‘streams’ of varying fidelity intended for audiences which are coming from very different places.
Put another way: say I have a co-worker who every year gives to traditional, community-based charitable orgs, and has never considered giving that money elsewhere. Is this person more likely to spend the time on excellent and in-depth philosophical articles + podcasts I push on them, or engage with a more direct and irrefutable appeal to logic? I tend to think that the latter can serve as a gateway to the former.
I really like this example! I used in an interview I gave about EA and thought it went down pretty well. My main concern with using it is that I don’t personally fund direct cash transfers (or think they’re anywhere near the highest impact thing), and both think it can misrepresent the movement, and think that it’s disingenuous to imply that EA is about robustly good things like this, when I actually care most about things like AI Safety.
As a result, I frame the example like this (if I can have a high-context conversation):
Effectiveness, and identifying the highest impact interventions is a cornerstone of EA. I think this is super important, because there’s really big spread between how much good different interventions, much more than feels intuitive
Direct cash transfers are a proof of concept: There’s good evidence that doubling your income increases your wellbeing by the same amount, no matter how wealthy you were to start with. We can roughly think of helping someone as just giving them money, and so increasing their income. The average person in the US has income about 100x the income of the world’s poorest people, and so with the resources you’d need to double the income of an average American, you could help 100x as many of the world’s poorest people!
Contextualise, and emphasise just how weird 100x differences are—these don’t come up in normal life. It’d be like you were considering renting buying a laptop for $1000, shopped around for a bit, and found one just as good for $10! (Pick an example that I expect to resonate with big expenses the person faces, eg a laptop, car, rent, etc)
Emphasis that this is just a robust example as a proof of concept, and that in practice I think we can do way better—this just makes us confident that spread is out there, and worth looking for. Depending on the audience, maybe explain the idea of hits-based giving, and risk neutrality.
Thanks for sharing! I like the way you phrased it in the interview, I think that’s a nice way to start.