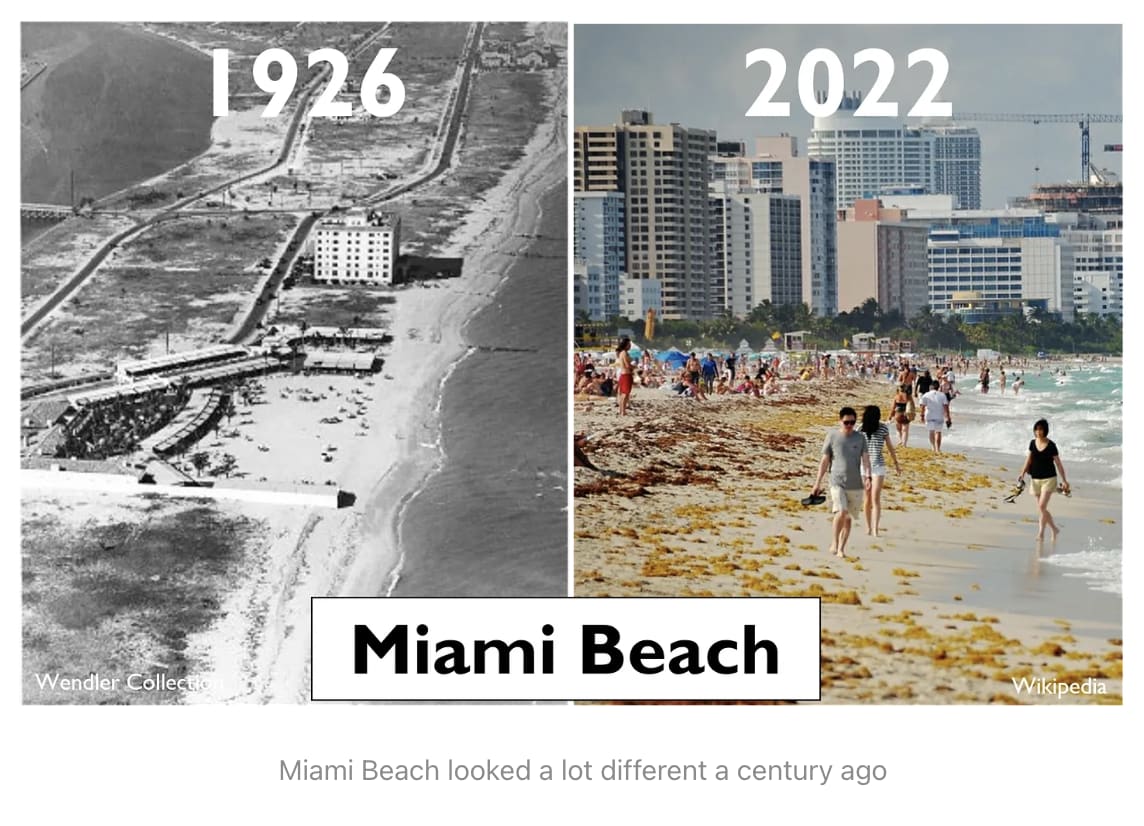
You cannot infer trends in the climate-related economic impact of natural disasters from trends in the total damage of natural disasters or trends in the per capita economic impact of natural disasters. The economic costs of natural disasters is influenced by the increasing economic value of areas that are vulnerable to climate change. Eg here is a Miami beach a century ago compared to today
You need to adjust for this by producing an estimate of normalised damages (discussedhereby one of the most cited climate researchers). For example, here is the normalised cost to the US of hurricanes since 1900. i.e. suggestive of increased losses on the order of $5-10bn over the course of a century, which is about 0.2% of US GDP.
Despite what you read in the media,according to the IPCC, for the vast majority of extreme events, it is not yet possible to attribute with confidence any change to climate change. A white entry in the table means that a signal cannot yet be noticed with confidence. A blue entry means the signal is increasing. An orange entry means the signal is decreasing.
There is as yet no clear evidence of a climate signal for precipitation, flooding, drought, fire weather, wind speed, storms, cyclones, and coastal flooding.
You cannot infer trends in the climate-related economic impact of natural disasters from trends in the total damage of natural disasters or trends in the per capita economic impact of natural disasters. The economic costs of natural disasters is influenced by the increasing economic value of areas that are vulnerable to climate change. Eg here is a Miami beach a century ago compared to today
You need to adjust for this by producing an estimate of normalised damages (discussed here by one of the most cited climate researchers). For example, here is the normalised cost to the US of hurricanes since 1900. i.e. suggestive of increased losses on the order of $5-10bn over the course of a century, which is about 0.2% of US GDP.
Despite what you read in the media, according to the IPCC, for the vast majority of extreme events, it is not yet possible to attribute with confidence any change to climate change. A white entry in the table means that a signal cannot yet be noticed with confidence. A blue entry means the signal is increasing. An orange entry means the signal is decreasing.
There is as yet no clear evidence of a climate signal for precipitation, flooding, drought, fire weather, wind speed, storms, cyclones, and coastal flooding.