EAG survey data analysis
Executive summary
On behalf of CEA, SEADS analysed survey data for EA Global events (as well as EAGx and EAG Virtual events) ranging from 2016 to 2020.
This post focuses on two main aspects of the data:
Drivers of value for participants of EAG conferences
Noticeable differences in experience for different demographic groups.
We estimate value based on how likely participants were to recommend future conferences (“likelihood to recommend”, or LTR). We conclude from our analysis that community-related variables (such as feeling welcome or making connections with new people) are more closely linked to LTR scores than content-related variables (such as enjoyment of speaker sessions). Our demographic analysis of community-related variables yielded no significant differences based on participants’ age, ethnicity, or gender.
Introduction
Preamble
We are SEADS (Swiss EA Data Science), a group of aspiring EAs based in Switzerland. We are an output-oriented project group: we aim to study EA-relevant questions and publish the results of our findings on the EA Forum. Our common expertise lies in data analysis and data science.
To generate relevant research questions, we contacted some EA organisations. CEA replied with a request to analyse survey data from EAG, EAGx and EAGx Virtual events (which we will collectively refer to as “EAG(x,v)”).
The structure of this post is as follows:
In the introduction, we highlight the objectives and the mechanics of our analysis, then discuss some background information on EAG(x,v) conferences.
We then discuss our analysis of the two main conference affect measures: satisfaction and likelihood to recommend (LTR).
Next, we briefly discuss the demographics of new vs returning conference attendees.
Finally, we conclude with a note on the limitations of our analysis.
Two objectives of our analysis
The goals of our analysis, as specified by CEA, can be divided into two questions:
What are the main drivers of value for attendees of EAG conferences? In this case, we equated value with two affect measures: event satisfaction, and the LTR score.
Are there any noticeable differences in experience for different demographic groups?
The mechanics of our analysis
The datasets used for these analyses include post-event surveys of EAG(x,v) events spanning 2018 to 2020. We used statistical models to analyse the survey datasets (using the statistical computing software R).
One way of thinking about these models: you define one survey question as the target variable, and all the other questions as the input variables. You feed the input variables into your statistical model of choice, and evaluate how well the output of the model describes the target variable. You then repeat this process with different combinations of input variables, with the objective of describing the target variable as accurately as possible. Somewhat confusingly, the description of the target variable by the input variables is called a prediction.
Some survey questions (or variables) are obviously connected, but other potentially important connections can be harder to spot. By testing and tweaking our models, we were gradually able to make statements about the relative importance of variable groups based on how well they “predicted” the LTR and conference satisfaction scores.
Background information on EAG(x,v) conferences
Average LTR and conference satisfaction scores
Table 1 shows an overview of the events we analysed. For each event, we evaluated participants’ reported LTR and satisfaction scores. The 2020 virtual events are the exception, because their associated surveys did not ask about satisfaction. LTR scores range from 7.82 − 8.63 out of 10, and satisfaction from 3.51 − 3.97 out of 5.
Year | Name | Location | LTR score | Satisfaction score |
2018 | EAG | London | 8.44 ± 1.4 | 3.51 ± 0.62 |
2018 | EAG | San Francisco | 8.21 ± 1.71 | 3.98 ± 0.75 |
2019 | EAG | London | 8.51 ± 1.45 | 3.84 ± 0.64 |
2019 | EAG | San Francisco | 8.21 ± 1.58 | 3.98 ± 0.73 |
2019 | EAGx | Australia | 8.56 ± 1.37 | 3.83 ± 0.86 |
2019 | EAGx | Boston | 8.63 ± 1.46 | 3.94 ± 0.85 |
2019 | EAGx | Nordics | 8.53 ± 1.62 | 3.27 ± 0.80 |
2020 | EAG V | (San Francisco) | 7.82 ± 2.17 | Not queried |
2020 | EAGx V | (Berlin) | 8.44 ± 1.84 | Not queried |
Table 1: scores from EAG(x,v) events. LTR was recorded on a 1-10 scale, and satisfaction on a 1-5 scale. Both columns show the mean value ± standard deviation.
Data on participants’ ages and genders
CEA has been collecting demographic information in each post-event survey since EAG London 2019. This means that, to date, we have data from three conferences (see Table 2).
For these three conferences, average age ranges from 27.4 − 29.1 years. For each conference, the majority of attendees identified as male, with people identifying as female ranging from 28 − 39% of the total. This is similar to the demographics of the 2019 EA Survey, where 71% of respondents identified as male and 27% as female.
Year | Name | Location | Age | Gender (m,f,o) | Gender % (m,f,o) |
2019 | EAG | London | 27.4 ± 6.13 | 242, 98, 5 | 70, 28, 1 |
2020 | EAG V | (San Francisco) | 27.5 ± 5.54 | 70, 48, 4 | 57, 39, 3 |
2020 | EAGx V | (Berlin) | 29.1 ± 8.29 | 236, 104, 10 | 67, 30, 3 |
Table 2: analysed EAG(x,v) events which include demographics information. The age column shows the mean age ± standard error for the event (only including participants who identified their ages). The gender column lists the number of participants identifying as male, female, and other.
Affect measures
For the analysis of all conference datasets, we looked into two affect measures: satisfaction and LTR scores. CEA expected these two measures to be highly correlated. Surprisingly, however, they appear to be associated with different variables. To get a handle on the data, we applied a broad distinction between community-related variables (e.g. “feeling welcome”, “number of new people connected with”), content-related variables (e.g. “quality of talks”) and logistics-related variables (eg. “satisfaction with food”).
Conference recommendation, LTR
Our results show that the LTR score correlates best with community-related variables, although none of the correlations are strong (13-21% of variance explained by models).
Figures 1 A-C show prediction scores for the LTR score at EAG London 2018 and 2019, as well as at the three EAGx conferences of 2019. The x-axis denotes an “importance” score, which can be understood as the degree of association with the dependent variable [1]. For all three conferences (or groups of conferences, in the case of EAGx), a cluster of community variables returns the best predictive value for the LTR score.
The virtual EAG of March 2020 (not depicted in the figures because satisfaction measures were not queried) was the exception; in this case, content variables turned out to be more important. It is noteworthy that the virtual EAG in March 2020 was the first virtual conference which CEA organised, and on very short notice. Possible explanations for the result include unusually high-quality content and/or lower-quality community activities (for example, Slack and other applications were employed as a replacement for face-to-face networking).
At the second virtual event, EAGx in June, community variables once again returned the best predictive value for the LTR. This event saw the addition of an icebreaker session and a higher number of moderators for the common Slack workspace.
We note that at EAG 2019 in San Francisco, and only for this event, CEA asked respondents how strongly they would recommend EA in general. This variable correlated well with the participants’ LTR scores.
Figure 1A: LTR score prediction at EAG London 2018. The variance explained by the model we used was 21%. The community category seems to be most important of the three.
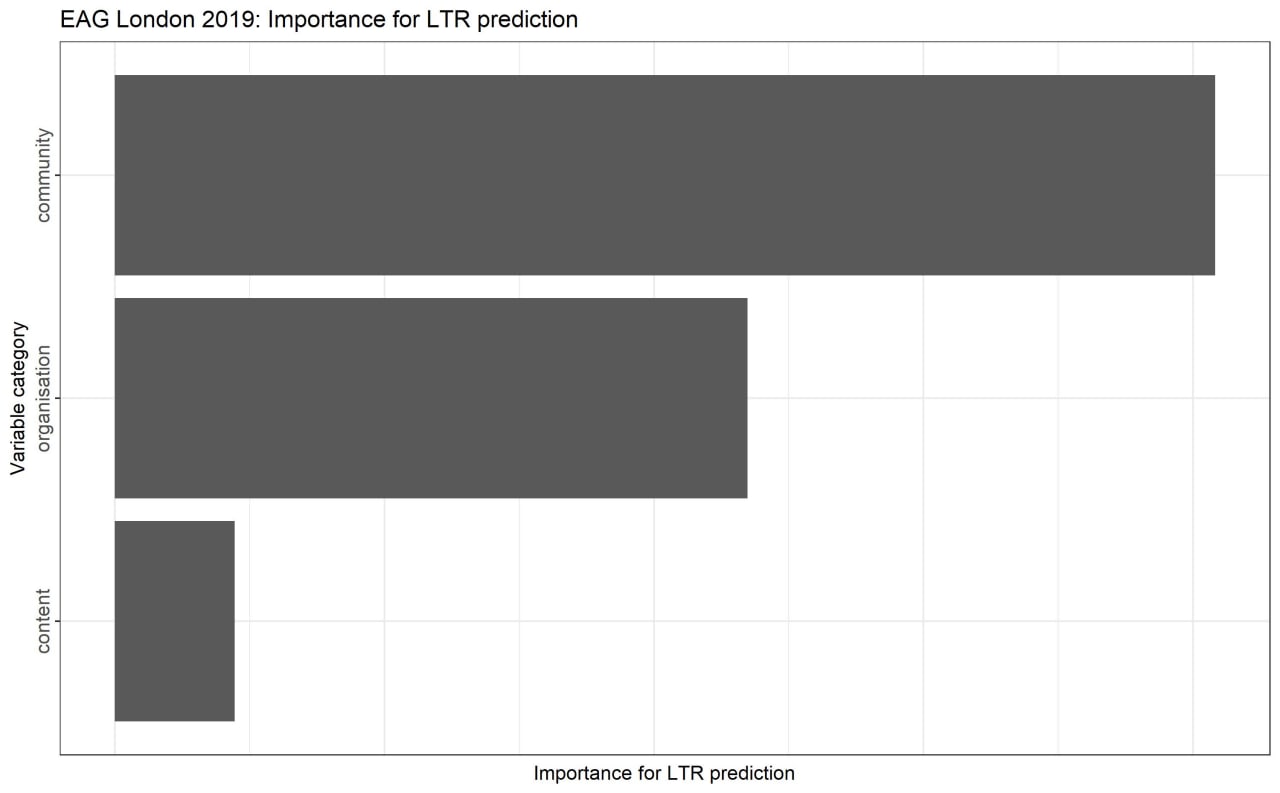
Figure 1B: LTR score prediction at EAG London 2019. The variance explained by the model we used was 13%. The community category seems to be most important of the three.
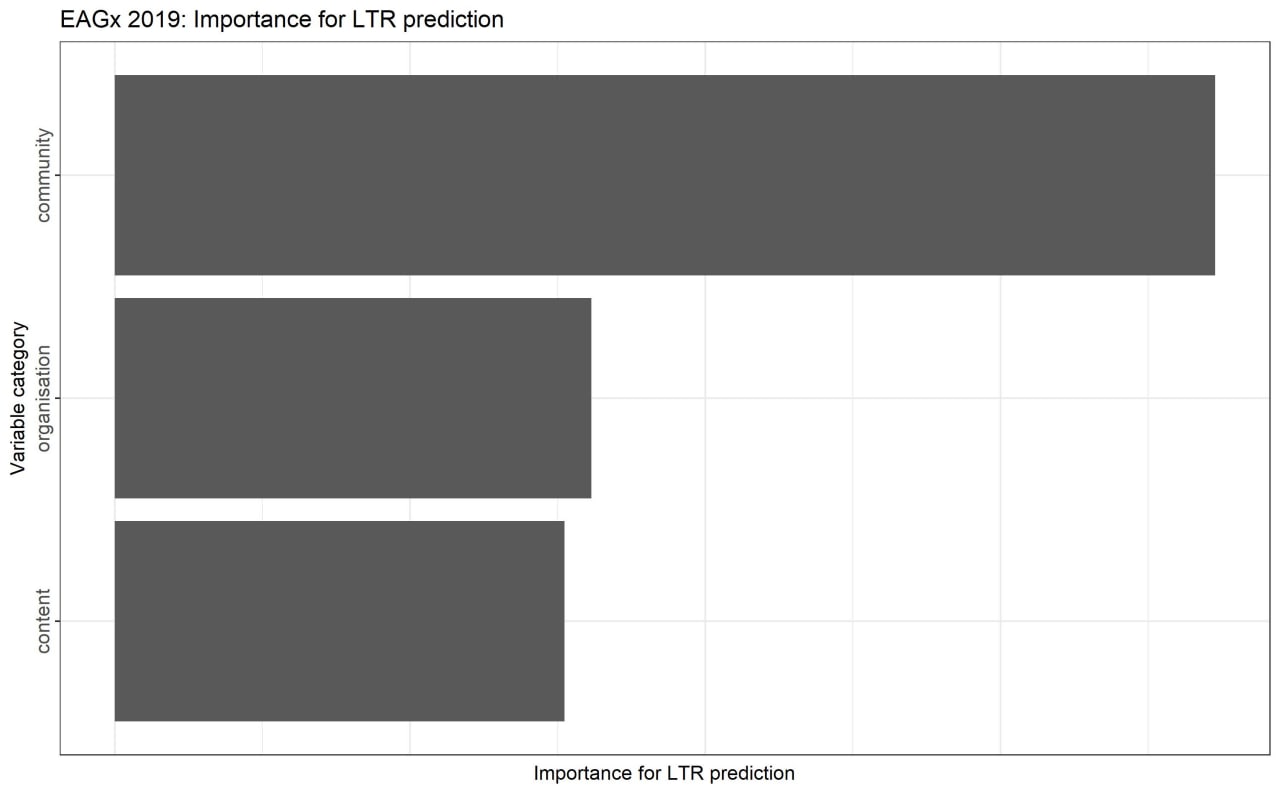
Figure 1C: REC score prediction at the EAGx conferences held in 2019. The variance explained by the model we used was 20%. The community category seems to be most important of the three.
Conference satisfaction
Figures 2 A-C show prediction scores for overall conference satisfaction, once again for EAG London 2018. EAG London 2019, and the three EAGx conferences of 2019.
Compared to community variables, content and logistical variables returned relatively better predictive values for satisfaction than they did for LTR. At the 2018 EAG London conference, we found roughly the same predictive value for community-, content-, and logistical variables. At the 2019 EAG London conference, community variables were a clear second behind logistical variables. This trend is strongest at the 2019 EAGx conferences, where community variables are a distant third behind content and logistical variables.
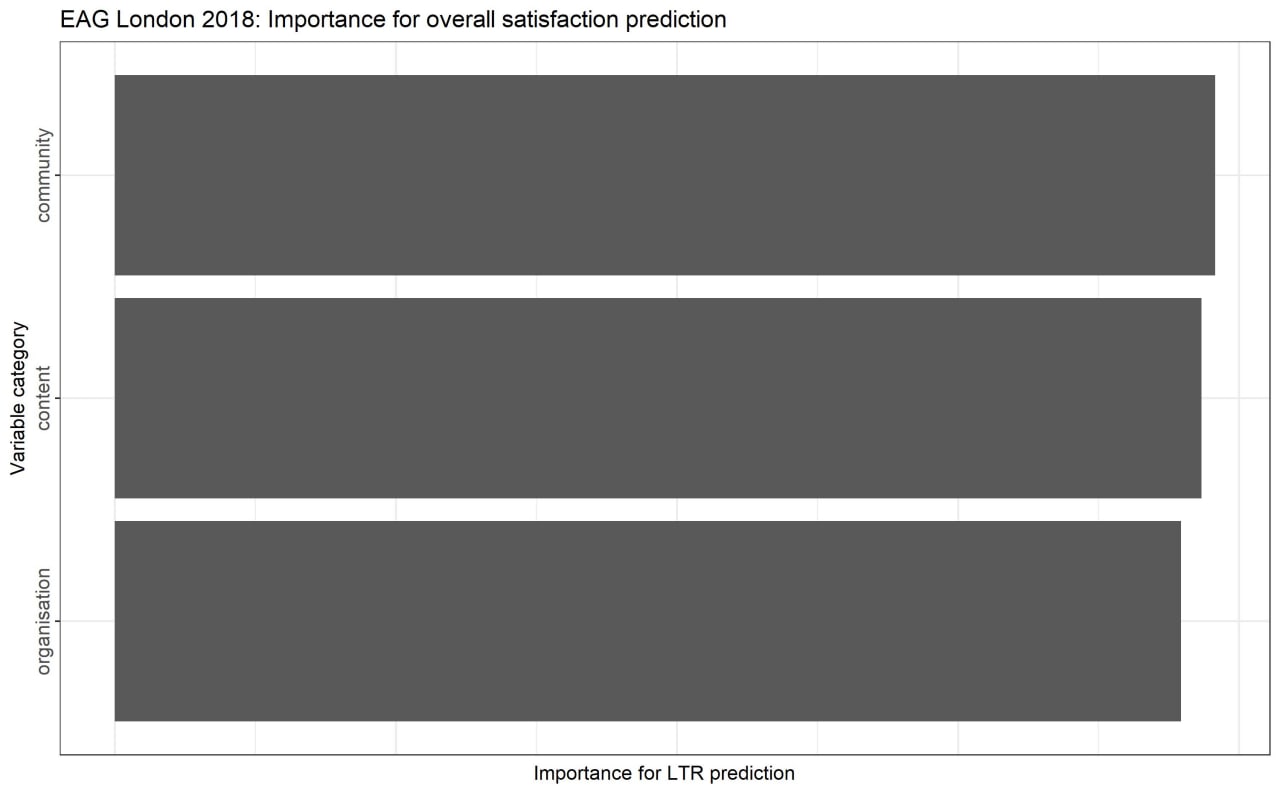
Figure 2A: satisfaction prediction for EAG London 2018. The variance explained by the model we used was 38%..
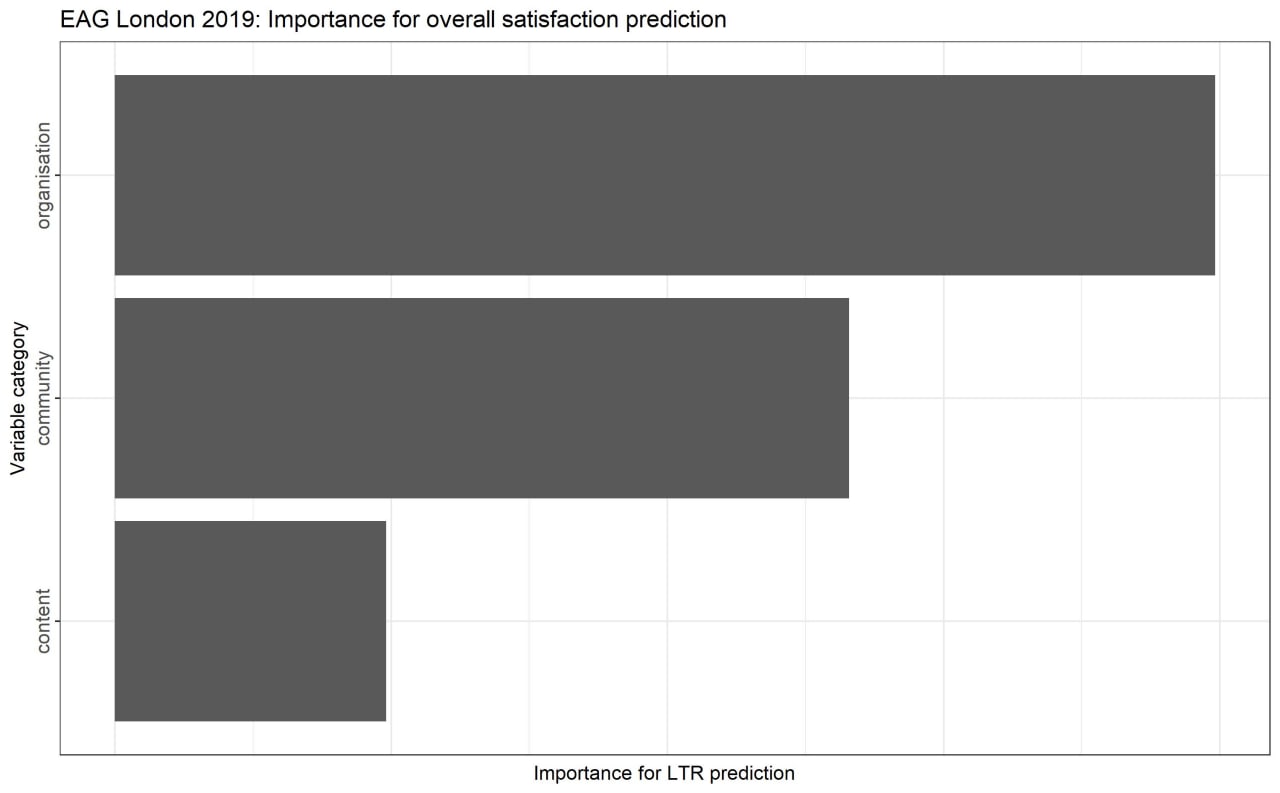
Figure 2B: satisfaction prediction for EAG London 2019. The variance explained by the model we used was 31%.
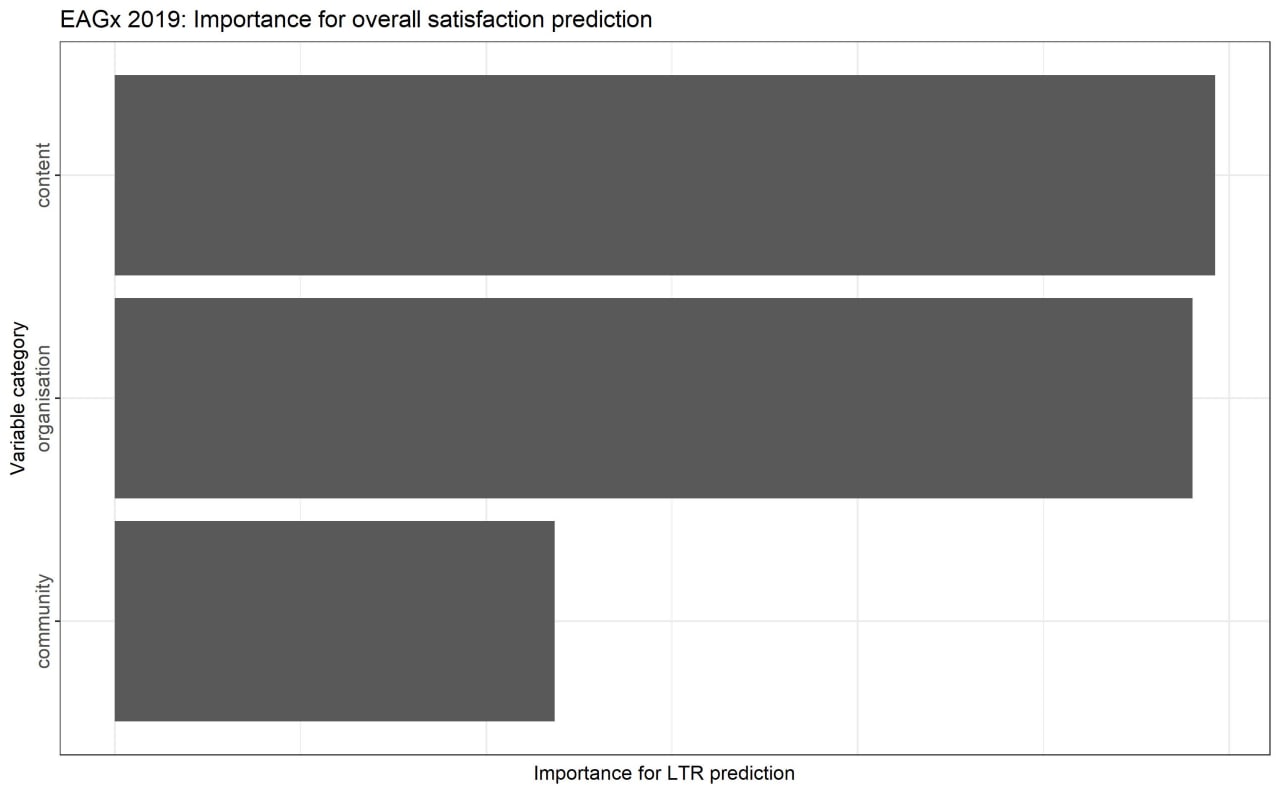
Figure 2C: satisfaction prediction for the EAGx conferences 2019. The variance explained by the model we used was 53%.
Summary on affect measures
In an attempt to better understand the discrepancy between predictors of LTR and satisfaction scores, we performed additional analysis of the data of respondents who reported high satisfaction but a low LTR score or vice-versa. However, we didn’t find any noteworthy results in the process.
Overall, our results suggest that conference organizers should, on the margin, focus on community-related activities like networking and making attendees feel welcome, especially if they are running an in-person event. However, our evidence is mixed, and it’s important to keep context in mind; conferences with a different mix of content than EA Global may benefit from different foci on the margin.
We also emphasize that neither LTR nor satisfaction are predicted especially well by any of the variables we analysed. These two measures, which CEA expected to be correlated, are in fact not well correlated, implying that EAG(x,v) conference organisers should be cautious about interpreting these results (and similar results from their own events).
Demographics of new vs returning conference attendees
Do demographic variables predict whether attendees will return?
CEA also asked us to analyse the demographics (gender, ethnicity, age) of returning vs new attendees, to see how/whether these variables correlated with attendees’ likelihood of returning to EAG(x,v) conferences.
For this analysis, we used a statistical test [2], applied to each of gender, ethnicity and age data for EAG Virtual 2020. We found no significant differences in previous attendance scores within gender, and age. However, white attendees were significantly more likely than non-white attendees to have attended at least one other EAG(x,v) before.
We also examined data on two other survey questions:
As a result of this EA Global, roughly how many new people in the EA community do you feel able to reach out to (e.g. to ask a favor)?
How many one-on-one meetings did you have that meaningfully improved your ability to do good?
We found no significant differences in either variable for attendees of different genders, ethnicities, and ages.
Figures 3 A-B show the variables “New people reachable” and “Number of meaningful 1:1s” respectively, divided by the gender categories female, male, non-binary, and “no answer”. Figures 4 A-B depict the same variables divided into non-white, white, and “no answer”.
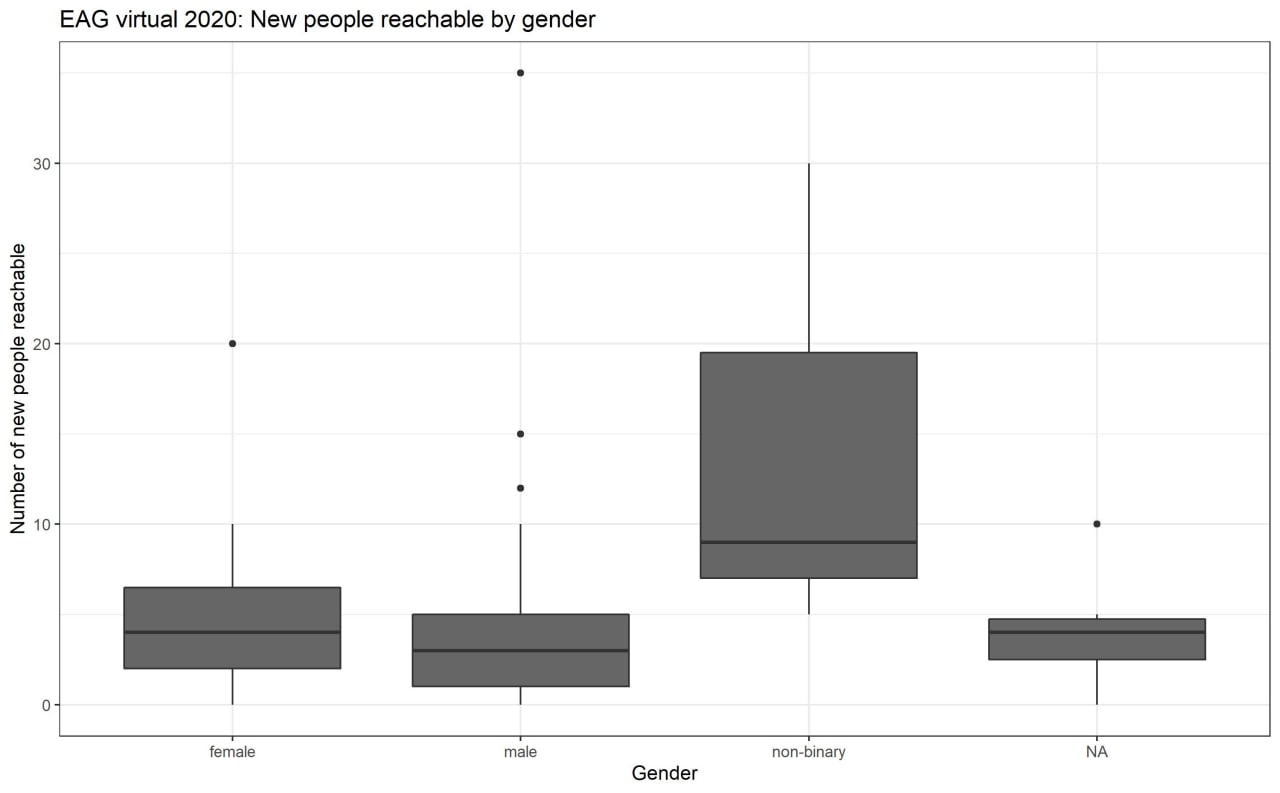
Figure 3A: EAG Virtual 2020 box and whisker plot of the variable “New people reachable” divided by gender. Only three respondents identified as non-binary. There was no significant difference for females compared to males.
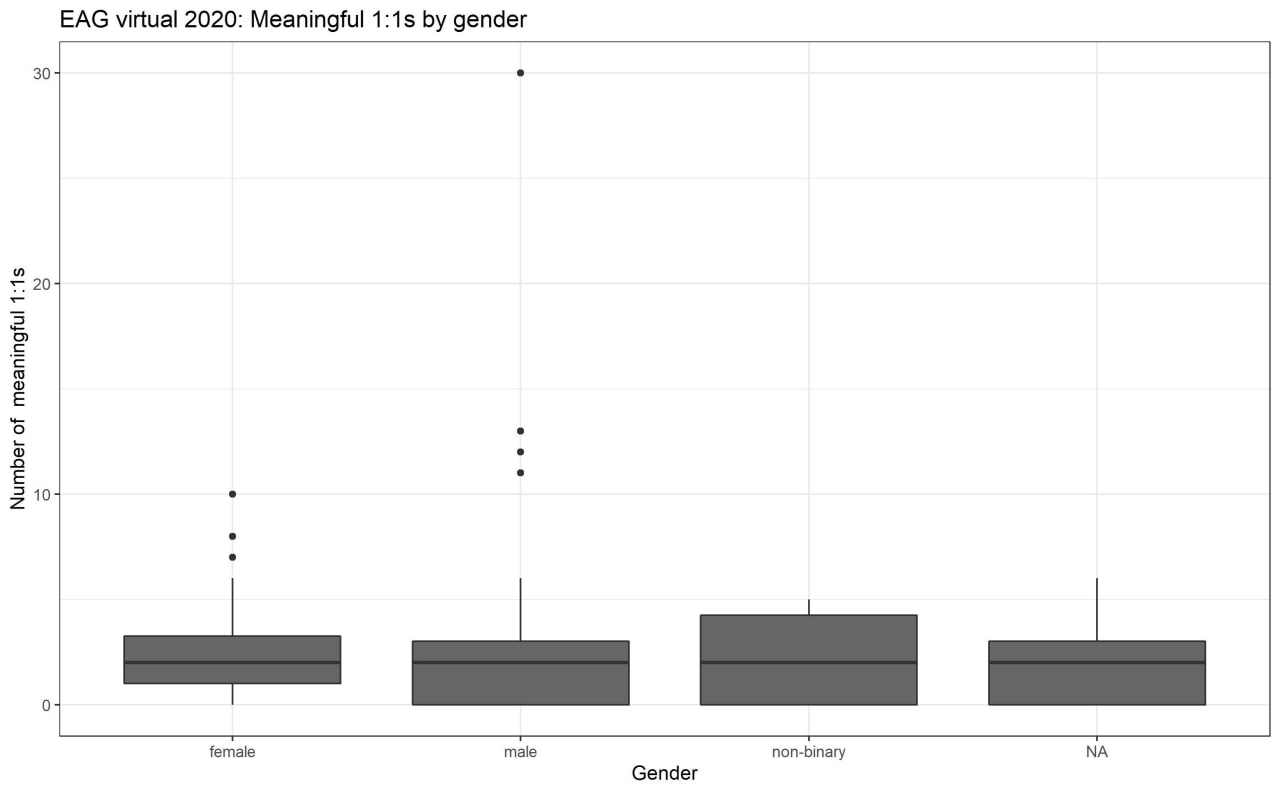
Figure 3B: EAG Virtual 2020 box and whisker plot of the variable “Number of meaningful 1:1s”, divided by gender. There was no significant difference between the three gender groups.
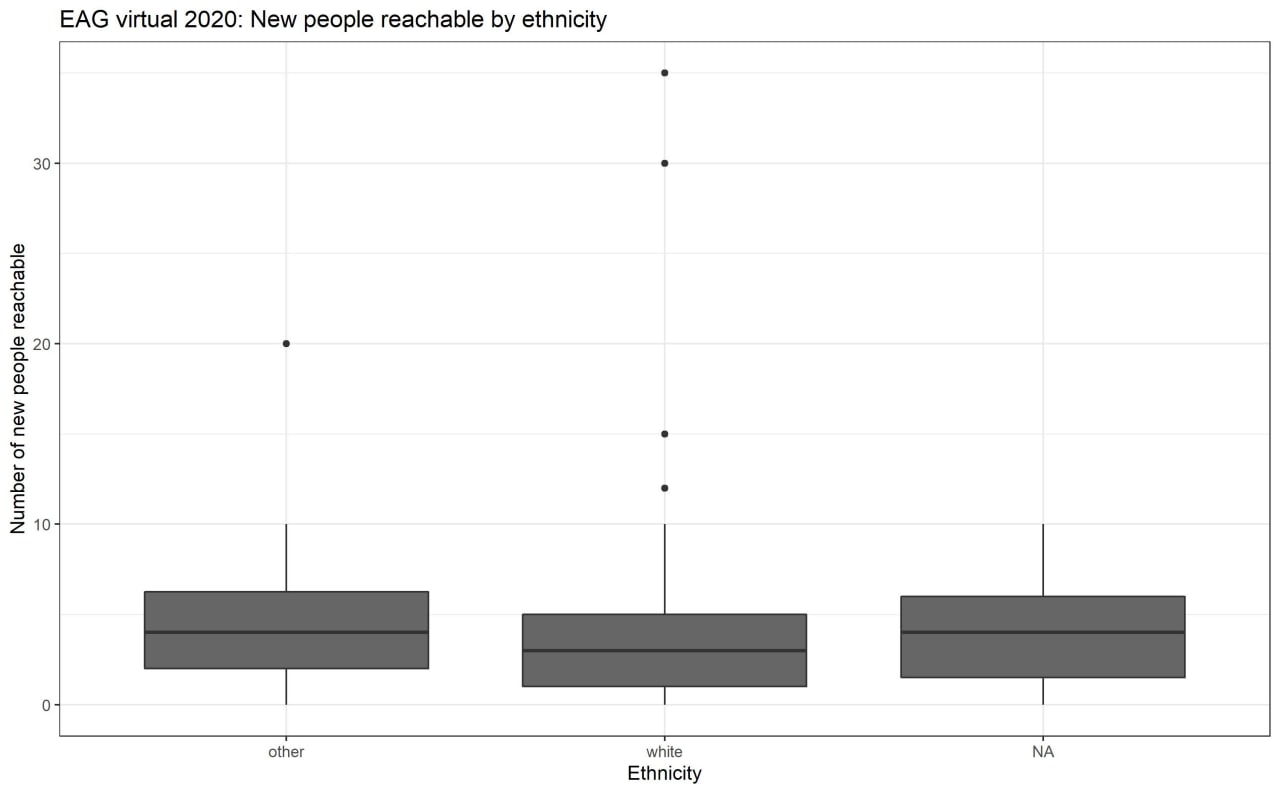
Figure 4A: EAG Virtual 2020 box and whisker plot of the variable “New people reachable” divided by ethnicity. There was no significant difference between respondents identifying as non-white vs white.
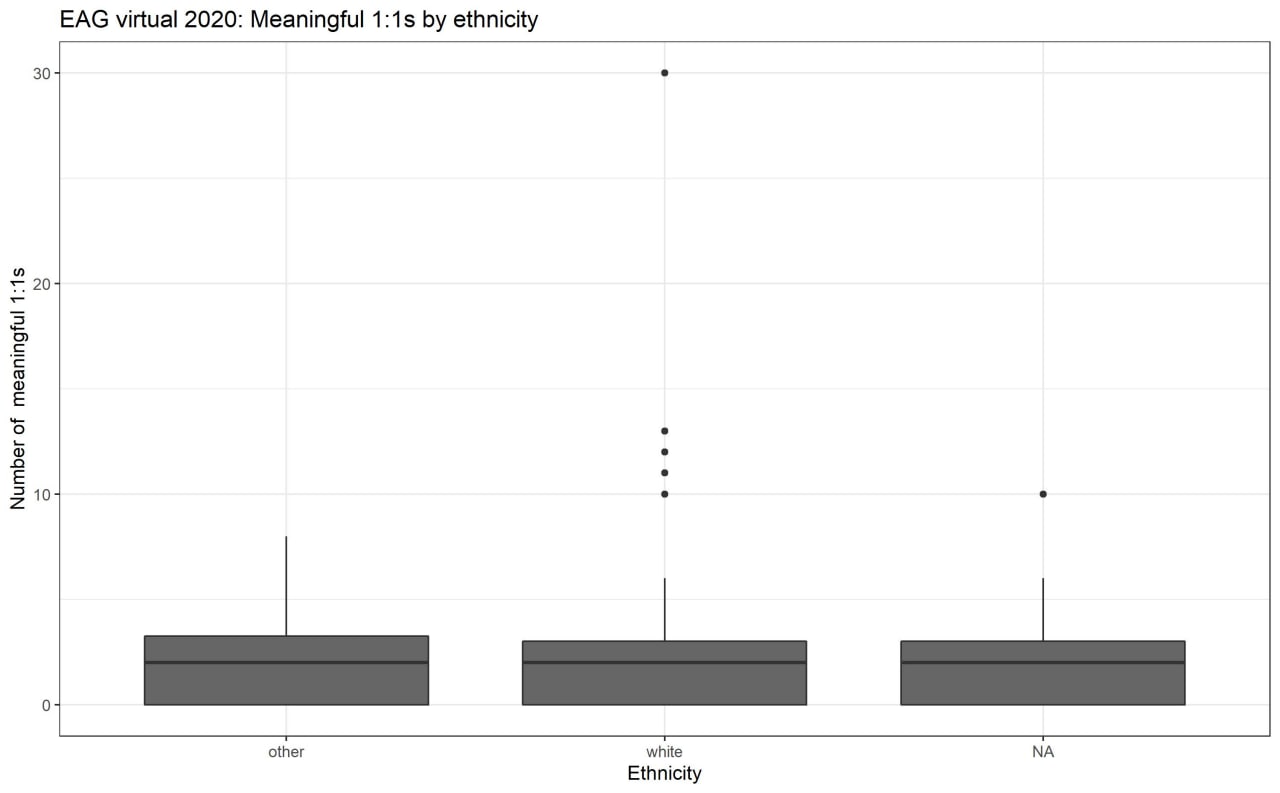
Figure 4B: EAG Virtual 2020 box and whisker plot of the variable “Number of meaningful 1:1s”, divided by ethnicity. There was no significant difference between respondents identifying as non-white vs white.
Limitations of the analysis
We excluded the 2016 and 2017 post-EAG surveys from our analysis, due to their significant structural differences from later surveys. The amount of usable data was further reduced by the fact that questions in the 2018 − 2020 surveys sometimes differed from event to event. For example, the surveys for the 2020 virtual events did not ask about overall conference satisfaction.
As our models “only” examine the correlation between different variables and LTR, we cannot make any conclusive statements about a causal relationship linking “higher scores for community-related activities” to “higher LTR”. Technically, it is possible that the connections we found are spurious and do not represent the true causal mechanism which leads people to recommend an event more highly. However, our findings are certainly compatible with the notion that community variables are a key factor in the value of in-person conferences.
Footnotes
[1] We calculated this variable importance evaluation function using an ensemble of bootstrap-aggregated classification trees. The importance itself is computed by a difference between two prediction accuracies recorded per classification tree. This difference is then summed over all trees, and normalised by the standard error. For more details on variable importance, see section 15 of the documentation for the R caret package (Classification And Regression Training).
[2] The Wilcoxon rank sum test with continuity correction
On behalf of CEA, I’d like to extend a huge thank you to the SEADS team. The correlation between satisfaction, LTR (likelihood to recommend), and other variables (or lack thereof) is something that’s featured in numerous discussions here at CEA, and I would encourage all EA event organizers to consider it. Their demographic analysis has informed our diversity work (e.g. before this analysis, we suspected there would be more of a correlation between gender/ethnicity and connections).
Also, while not mentioned in this document, the primary metric that the EA Forum uses was changed because of their work.
And of course, I greatly appreciate them not just doing this analysis, but also taking the time to clean it up and present publicly!
Notably, this accords with 2019 EA Survey data, which found no significant differences in number of close EA connections based on gender or ethnicity.
Can you share the data and or code?
Not the data, unfortunately. We can share the code though. Please PM me if you’re still interested.
Lack of power or a tightly bounded null effect? Note that even without “strong statistical significance” in standard tests we can meaningfully update our beliefs.
Of course we may need to adjust for multiple testing.
Also, statistical inference after machine learning presents some challenges. Relevant here?
We saw no systematic bias on a relevant order of magnitude. So yeah, we mean a null effect. Note the exception in Fig 3A: n=3 for non-binary respondents, where the sample size is very small.
Perhaps this could be presented earlier on— to me it seems likely that there is reverse causality, other channels, etc.