Why EA should (probably) fund ceramic water filters
Epistemic status: after researching for more than 80 hours each, we are moderately certain that ceramic filters (CFs) can be more cost-effective than chlorination to prevent waterborne diseases at least in some—and possibly in many—LMICs. We are less certain of the real size of the effects from CFs, and how some factors like household sizes affect the final cost-effectiveness.
At least 1.7 billion people globally used drinking water sources contaminated with feces in 2022, leading to significant health risks from waterborne enteric infections. According to the Global Burden of Disease (GBD) 2019 study, more than 2.5% of total DALYs lost that year were linked to unsafe water consumption—and there is some evidence that this burden can be even bigger.
This makes the improvement of access to clean water a particularly pressing problem in the Global Health and Development area.
As a contribution to target this problem, we have put together a report on ceramic water filters as a potential intervention to improve access to safe water in low and medium income countries. This was written during our time as research fellows at Charity Entrepreneurship’s Research Training Program (Fall 2023).
In this post, we summarize the main findings of the report. Nonetheless, we invite people interested in the subject to check out the full report, which provides much more detail into each topic we outline here.
Key takeaways:
There are several (controlled, peer-reviewed) studies that link the distribution of ceramic filters to less frequent episodes of diarrhea in LMICs. Those studies have been systematically reviewed and graded low to medium quality.
Existing evidence supports the hypothesis that ceramic filters are even more effective than chlorination to reduce diarrhea episodes. However, percentage reductions here should be taken with a grain of salt due to lack of masking and self-report and publication biases.
Despite limitations in current evidence, we are cautiously optimistic that ceramic filters can be more cost-effective than chlorination, especially in countries where diarrheal diseases are primarily caused by bacteria and protozoa (and not by viruses). Average household sizes can also play a role, but we are less certain on the extent to which this is true.
We provide a Geographic Weighted Factor Model and a country-specific back-of-the envelope analysis of the cost-effectiveness for a hypothetical charity that wants to distribute free ceramic filters in LMICs. Our central scenario for the cost-effectiveness of the intervention in the top prioritized country (Nigeria) is $8.47 U.S. dollars per DALY-averted.
We ultimately recommend that EA donors and meta-organizations should invest at least some resources in the distribution of ceramic filters, either by bringing up new charities in this area, or by supporting existing, non-EA organizations that already have lots of expertise in how to manufacture, distribute and monitor the usage of the filters.
Why ceramic filters?
There are plenty of methods to provide access to safe(r) water in very low-resource settings. Each one of those has some pros and cons, but ceramic filters stand out for being cheap to make, easy to install and operate, effective at improving health, and durable (they are said to last for a minimum of 2 years).
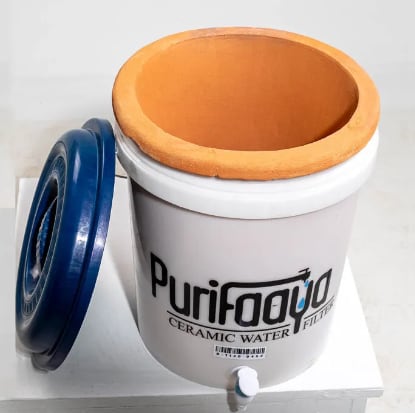
In short, a ceramic filter is a combination of a porous ceramic element and a recipient for the filtered water (usually made of plastic). Water is manually put into the ceramic part and flows through its pores due to gravity. Since pores are very small, they let water pass, but physically block bigger particles—including bacteria, protozoa and sediments—from passing. It is also common for manufacturers to add colloidal silver to the ceramic, which adds another layer of protection by acting as a biocide and preventing growth of bacteria on the surface of the filter.
(a)
(b)
Image of a bucket ceramic filter available for sale in Rwanda and Uganda (a) and a diagram of its internal anatomy (b). Source: Spouts of Water, n.d..
We have briefly investigated multiple point-of-use (POU) treatment methods suggested by UNICEF, and ultimately concluded that the properties of ceramic filters made them a good candidate for distribution in scale in low resource settings, with low unit cost and low instruction and maintenance burdens[1]. At the same time, we take advantage of the fact that GiveWell has already investigated (and funded) chlorination as a water treatment method, and use this as a benchmark to compare ceramic filters with.
How would a charity operate to promote the usage of ceramic filters?
The flowchart below provides a graphical representation of the Theory of Change (ToC) we idealize that a charity could implement to distribute free ceramic water filters to populations with low access to clean water in LMICs.
The proposed charity’s Theory of Change is structured around a series of activities leading to desired outputs, outcomes, and eventual impact. The initial phase consists of four key activities: (1) Identifying areas lacking access to clean water and affordable filtering solutions; (2) manufacturing ceramic filters; (3) distributing these filters at the household level; and (4) providing households with education on the proper use and maintenance of these filters. The successful execution of these activities is expected to yield two primary outputs: (5) Community members knowing how to correctly use the filters, and (6) consistently using them. The ultimate goal of this program, reflected in the outcomes and impacts, is threefold: (7) increasing access to cleaner drinking water, (8) significantly reducing the incidence of diarrhea and other waterborne illnesses, and (9) enhancing the overall health of the community.
In the full report, we discuss all of our assumptions and uncertainties behind this causal chain. But, in short, our current biggest concerns about this ToC are related to the ease of manufacturing filters locally (2); the logistics of distribution, filter lifespans and suitability of free versus paid (subsidized) distribution (3); and the rate of adherence (6).
What evidence is there to indicate ceramic filters can be an effective way of preventing diarrheal diseases in LMICs?
We have analyzed in total three (partially overlapping) systematic reviews that investigate ceramic water filters (among other POU water treatment methods). The more comprehensive of the three is a Cochrane Review by Clasen and colleagues (2015), so our analysis mostly relies on it.
According to this review, the pooled risk ratio for diarrhea episodes in the general population subject to POU ceramic filtration interventions was 0.39 (95% CI: 0.29-0.53, 12 studies—all of them cluster-RCTs -, moderate quality evidence, n=5,763, I²=91%). This means, on average, people in clusters that received ceramic filters reported suffering from 61% less episodes of diarrhea than people in control clusters. This is especially substantial because POU chlorination cluster-RCTs had a pooled effect of only 23% for reducing diarrhea episodes in this same review (RR 0.77, 95%CI 0.65-0.91, 14 studies, low quality evidence, n=30,746, I²=91%).
We performed our own subgroup analysis of the ceramic filtration studies selected by Clasen and his colleagues. In this analysis, we separately considered an intervention that provided Water, Sanitation and Hygiene (WASH) education together with delivering the filters. We also excluded one study conducted only with HIV-positive subjects, and a study that had been misclassified as using ceramic water filters, but actually used a membrane filter.
Our final estimate was that the distribution of ceramic filters with_out_ significant WASH education has a pooled effect of 53% for reducing diarrhea episodes (RR 0.47, 95% CI: 0.41-0.54, 8 studies, n=3,011). We also estimate that adding a WASH education component to the intervention may increase this effect by an additional 12 percentage points (RR 0.35, 95% CI: 0.26-0.47, 1 trial, n=432), but we put low weight on this number because it comes from a single study.
Besides RCTs, there are also some real-world examples that this sort of intervention can be implemented. While researching ceramic filters, we found at least 8 organizations who already work with local manufacturing and distribution of these filters in LMICs for quite a few years. For example, we have interviewed two field experts from Pure Home Water, a nonprofit from Ghana that has been using ceramic filters since 2015 to prevent transmission of water borne tropical diseases. These interviews helped us check on some assumptions from our ToC and polish some numbers from our cost-effectiveness analysis.
Where would this intervention be most cost-effective and likely to succeed?
To answer this question, we developed a Geographic Weighted Factor Model (GWFM) considering four factors:
The rate of DALYs lost due to diarrheal diseases caused by bacteria and protozoa, attributed to unsafe water consumption per country (50% of the weight). This accounts for the scale of the problem in each country. However, we restrict our analysis to bacteria and protozoa because ceramic filters are not considered effective against viruses, and therefore should not be very cost-effective where disease burden from viruses is comparatively higher.
The Purchase Power Parity conversion factors from the World Bank (25% of the weight). This was used as a proxy for the cost of operating in each country.
The average household size for the country_ (10% of the weight)_. We consider this relevant because, in general, we expect to distribute only one filter per household. Therefore, the more people in a given household, the more people served with the same initial cost. (While we see some theoretical reasons why the filter lifespan should also be reduced with greater usage, we expect this effect to be less than linear, so the cost-effectiveness would still increase in larger households).
The 2023 Fragile State Index (15% of the weight). This is used as a way of de-prioritizing highly unstable countries that may be very difficult to work with/in. Besides using it as a weighted criteria, we also apply a hard cutoff on this factor to remove such countries.
The resulting GWFM was built in accordance with Charity Entrepreneurship’s guidelines for Weighted Factor Models. The five top prioritized countries according to the selected criteria and weights were[2]:
Nigeria
Burundi
Cameroon
Eritrea
Mali
How cost-effective can this intervention be?
We have assembled some back-of-the-envelope calculations (see video here) of the cost-effectiveness of this intervention. These can be adapted to any country for which we have found underlying data. In our full report, we provide estimates for Kenya, Malawi and Uganda (because they were the countries considered in GiveWell’s previous cost-effectiveness analysis of chlorination interventions), and for Nigeria (the top prioritized country in our GWFM).
The costs considered were based on four organizations who reported prices on the ceramic filters they manufactured (on average, $17.62 per unit), plus a 50% delivery/overhead cost. We also separately consider the cost for delivering a WASH education package together with the filter (estimated at an additional $12.70 per household). These costs were divided by the country’s average household size and by the filter lifespans (conservatively set at 2 years) to get the costs per person served per year.
The effectiveness calculation per country was performed in a separate spreadsheet (with an accompanying introduction video). For this, we tried to emulate GiveWell’s analysis of chlorination interventions where possible. However, we diverge from it in that we use odds ratios for all-population diarrhea episodes (from our subgroup analysis of Clasen et al., 2015) and consider it a proxy for reductions in morbidity and mortality—GiveWell, instead, considered reductions in mortality of under-5 years-old children. We also introduce a new external validity adjustment to make reductions in diarrhea cases proportional to the relative burden caused by the relevant pathogen groups (bacteria and protozoa for ceramic filters; bacteria and viruses for chlorination).
The effectiveness calculations considered impacts coming from reductions in morbidity and mortality both for the under-5s and 5-and-over populations, according to GBD (2019) numbers, filtered for relevant etiologies and multiplied by the estimated effects of the interventions. For mortality and morbidity, we considered both direct reductions in enteric diseases and multiplied them by GiveWell’s estimate for the size of the Mills-Reinke phenomenon. We also considered medical costs averted from children under 5 years-old who would counterfactually need treatment; and estimated the developmental effects on the population up to 14 years old.
The following two tables summarize the results of our analysis. The first table compares the cost-effectiveness with and without a bundled WASH education component. The second table compares the cost-effectiveness (in GiveWell’s moral weight units, equivalent to 1 unit increase in log(consumption) for one individual over a year) for chlorination interventions and ceramic filter interventions. Chlorination interventions were evaluated both using GW’s original numbers and by replicating our analysis with the odds ratios for POU chlorination interventions from Clasen et al. (2015).
Table 1. Comparison of methodological differences between GiveWell (2022) analysis of chlorination interventions and our analysis of ceramic filters.
| GiveWell (2022) on chlorination interventions | Present analysis on ceramic water filters | |
|---|---|---|
| Primary measure | Primary measure was the risk ratio for all-cause mortality for children under 5 years old and for children and adults 5 years old or older. | Primary measure was the risk ratio for diarrhea episodes among the population of all ages. |
| Safe water vessels | Considered outside the scope of the intervention and discounted from the effect through an internal validity adjustment. | Considered an integral part of the intervention and accounted for in the unit cost of delivering the intervention. |
| WASH education | Considered outside the scope of the intervention and discounted from the effect through an internal validity adjustment. | Considered outside the scope of the intervention and discounted from the effect through a subgroup analysis of RCTs. |
| External validity adjustments | Adjusted by the proportion between mortality observed in control groups in the considered RCTs, versus deaths linked to water quality from GBD 2019. | Adjusted by the proportion of the burden of diarrheal diseases caused by bacteria and protozoa, versus all diarrheal diseases in the countries with RCTs considered, according to GBD 2019. |
Table 2. Comparison of CEA results for water treatment interventions in Kenya.
| Moral weight units per 100,000 people served per year* | Cost per person served per year (USD) | Moral weight units per USD $10,000 donated* | |
|---|---|---|---|
| Country: Kenya | |||
| In-line chlorination—GiveWell’s original analysis | 4,284 | $1.68 | 255 |
| Dispensers for Safe Water—GiveWell’s original analysis | 2,616 | $1.68 | 156 |
| “Generic” chlorination intervention—our analysis | 4,538 | $1.60 | 270 |
| “Generic” ceramic filtration intervention without education—our analysis | 12,485 | $3.44 | 363 |
| Country: Malawi | |||
| Dispensers for Safe Water—GiveWell’s original analysis | 6,000 | $1.86 | 342 |
| “Generic” chlorination intervention—our analysis | 3,773 | $1.60 | 235 |
| “Generic” ceramic filtration intervention without education—our analysis | 11,971 | $3.09 | 387 |
| Country: Uganda | |||
| Dispensers for Safe Water—GiveWell’s original analysis | 3,125 | $1.22 | 257 |
| “Generic” chlorination intervention—our analysis | 3,074 | $1.60 | 192 |
| “Generic” ceramic filtration intervention without education—our analysis | 9,570 | $2.12 | 452 |
_*Before leverage and funging adjustments. ** “Generic” here means we are considering the pooled risk ratios from studies listed in Clasen et al. (2015) (or a subgroup of these studies, for ceramic water filters), instead of a specific implementation (e.g., dispensers for safe water, in-line chlorination etc.). _
So, what is the bottom line?
Ceramic water filters appear to be a promising and cost-effective intervention for preventing waterborne diseases, and probably also all-cause mortality, in low and middle-income countries (LMICs).
Here are the key takeaways:
Cost-effectiveness: We found the cost-effectiveness of our proposed ceramic filter intervention to be $67 dollars per DALY in Kenya, $54 dollars per DALY in Uganda, and $8 dollars per DALY in Nigeria. Further, we found ceramic filters to be 1.3, 2.4, and 3.7 times more cost effective than chlorination in Kenya, Uganda, and Nigeria, respectively.
Ceramic filters compared to chlorination: We believe both ceramic filter and chlorination interventions are cost-effective, and the optimal choice depends on factors like disease prevalence and household size. Ceramic filters are often better suited for areas with more bacteria and protozoa-caused diarrhea cases and larger households, while chlorination may be preferable in regions with more viruses or smaller households. To explore these differences in more detail, we’ve created a CEA spreadsheet where you can input any country and compare the cost-effectiveness of ceramic filters and chlorination side-by-side.
Collaboration: EA donors and organizations should consider partnering with existing non-EA organizations already working with ceramic filters in LMICs. This collaboration can leverage existing expertise, avoid duplication of efforts, and potentially lead to faster, more effective, and culturally sensitive interventions that respect local communities.
Recommendations: Based on the available evidence, the report recommends that EA donors and organizations seriously consider investing in a ceramic filter charity, either by supporting existing charities or launching new ones focused on this intervention.
**Areas for further research: **
Investigating whether funders should allocate money towards existing charities, towards incubating new charities, or both.
Exploring evidence that directly links ceramic water filter usage to reductions in morbidity and mortality (instead of only diarrhea episodes).
Investigating the relationship between household sizes and filter lifespans, and possibly adjusting our CEA accordingly.
Investigating the potential value of comprehensive WASH interventions alongside ceramic filters to enhance overall health outcomes and cost-effectiveness.
Examining behavioral constraints to the adoption of ceramic filters, especially in top prioritized countries.
Using proper uncertainty intervals to model the cost-effectiveness, instead of point estimates of best and worst-case scenarios.
Experimenting with adjustments for biases in self-reported data and publication bias, or further looking for RCTs that are more resilient to these biases.
Overall, ceramic water filters offer a promising avenue for improving water quality and health in LMICs. While further research is needed to refine cost-effectiveness estimates and address implementation challenges, the potential benefits appear significant enough to warrant further investment and exploration.
Acknowledgements and final notes
Both authors contributed equally to this report.
We are extremely grateful to our advisors Leonie Falk and Erik Hausen for their guidance on this report; to Morgan Fairless for the review and suggestions; and to Joel McGuire and Jame Montavon for the informal reviews. We also thank Yvette Neh and Michael Anyekase from Pure Home Water for kindly sharing their time and knowledge with us. And, of course, we are grateful to Karolina Sarek and the whole CE staff who made RTP possible, and to our fellow colleagues from the RTP Fall 2023 cohort, for exchanging ideas with us and giving us support and encouragement.
For questions about the content of this research, please contact Bernardo Baron at bc.bernardo@hotmail.com and Juan Benzo at jfbenzo13@gmail.com. For questions about the research process, please contact Leonie Falk at leonie@charityentrepreneurship.com.
Notes
- ↩︎
This is not to say other methods can not be useful in certain scenarios. In particular, we recommend further research on solar disinfection methods, which seem potentially cost-effective in some particular settings.
- ↩︎
Chad, Central African Republic, South Sudan, Somalia and Niger were also selected among the top 10 countries, in various positions. Yet, Chad, Central African Republic, South Sudan and Somalia were excluded due to our cutoff based on the Fragile State Index. And Niger was manually excluded because it underwent a hostile regime change in mid-2023, and we believe the latest Fragile State Index available does not reflect the new situation on the ground.
Thanks for this report, it makes a lot of sense and reads well! I agree that ceramic water filters can be a great solution. We use ceramic candles at home to filter the rainwater we drink, that we catch off our outdoor toilet roof. This actually reminds me to replace our candles, we haven’t in far too long...
My intuition likes this intervention especially in areas which have...
Very high disease burden plus one of the 2 issues below
Sparse population, where other cleaning methods might be even more expensive
Conflict, as one off deliveries could reach households in areas where ongoing chlorine projects might be hard to maintain
My first thought is have you reached out directly to Evidence Action and Givewell to ask about why they went so hard on chlorination and not ceramic filters? Given that in many scenarios (especially in remote hard to reach areas) ceramic filters seem to clean the water more cheaply than chlorine (either with direct or inline) I would imagine they have good reasons why they preferred chlorination to filters, given that they have gone all in on them spending tens of millions of dollars as their preferred cleaning method.
I’m most interested in your decisions around your primary outcome measure (I think the crux of your DALY burden reduction), which was summarised in your full article like this
”Impact through mortality and morbidity was obtained by multiplying the total DALYs
lost per year due to those diarrheal diseases by 1 minus the (adjusted—see next
section) risk ratios for ceramic filters (without education) found in our subgroup. Each GiveWell moral weight unit equals the doubling in consumption for one person during a
year. A disability-adjusted life year averted equals 2.3 moral units. This number was then multiplied by GiveWell’s estimates of the Mills-Reincke effect (3.7x for under 5s and 2.35x for over 5s) to get
the effects on all-cause mortality and morbidity.”
The 2 assumptions here that I think might be shaky here are...
Your assumption here that there is a direct connection between cases of diarrhoea and mortality. We have very little clue why clean water leads to a mortality reduction, so I’m not sure its reasonable to make the leap, first that there is a causal relationship at all between diarrhoea reduction and the huge mortality reduction, and second that that connection moves linearly like is assumed here (For every % of diarrhoea reduction, mills-reincke effect moves the same).
I can’t immediately think of a great solution here, but the current method doesn’t seem right.
(Potentially shaky assumption shared by GiveWell). The 2.35 Mills Reincke multiplier for over 5s. I could be wrong but I’m not sure there’s any good data at all on mortality reductions for clean water in over 5s. The Kremer study Is the only one I know which looks directly at mortality at all, and then only in under 5s. Where does this number come from? My intuition would that the multiplier should be far smaller than this (very very uncertain).
A few other more minor points
I think 2 years is ambitious number for lifespan. Between families neglecting to use it (perhaps most important) kids breaking, families selling it (not the end of the world), dirty water clogging it etc. I would have perhaps gone for 1 or 1.5 years use as realistic, but this isn’t so important. I struggled in a 5 minute search to find decent research on ceramic filter lifespan in the real world, do you have one?”
From my experience it is borderline implausible that 5.8% of diarrhoeal episodes lead to hospitalisation. I’m not sure if you referenced where this number came from? I’ve worked in Northern Uganda for 10 years and diarrhoea is a far less common than you would expect reason for presentation to primary care (Under 3% of our OneDay Health Patients present with diarrhoea) and at best an uncommon reason for hospitalisation. I even removed treating diarrhoea from our OneDay Health cost-effectiveness analysis because it appeared insignificant (both because the effect of treating one patient is so small, and because we treat so few patients for it)
Taking a less anecdata approach, doing a ’sanity check” (Thanks @NunoSempere) We know fairly well that sub-saharan African children have something like 2-5 episodes of diarrhoea a year (data varies) If 6% of these episodes led to hospitalisation, then that would mean every 5 year old would have on average about one hospital admission for diarrhoea before the age of 5 (6% of 15 episodes), which is an absurdly high number of admissions
Kenya for example has about 7 million kids under 5, which would mean about 1.3 million hospital admissions for diarrhoea yearly which can’t eb right. Assuming each kid was admitted for 2 nights, this would mean 7100 hospital beds permanently filled with kids with diarrhoea in Kenya—most certainly not the case.
(Note this calculation was done quickly so could be plain wrong)
Also quick correction I think you mean the $8 country is Nigeria here.
“We found the cost-effectiveness of our proposed ceramic filter intervention to be $67 dollars per DALY in Kenya, $54 dollars per DALY in Uganda, and $8 dollars per DALY in Kenya.”
Anyway great job and an important contribution to the clean water discussion!
If you could be bothered as well, you could definitely get a shorter version of this published in a health economics journal—if you are interested in this maybe message me I might be able to help
Nice one!
Hi Nick! Thanks so much for your thoughtful response. Here are some of our thoughts on your questions:
Since this comment, I have reached out to Givewell and Evidence Action! Thanks for the suggestion—we had not previously reached out due to time constraints.
You’re right, the leap in assuming a causal relationship between diarrhea reduction and mortality reduction is not ideal and we aren’t assuming this is exactly correct. However, using diarrhea cases as a proxy for morbidity and mortality was the best we could come up with. We welcome any additional suggestions.
In addition, from what we saw from the individual studies considered in the systematic reviews we took into account, none seem to be powered to detect effects on mortality, and most do not report it as an outcome. To make sure reductions in diarrhea cases translate into mortality reductions, one would probably need to do what Kremer and his colleagues did for their 2015 systematic review—individually reach the authors of each study and ask whether they collected any mortality data that went undisclosed due to low statistical power. This could be further work for researchers to perform in the future.
This is a really good point. When applying the 2.35 Mills Reincke multiplier in our cost-effectiveness analysis, we were more concerned with comparing different water quality interventions than getting the exact number for a CEA (dollars per DALY). To compare ceramic filters to chlorination, we applied the same methodology as Givewell to create as close of a comparison between the two.
However, we can perform an analysis removing the Mills-Reinke effect for over 5s. This would affect our estimates both for chlorination and ceramic filters in similar ways but would lower the overall cost-effectiveness. We can likely do this next week!
You hit on an important topic, as the lifespan of the ceramic filter actually can significantly impact the overall cost-effectiveness analysis.
Our assumption of a two-year lifespan for ceramic filters in our analysis is based on a Unicef report (Unicef, 2020), which suggests a minimum two-year effectiveness. However, field insights from organizations like “Potters Without Borders” and experts at Pure Home Water indicate that, with proper care, these filters can endure beyond this conservative timeframe.
Michael Anyekase, with over 10 years of experience working with manufacturing and distributing ceramic filters in Uganda at Purehome Water (similar to our theory of change), proposes a potential lifespan of 5 to 6 years under clear water conditions.
Yvette Neh suggests an upper limit of 4 years.. Yvette Neh (who also works at purehome water), proposes an upper limit of 4 years for somewhat good water conditions. In addition, none of the experts we spoke with were overly concerned with filter breakage, and agree that this 2 year lifespan is a conservative timeline?
**We ultimately chose a 2-year filter lifespan as we believe this might be a conservative estimate, and that, in practice, these filters often last much longer. **
This intuitively makes a lot of sense, and we will look into this more deeply in the upcoming days and weeks.
Thank you! We updated this in the forum and the report!
Again, thank you so much for your thoughtful response.
Hi again, Nick! Sorry it took so long to answer your remaining points!
So, first about this one:
Taking a more careful look into the footnotes and supplemental materials for GiveWell’s discussion of the Mills-Reincke effect, it appears that they have gathered mixed evidence on its existence for the over-5 population:
This supplementary spreadsheet lists six econometric studies including overall all-cause mortality effects from water quality improvements. These are mostly natural experiments regarding the implementation of municipal water quality improvements in now-developed countries (Germany, USA, Sweden, Japan), during the 20th and early 21st centuries (a summary of all papers is available here; we have only briefly reviewed the relevant ones). Both the mean and the median effect sizes on the population-wide all-cause mortality were −19%, ranging from +0.9 to −58%. Surprisingly, this is an even larger effect size than the one observed when considering under-5 mortality alone (median: −11%; mean: −10 to −13%). This can be taken at least as some rough evidence that the MR phenomenon can be widespread across age groups. [1]
On the other hand, a long note to the “Adjustment for smaller Mills-Reincke effect in over-5s” cell of their CEA, authors of the GW report on water quality interventions mention one study (Newman et al. 2020) that looked into one of the plausible mechanisms for explaining the MR phenomenon and found no evidence of such effects on adults. However, the report’s authors argue that it may still be true for older children and adolescents:
In any case, we added a sensitivity analysis to our Effectiveness Supplement where we consider no Mills-Reincke effect for age groups over 5 y.o. And it does make a great difference. On average, it reduces the estimated (cost-)effectiveness of filtration interventions by 33%, and by 21% for chlorination interventions across all countries (simple average). For our top 5 prioritized countries, the difference is even bigger: a 43% reduction for filtration, and 36% for chlorination [2]. For Nigeria, for instance, the effectiveness lowers from ~24k DALYs/100,000 people served, to ~13k DALYs/100,000 people served.
Given the magnitude of the difference, we suggest further research would greatly benefit from trying to better understand the evidence base for or against the existence of the Mills-Reincke effect among older children, adolescents, and adults.
Note that GiveWell itself mentioned reasons to take these estimates with a grain of salt. Quoting them (end of the “Studies of historical water quality improvements” section of their report):
Differences across countries and intervention types are due to the different YLL and YLD proportions coming from each pathogen and each age group in each country (according to data from GBD 2019).
About this other point:
It took a while, but we finally found some good empirical data regarding hospitalization rates due to diarrhea in LMICs, beyond the four smaller studies GiveWell references for justifying their 5.8% estimate [1].
So, the Global Enteric Multicenter Study of Diarrheal Disease in Infants and Young Children in Developing Countries (GEMS) was a 3-year, multi-site case-control study focusing on diarrhea in children under 5 years old living in seven low-income countries in sub-Saharan Africa and South Asia (source).
Even though the main GEMS study had a focus on moderate and severe cases, it was preceded by a preparatory survey called “Health Care Utilization and Attitudes Survey (HUAS)”. According to their “Establishing a Sampling Frame for the Case/Control Study and Selecting Health Centers for Case Recruitment” section:
It turns out that the resulting data from the HUAS study is easily accessible for anyone to consult. And it recorded the number of children under 5 who reportedly had diarrhea during the 14 days previous to the interview, and whether they were admitted to a hospital.
According to this data, out of 5,171 who reportedly suffered from diarrhea in the previous 14 days, and for whom data for this variable was available, 270 children were admitted to hospitals. This gives a 5.22% hospitalization rate (95% CI: 4.65-5.86%), which is roughly what GiveWell estimated from a set of smaller studies.
Therefore, we think this part of the CEA is also roughly aligned with evidence.
The four studies are Burton et al. 2011, Page et al. 2011, Breiman et al. 2011, and Omore et al. 2013. See footnote #92 of GW’s report.
Finally, about the other points you raised, we recommend you (and everyone interested in the theme) check the new version of the report published by Ambitious Impact/Charity Entrepreneurship when recommending this intervention for CE’s next incubation round [1].
AIM/CE researchers dedicated a few hours to polishing the remaining loose ends in our previous version. It includes a model for calculating the mortality reductions based on diarrhea case-fatality rates. This is a slightly enhanced version of our model and represents an interesting proposition on how to extrapolate the effect of the intervention from cases to mortality—given more time, it could even be expanded to consider pathogen-specific case-fatality rates, which should be even better.
We, the authors of the originial report, had only very limited participation in the changes made between the two versions.
This looks very interesting!
One note: Friends Peace Teams has also been producing ceramic water filters, formerly in Indonesia and more recently in the Philippines, I believe. Unfortunately it’s not well documented on their website (I only found out about it through a talk that I went to). At that talk one of their members implied that they thought that they had a better production method based on training local people to make the filters using local materials in some way and then having them train others; I’m not really sure how this differs from other locally-produced water filter manufacturers but they implied that it was.
Link:
https://friendspeaceteams.org/wp-content/uploads/2018/06/Spring-2010.pdf
Alma “Kins” Aparece was the person who gave most of the talk and, if I remember correctly, helped facilitate the water filter making.
They very much don’t fulfill the idea of a charity focusing on one intervention (or maybe a few interventions), however; they do a wide variety of programs, most of which are focused on mediation and interpersonal training rather than clean water/other more tangible goods.
Thanks for sharing this reference, @Benjamin M. We added Friends for Peace Teams to the list of existing organizations we had found in this space.
I’d be curious to know how this approach of training multipliers went for them after a few years. Since this intervention is a somewhat intensive in infrastructure (you need to set up a small manufacturing site) and logistics, I’d be slightly surprised to learn that just teaching the production techniques to a few multipliers would have that much of an effect without at least some financial and technical assistance.