Technical Updates to Our Global Health and Wellbeing Cause Prioritization Framework
In 2019, we wrote a blog post about how we think about the “bar” for our giving and how we compare different kinds of interventions to each other using back-of-the-envelope calculations, all within the realm of what we now call Global Health and Wellbeing (GHW). This post updates that one and:
-
Explains how we previously compared health and income gains in comparable units. In short, we use a logarithmic model of the utility of income, so a 1% change in income is worth the same to everyone, and a dollar of income is worth 100x more to someone who has 100x less. We measure philanthropic impact in units of the welfare gained by giving a dollar to someone with an annual income of $50,000, which was roughly US GDP per capita when we adopted this framework. Under the logarithmic model, this means we value increasing 100 people’s income by 1% (i.e. a total of 1 natural log unit increase in income) at $50,000. We have previously also valued averting a disability-adjusted life year (DALY; roughly, a year of healthy life lost) at $50,000, so we valued increasing income by one natural-log unit as equal to averting 1 DALY. This would imply that a charity that could avert a DALY for $50 would have a “1,000x” return because the benefits would be $50,000 relative to the costs of $50.
-
Reviews our previous “bar” for what level of cost-effectiveness a grant needed to hit to be worth making. Overall, having a single “bar” across multiple very different programs and outcome measures is an attractive feature because equalizing marginal returns across different programs is a requirement for optimizing the overall allocation of resources[1], and we are devoted to doing the most good possible with our giving. Prior to 2019, we used a “100x” bar based on the units above, the scalability of direct cash transfers to the global poor, and the roughly 100x ratio of high-income country income to GiveDirectly recipient income. As of 2019, we tentatively switched to thinking of “roughly 1,000x” as our bar for new programs, because that was roughly our estimate of the unfunded margin of the top charities recommended by GiveWell (which we used to be part of and remain closely affiliated with), and we thought we would be able to find enough other opportunities at that cost-effectiveness to hit our overall spending targets.
-
Updates our ethical framework to increase the weight on life expectancy gains relative to income gains. We’re continuing to use the log income utility model, but, after reviewing several lines of evidence, we’re doubling the weight on health relative to income in low-income settings, so we will now value a DALY at 2 natural log units of income or $100,000. We’re also updating how we measure the DALY burden of a death; our new approach will accord with GiveWell’s moral weights, which value preventing deaths at very young ages differently than implied by a DALY framework.
-
Articulates our tentative “bar” for giving going forward, of roughly 1,000x (which is ~20% lower than our old bar given new units—explanation in footnote[2]). The (offsetting) changes in the bar come from new units, our available assets growing, more sophisticated modeling of how we expect cost-effectiveness and asset returns to interact over time, growth in GiveWell’s other funding sources, and slightly increased skepticism about our ability to spend as much as needed at much higher levels of cost-effectiveness. Due to the increased assets and lower bar, we’re planning to substantially increase our funding for GiveWell’s recommended charities, which we will write more about next week. However, we still expect most of our medium-term growth in GHW to be in new causes that can take advantage of the leveraged returns to research and advocacy, and could imagine that we’ll eventually find enough room for more funding in those interventions that we will need to raise the bar again. This post focuses exclusively on how we value different outcomes for humans within Global Health and Wellbeing; when it comes to other outcomes like farm animal welfare or the far future, we practice worldview diversification instead of trying to have a single unified framework for cost-effectiveness analysis. We think it’s an open question whether we should have more internal “worldviews” that are diversified over within the broad Global Health and Wellbeing remit (vs everything being slotted into a unified framework as in this post).
This post is unusually technical relative to our others, and we expect it may make sense for most of our usual blog readers to skip it.
How we previously compared health and income
We often use “marginal value of a dollar of income to someone with baseline income of $50K” as our unified outcome variable, so by definition giving a dollar to someone with $50k of annual income has a cost-effectiveness of 1x.[3] We value income using a logarithmic utility function, so $100 in extra income for a rich person generates as much utility as $1 in extra income for a person with 1/100th the income of that rich person. In order for a grant’s cost-effectiveness to be, say, 1000x, it must be 1000 times more cost-effective than giving a dollar to someone with $50k of annual income.
This can be confusing because GiveWell, which we used to be part of and remain closely affiliated with, uses contributions to GiveDirectly as their baseline unit of “1x.” In our framework, those contributions are very roughly worth 100x, because GiveDirectly recipients are roughly 100x poorer (after overhead) than our $50K income benchmark. This section of our 2019 blog post reviews how our logarithmic income model works and the “100x” calculation.
We quantify health outcomes using disability-adjusted life years (DALYs). The DALY burden of a disease is the sum of the years of life lost (YLL) due to the disease, and the weighted years lived with disability (YLD) due to the disease. If you save the life of someone who goes on to live for 10 years, your intervention averted 10 YLLs. If you prevent an illness that would have caused someone to live in a condition 20% as bad as death for 10 years, your intervention averted 20%*10=2 YLDs. (We don’t necessarily endorse the disability weights used to measure YLDs, and in principle we might prefer other methodologies, such as quality-adjusted life years (QALYs) or just focusing on YLLs. We use DALYs because global-health data is much more widely available in DALYs than in other frameworks, especially from the Global Burden of Disease project.)
The health interventions that we support are primarily lifesaving interventions (with the exception of deworming where the modeled impacts run entirely through economic outcomes) – so although we talk in terms of DALYs, most of our health impact is in YLLs. (For instance, according to the GBD, ~80% of all DALYs in Sub-Saharan Africa are from YLLs, and amongst under-5 children the same figure is 97%. For malaria DALYs the share from YLLs is even higher, at 94% overall and 98% amongst under-5 children.) We also sometimes use quasi-disability-weights for valuing other outcomes (e.g., the harm of a year of prison).
There are different approaches to calculating the YLLs foregone with a death at a given age. For instance, the life-expectancy tables in Kenya suggest that an average child malaria death shortens the child’s life by 68 years (i.e. that is the average remaining life expectancy of a 0-5 year old in Kenya).[4] This is not a floor on plausible YLLs—one could imagine that those prevented from dying by some intervention are unusually sick relative to the broader population, and accordingly not likely to live as long as a population life table would suggest—and as explained below GiveWell uses moral weights for child deaths that would be consistent with assuming 51 years of foregone life in the DALY framework (though that is not how they reach the conclusion). On the other extreme, the GBD takes a normative approach to life expectancy, saying in effect that everyone’s life expectancy at birth should be 88 years.[5] Therefore any death under age 5 has a DALY burden of at least 84 years under the GBD approach.[6] We have previously been inconsistent in this regard – following the methodology of the GBD in much of our own analysis, while deferring to GiveWell’s approach (and moral weights) on their recommendations. (In the analysis further below of our current bar, we assume for simplicity that our status quo approach splits the difference between the GiveWell and GBD approaches, and uses expected life years remaining for someone who lives to age 5 based on national-level life tables for Kenya.) Below, we explain our plan to follow GiveWell’s approach more closely going forward.
Historically we haven’t written much about how we came to value a DALY at $50,000 (or equivalently to one unit of log-income), which is less than many other actors would suggest. We don’t have a well-documented account of this historical choice, but the recollection of one of us (Alexander) is:
-
We had seen numbers like $50K cited in the (older) health economics literature. It was also close to the British government’s widely-cited cost-effectiveness threshold of £20k-£30k (roughly $50k as of 2007; less now) per QALY (though that is more based on an opportunity cost frame than a valuation frame).
-
A $50K DALY valuation roughly reconciled our relative valuation on the life-saving GiveWell top charities against GiveDirectly (i.e., we had GiveDirectly at 100x in our units and a cost per DALY averted of ~$50 for GiveWell top charities, which at $50K/DALY, implied a 1,000x ROI, or a ~10x difference with GiveDirectly) with GiveWell’s (which thought their life-saving charities were ~10x as cost-effective as GiveDirectly at the time).[7]
-
Given that we were already prioritizing health heavily relative to income in terms of the total set of interventions we were supporting, opting for a lower valuation than some other parts of the literature seemed conservative.
-
Using a number that was significantly larger than GDP per capita (which was ~$50K in the US at the time we adopted this valuation) implied there was more value at stake than total resources in the economy, and that seemed wrong to me at the time. We now think that I was mistaken and there’s no in-principle reason there can’t be substantially more value at stake than the sum of the world economy.
Our previous “bar”
It is useful for us to have a single “bar” across multiple very different programs, years, and outcome measures, because equalizing marginal returns across different programs and across time is a requirement for optimizing the overall allocation of resources, and our mission is to give as effectively as we can. The basic idea of this “bar” is that it tells us what level of cost-effectiveness of grant is “good enough” to justify spending on some specific grant or program vs. saving for future years or allocating more funding to another program instead. If instead we set different bars across programs or years (in present value terms, i.e., after adjusting for investment returns), then that would mean we could have more impact by changing the allocation of resources (to put more into the program with the higher bar and less into the program with the lower bar), and we’d, in principle, want to do that. (However, in practice, we often see a case for practicing worldview diversification.)
Prior to 2019, we often used a “100x” bar, based on the units above and the very roughly 100x ratio of $50K to GiveDirectly recipient income (net of transaction costs). We thought “that such giving was quite cost-effective and likely extremely scalable and persistently available, so we should not generally make grants that we expected to achieve less benefit per dollar than that.”
As of 2019, we switched to tentatively thinking of “roughly 1,000x” as our bar for new programs, because that was roughly our estimate of the unfunded margin of the GiveWell top charities, and we thought we would be able to find enough other opportunities at that cost-effectiveness to hit our overall spending targets. We wrote: “Overall, given that GiveWell’s numbers imply something more like “1,000x” than “100x” for their current unfunded opportunities, that those numbers seem plausible (though by no means ironclad), and that they may find yet-more-cost-effective opportunities in the future, it looks like the relevant “bar to beat” going forward may be more like 1,000x than 100x.” However, that bar was rough, and we never made it very precise in large part because we don’t expect to be able to make back-of-the-envelope calculations that could reliably distinguish between, say, 800x and 1,000x.
New moral weights
We now think our previous approach to valuing health placed too little value on lifesaving interventions relative to income interventions. Our new approach values a DALY averted twice as highly, equal to a 2-unit (rather than 1-unit) increase in the natural log of any individual’s income. (This is equivalent to increasing 200 people’s incomes by 1% – i.e., in our favored units, equal to $100K in units of marginal dollars to individuals making $50K.) This updated value is more consistent with empirical estimates of beneficiary preferences, the subjective wellbeing literature, and the practice of other actors in the field.
These are all judgment calls subject to uncertainty, and we could readily imagine revising our weights again in the future based on further argument.
Beneficiary preferences
There is a large body of research on how people tend to trade off mortality risks against income gains, in particular the Value of a Statistical Life (VSL) literature. Some analyses in this literature use the stated preferences of individuals – i.e. responses to survey questions like, “would you rather reduce your risk of dying this year by 1%, or increase your income this year by $500?” Others use the revealed preferences of individuals: are the study subjects, on average, willing to take a job with a 1% higher rate of annual mortality, in exchange for $500 higher annual income?[8]
The research findings are clearest in high-income countries, where they tend to find that respondents value a year of life expectancy 2.5 to 4 times more than annual income.[9] (Since these valuations are mostly based on marginal tradeoffs, and since we model utility as a logarithmic function of income, we can interpret these findings to say that “respondents value a year of life expectancy as much as the utility gained from increasing income by 2.5 to 4 natural-log units.”)
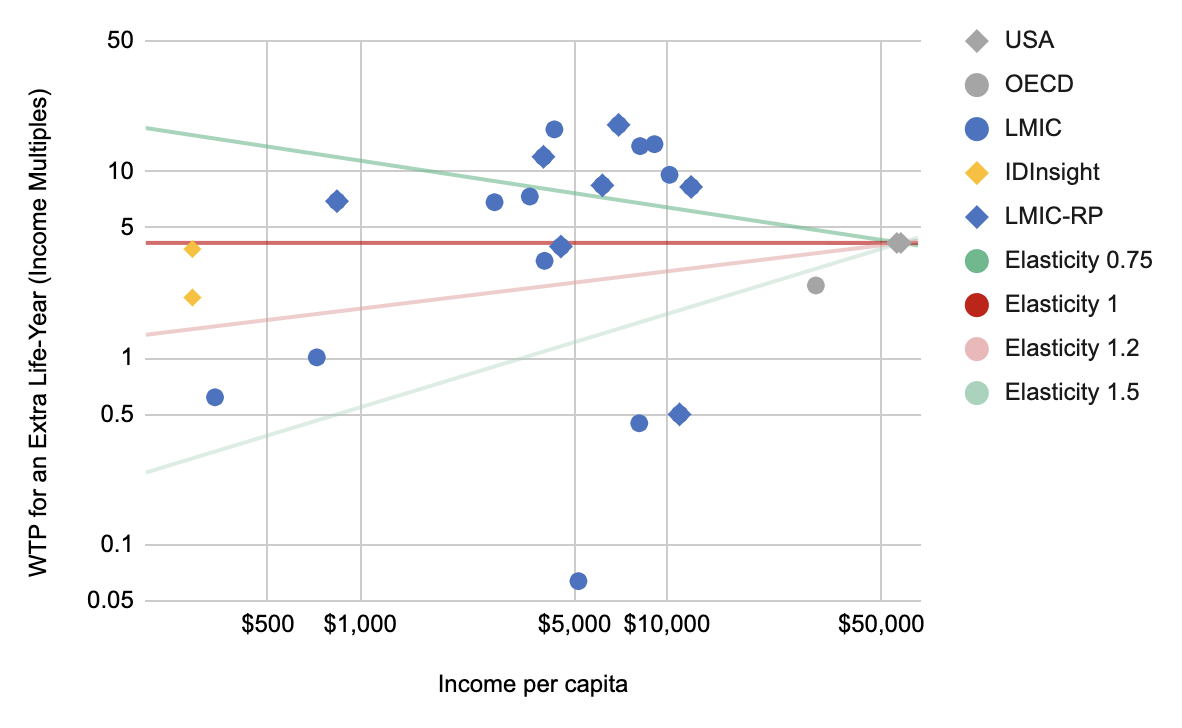
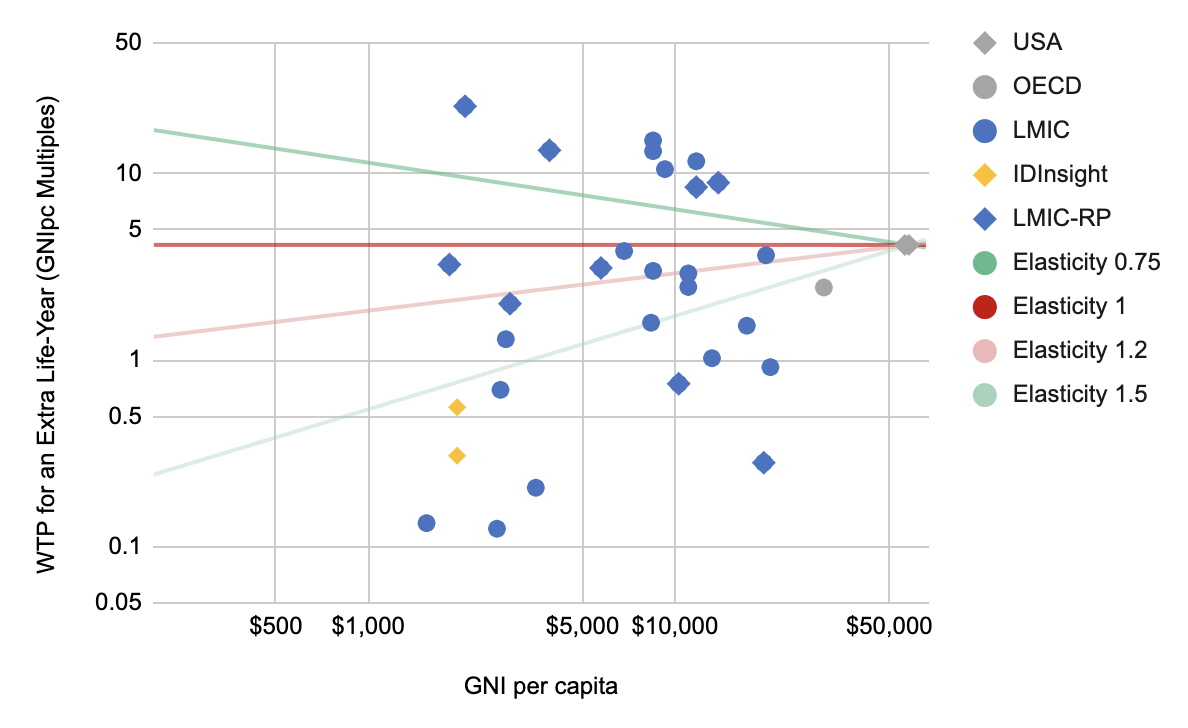
In low-income countries, the evidence is sparser and the findings vary widely.[10] For example, in this chart we plot all the estimates found by the literature search in Robinson et al. 2019’s meta-analysis – they searched for all VSL analyses, whether stated or revealed, in any country that had been classified as low- or middle-income in the last 20 years.[11] (We divide the VSLs by adult[12] life expectancy to get the VSLY – value of a statistical life-year. We express this in terms of local income, which tells us how many units of log-income are worth as much to the respondents as an extra year of life expectancy. We plot stated-preference studies as circles, and revealed-preference studies as diamonds.)
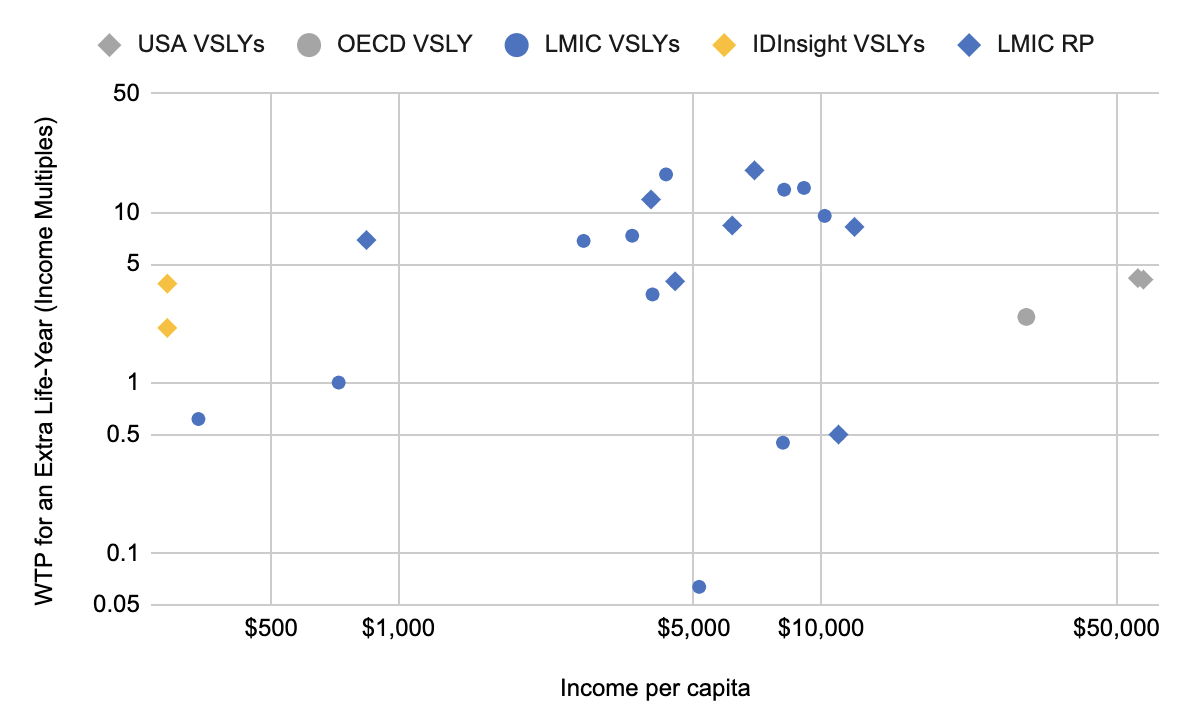
As you can see, the results vary extremely widely. One paper (Mahmud 2009) finds that subjects in rural Bangladesh traded off mortality risk against income in a way that suggests they valued a year of life expectancy at, very roughly, just 62% of annual income. Another paper (Qin et al. 2013) finds that subjects in China (who reported only $840 in annual per-capita income) valued a year of life expectancy at roughly 7x annual income.
In the face of this huge variation, some sources[13] recommend estimating LMIC preferences via an “elasticity” approach: statistically estimate a function mapping VSL to income, anchoring it off the better-validated VSL figures in high-income countries. This elasticity approach is reviewed in Appendix A. Mainstream versions of it predict that individuals at the global poverty line would trade off 1 year of life expectancy for anywhere between 0.5x-4x of a year’s income[14] (which we can interpret as 0.5 to 4 units of log-income).
Our beneficiaries (especially for lifesaving interventions) are mostly in low and lower middle income countries, and for now we’re focusing on this context in setting our moral weights. (As we’ll discuss in Appendix A, there are empirical and theoretical reasons to think that the exchange rate at which people trade off mortality risks against income gains differs systematically across income levels, with richer people valuing mortality more relative to income.)
Rather than estimate beneficiary preferences based on the academic literature, why not ask beneficiaries directly? In 2019, GiveWell commissioned a survey among individuals who are demographically similar to their beneficiaries: families in rural Kenya and Ghana, with annual consumption of roughly $300 per capita.[15] IDInsight conducted this survey, and their analysis suggested that these respondents would value an extra year of life expectancy as much as 2.1-3.8 years of income, which we can interpret as 2.1-3.8 units of log-income. (See GiveWell’s post for a discussion of the limitations of this study).[16]
Subjective wellbeing
Research on subjective wellbeing suggests that we can improve life satisfaction by increasing incomes, but it also seems to indicate that such gains are small compared to the baseline wellbeing experienced by individuals even at low levels of income. We interpret this as suggestive evidence that a year of life expectancy is worth substantially more than 1 unit of log-income.
For example, this chart from Stevenson and Wolfers 2013[17] attempts to harmonize different surveys into one measure of “life satisfaction”. It suggests that you’d have to increase income by a factor of at least 64 in order to double reported life satisfaction on the harmonized scale (starting from the baseline level of life satisfaction experienced by the average individual at the global poverty line).[18] Note, of course, that the units of this scale are somewhat arbitrary, so you have to add some strong assumptions to think that a doubling on this scale indicates a doubling in actual subjective wellbeing.[19]
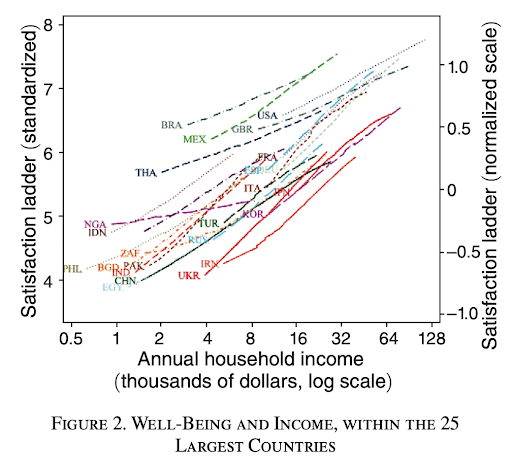
We could use these “life satisfaction” units to estimate an exchange rate between increases in life expectancy and increases in income. The chart suggests that, for someone near the global poverty line, you’d have to increase income by roughly 64x in order to get twice as much life satisfaction at any moment. You could conclude that a 64x increase in income (for one year) is worth as much life satisfaction as an extra year of life. In that case, a logarithmic utility function suggests valuing a DALY at roughly 4 units of log-income.[20]
We don’t want to over-interpret this – especially since the measure of “life satisfaction” uses a somewhat arbitrary scale and you could get different results depending on your assumptions about how reported satisfaction translates to actual subjective wellbeing.[21] But it does seem like suggestive evidence that the old weights placed too much weight on income, and too little value on saving lives.
Other actors’ values
Doubling the weight we place on health also brings us into better alignment with other actors in the field. For example, GiveWell’s implied valuation of a YLL from preventing an adult death from malaria is 1.6 units of marginal log-income.[22] The Lancet Commission on Investing in Health recommended valuing DALYs in LMICs at 2.3 times per-capita GDP.[23] Until recently, the World Health Organization recommended that health interventions be considered “cost-effective” if the cost of averting a DALY was less than 3x per-capita GDP.[24] Other actors in high-income countries use widely-ranging methodologies; some would give numbers as high as 4x per-capita income[25] or as low as 0.7x per-capita income.[26]
In particular, we don’t want our moral weights to stray too far from GiveWell’s. This is substantially for pragmatic reasons: most of our lifesaving interventions run through them, and a statement of our valuations that was out of line with our spending on the GiveWell recommendations doesn’t seem like it would be accurate. But it is also partially due to some epistemic deference: GiveWell’s moral weights are the result of thoughtful deliberative processes, and we share some meta-ethical and epistemic approaches with them. While we are generally aware of each other’s reasoning, if we invested more time in understanding each other’s thinking, we expect we would likely come closer to agreeing on moral weights. Thus, some preemptive deference to their moral weights makes sense to us.
Aggregating these considerations
The literature on subjective wellbeing, and our attempts to estimate beneficiary preferences, both suggest to us that we should rate lifesaving impacts significantly more highly than under our old weights. On the other hand, pushing in favor of a less aggressive increase:
We don’t want to be too far off from GiveWell’s current valuation of 1.6 units of log-income.
The theoretical arguments in Appendix A suggest that high DALY valuations in low-income settings would be inconsistent with developed-world VSL evidence.
We don’t want to change our moral weights too much in any one year, to avoid “whipsawing” if we later determine that this change was mistaken.
Given that we already prioritize health interventions more highly than other philanthropists, erring towards a lower valuation seems “conservative.”
There is huge uncertainty/disagreement across and between lines of evidence – including between us and on the broader GHW cause prioritization research team – and any given choice of ultimate valuations seems fairly arbitrary, so we also prefer a visibly rough/round number that reflects the arbitrariness/uncertainty.
Taking all of these considerations together, we’re doubling our DALY valuation to $100,000, i.e. 2 units of log-income. We expect to continue to revisit this in future years and could readily envision major further updates.
Measurement of DALYs
We’re also switching our approach to be more consistent with GiveWell’s framework in how we translate deaths into DALYs. GiveWell assigns moral weights to deaths at various ages, rather than to DALYs. But we can use their moral weights to derive a mapping of deaths to DALYs, by dividing GiveWell’s moral weight for each death by GiveWell’s moral weight for a year lived with disability (which is defined by WHO so as to be equivalent to a DALY).[27]
The resulting model cares about child mortality more than adult mortality, but not by as much as remaining-population-life-expectancy would suggest. For example, GiveWell places 60% more weight on a child malaria death than on an adult death, and we can fairly straightforwardly interpret their process as counting an average of 32 DALYs per adult malaria death,[28] so the GiveWell-based DALY model would implicitly count 32*160% = 51 DALYs for an under-5 malaria death. In contrast, a direct remaining-population-life-expectancy approach in Kenya would count 68 DALYs for an under-5 malaria death[29], and the Global Burden of Disease approach (explained above) would count more than 84 DALYs.
GiveWell has written about the process for reaching their current moral weights here.
We see a normative case for the Global Burden of Disease’s uniform global approach to DALY attribution, but given our commitment to maximizing (expected) counterfactual impact, we think the national life table approach represents a plausible upper bound on attributable DALYs, and even those seem aggressive as an estimate of counterfactual lifespan for children whose lives are saved on the margin (who are presumably less advantaged and less healthy than the national average). Overall, we’re not sure where precisely this consideration should leave us, but it seems to argue for lower numbers.
We also haven’t reached any settled thoughts on the impact of population ethics or the second-order consequences of saving a life (e.g., on economic or population growth) on how to translate between deaths and DALYs.
For now, in order to be more consistent in our practices, we’re going to defer to GiveWell and start to use the number of DALYs that would be implied by extrapolating their moral weights. (In practice, we already defer to GiveWell for their own recommendations, so this would mainly change how we use GBD figures in our BOTECs for other grants, especially in science. In the section immediately below comparing our new values to old values, we assume for simplicity that we were using the national life table approach, which splits the difference between the GiveWell approach and the GBD in describing our status quo practices.) This means fewer DALYs averted per child death averted, which offsets some of the apparent gains from doubling our value on health. We expect to revisit this and try to form a more confident independent view about the balance of all these considerations in the future.
Expanding our spending, and modestly lowering our cost-effectiveness bar
We think there are four major buckets of updates that affect our “bar” going forward:
The change to our weight on health, described just above.
Other secular changes to GiveWell’s expected cost-effectiveness.
Cross-cutting changes to our estimate of future available assets.
Updates to our estimate of the likely “last dollar” cost-effectiveness of our non-GiveWell spending.
We walk through more detail below, but overall these factors leave us with a bar of very roughly 1,000x going forward for now.
Increased value on health
Overall, our new moral weights put more emphasis on health than we did before, which in some sense increases the amount of value at stake according to our moral framework, and should raise our cost-effectiveness bar, at least expressed in terms of marginal dollars to someone making $50K.
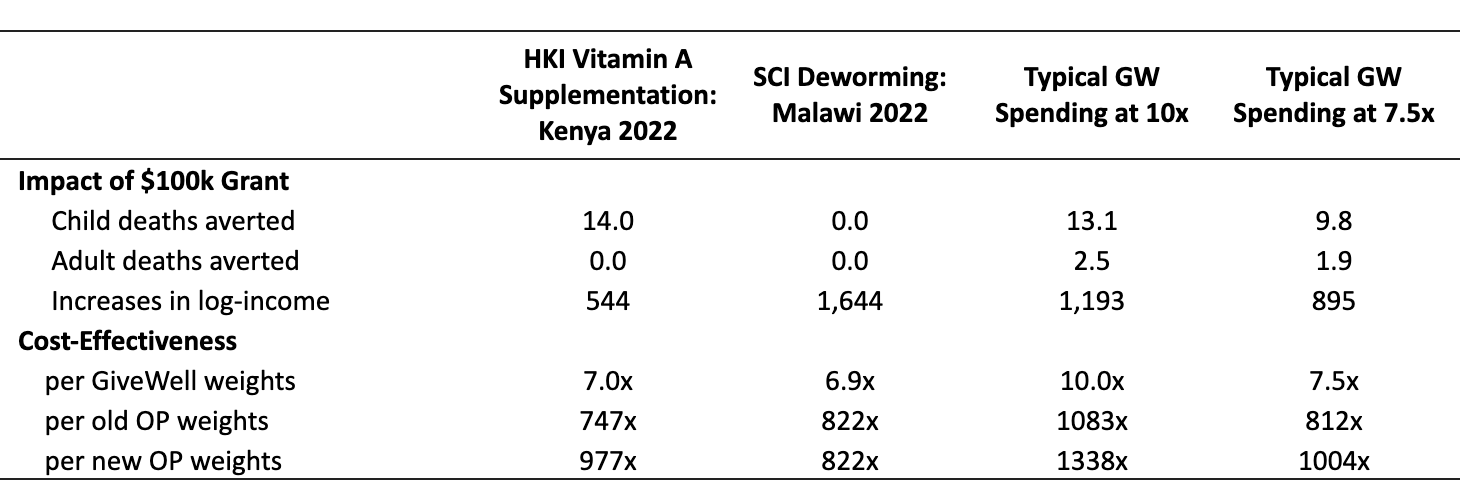
This table shows how we would rate the impact of various interventions, according to our new moral weights. (You can see the calculations in Google Sheets here.) Here’s how to read the first column:
GiveWell estimates that HKI’s vitamin A supplementation program in Kenya averts 14 child deaths per $100k granted, and also increases incomes by 500 units of log-income.[30]
Per GiveWell’s moral weights, this is 7 times more cost-effective than cash transfers to the global poor.
Open Philanthropy’s old moral weights would have rated this intervention as 747 times more cost-effective than giving a dollar to someone with $50K of income.
Under our new moral weights, we would rate this intervention as 977 times more cost-effective than giving a dollar to someone making $50K.
Note that the update in cost-effectiveness depends on the mix of beneficial outcomes an intervention generates. A charity that just increases income (as in the second column of this table) will have the same cost-effectiveness under our new or old moral framework. An intervention that simply averted DALYs (say, averting 1 DALY for every $100 spent) would be twice as cost-effective under our new moral weights. Because of the change in how we measure DALYs, an intervention that averts child deaths at a fixed rate (say, averting 1 child death for every $5000 spent) would only be roughly 1.5x more cost-effective under our new moral weights than under the old framework.[31] The program in column 1 gets some of its moral impact from income interventions and some from averting child deaths, so its cost-effectiveness changes by a weighted average of 1x and 1.5x.
The third and fourth columns show the mix of outcomes that could be achieved by a typical dollar to GiveWell top charities – that is, roughly 50% of its impact from income effects and 50% from mortality effects.[32] Our new weights rate the cost-effectiveness of this mix of outcomes ~25% higher than our old weights did.[33] (To foreshadow a bit, this means that if we lower the bar by ~20%, simultaneously with changing our moral weights, then our nominal bar will not change.)
For the past few years GiveWell’s rough margin has been interventions that they rate as 10x more cost-effective than cash transfers to the global poor – the third column shows how a dollar could be spent at this margin. This was our prior bar, and you can see that in our old units it was ~1000x. If the only updates were to our valuation on DALYs (and our framework for translating deaths into DALYs), our bar would go to roughly 1300x (our rough old bar expressed in new units).
However, this change to our valuations is not the only change here; below we address others which, taken together, lower our expected cost-effectiveness of our last dollar (assuming the GiveWell mix of outcomes) by roughly 20%. This means our nominal bar is staying roughly constant.
Changes to GiveWell’s expected cost-effectiveness
Our expectation of future funding for GiveWell top charities, including both our support and that from others, has grown much faster than we would have expected in 2019. We didn’t have a precise model of expected future funding to GiveWell at that point, but very roughly we think it’s reasonable to model expected future funding for GiveWell’s recommendations as having doubled relative to our 2019 expectations. We currently model the GiveWell opportunity set as isoelastic with eta=.375,[34] which implies that a doubling of expected funding should reduce marginal cost-effectiveness (and the bar) by 23% (1 − 2^-.375 ≈ 23%).
On the other hand, GiveWell has found slightly more cost-effective opportunities over the last year than we would have expected them to. This year, they’re expecting roughly $400M of spending capacity at least ~8x as cost-effective as GiveDirectly according to their modeling. This is roughly as much as we would have expected if they had already explored the space of “8x” opportunities as thoroughly as they’ve explored the opportunities that are ~10x as cost-effective as GiveDirectly.[35] Given that they have only recently focused on exploring this space of slightly-less-cost-effective interventions, this is a very promising amount of spending capacity, and suggests the potential for even more capacity in the near future. This should marginally raise our bar.
We’ve also done more sophisticated modeling work on how we expect the cost-effectiveness of direct global health aid and asset returns to interact over time, and how we should optimally spread spending across time to maximize expected impact while hitting Cari and Dustin’s (our main funders) stated goal of spending down within their lifetimes. We’re still hoping to share that analysis and code, but the top level conclusion is that for opportunities like the GiveWell top charities and with a ~50 year spenddown target, it’s optimal to spend something like 9% of assets per year. That would imply a significantly faster pace of spending for the assets we expect to recommend to the GiveWell top charities than we’ve reached in the past, which would in turn imply a lowering of the bar. Two other interesting implications of the model for GiveWell spending are that: (a) we should be trying to get to our optimal spending and then spending down with a decreasing dollar amount each year (which may be a more a flaw/simplification of the model than accurate conclusion); and (b) we should expect our bar to fall by roughly 4% per year in nominal terms (largely reflecting asset returns – this helps equalize our “real”[36] bar over time).
Overall, we currently expect GiveWell’s marginal cost-effectiveness to end up around 7-8x GiveDirectly (in their units), which, assuming their current distribution across health and income benefits, translates to ~900-1,100x in our new units,[37] though our understanding is that GiveWell does not necessarily endorse this extrapolation. Assuming that we continue to support the GiveWell recommendations and have a correctly-implemented uniform bar, that implies a similar bar across all our other work, though it could turn out to be too low if we’re able to find many more cost-effective opportunities in other work.
One complication for extrapolating from the GiveWell bar to our other work is that GiveWell is much more thorough in their cost-effectiveness calculations than we typically are in our back-of-the-envelope calculations, which might mean that the results aren’t really comparable. We linked to some examples of our back-of-the-envelope calculations from our 2019 post, and they compare very unfavorably to the thoroughness of GiveWell’s cost-effectiveness analyses. That said, GiveWell also counts some second-order benefits (e.g., the expected income benefits of health interventions) that we typically don’t, so it isn’t totally obvious which direction this adjustment would end up pointing on net. (It’s also not clear how we would want to make the appropriate adjustment even in principle since there’s some division of labor going on where GiveWell has more conservative/skeptical epistemics, but we intentionally don’t consistently apply those epistemics across our work.) Overall, we think we should probably use a somewhat higher bar for our other BOTECs rather than just applying the same bar from GiveWell, but we’re not currently making a mechanical adjustment for this and don’t have a good sense of how big it should be.
Increases to our estimate of future available assets
Our available funding has increased significantly as a result of stock market moves over the last few years. (This is not independent of the assumption above of GiveWell’s available resources doubling, since that assumes a substantial increase in our giving to their top charities.)
We’ve also become more optimistic about future funders contributing to highly-effective opportunities of the sort we may recommend, which would also lower our current bar on the margin. Some of this is driven by the emergence of other billionaires self-identifying with effective altruism, but it also reflects GiveWell’s increased funding from other donors, increasingly concentrated wealth at the top end of the global distribution, and the cryptocurrency boom. (Yes, that is weird, we know.)
By the same logic as above, increasing expected resources should lower the bar, but we don’t have as good of a model for how cost-effectiveness scales with resources in other Global Health and Wellbeing causes as we do for GiveWell recommendations, especially not for causes that we haven’t identified yet.
If the only thing that changed were GiveWell autonomously lowering its bar and accordingly having less cost-effective marginal recommendations, we should in principle marginally reallocate away from GiveWell and to other opportunities. But GiveWell isn’t independently lowering its bar; our overall plans and assessment of our bar contribute to the update. And given the composition of GiveWell’s top charities, made up of scalable, commodities-driven global health interventions, we expect them to have a lower eta (i.e., decline less in cost-effectiveness with more funding) than opportunities like R&D or advocacy that are more people-intensive (where we have a prior that returns tend to be more like logarithmic, which is more steeply declining than our model of the GiveWell top charities). That should mean that as resources rise, a larger portion of the total should flow to GiveWell. And that is reflected in our most recent plans: we previously wrote that we expected something like 10% of Open Phil assets/spending to go to “straightforward charity” exemplified by the GiveWell top charities, but now anticipate likely giving a modestly higher proportion (which, combined with asset increases, will mean substantially increasing our support for them in dollar terms).
Updates to our estimate of the likely “last dollar” cost-effectiveness of our non-GiveWell spending
Above, we argued that the GiveWell bar should go down in terms of our old weights and stay roughly nominally flat (at ~1,000x) in our new units. While the first-order implication is that the bar should uniformly decline across all of our Global Health and Wellbeing work, there are some complicating considerations.
Our new higher valuation on health and the GiveWell bar going down makes non-GiveWell global health R&D and advocacy opportunities look more promising than before, and we really don’t know how many of these opportunities we could find. If, hypothetically, we could find billions of dollars a year in global health R&D opportunities with marginal cost-effectiveness above the new GiveWell bar, then that should be the bar instead (and, by implication, we shouldn’t fund the GiveWell recommendations going forward). That said, it seems unlikely a priori that marginal cost-effectiveness for billions of dollars of global health R&D or advocacy spending would end up right in between the old and new GiveWell bars (which fall by one third for child health interventions and 50% for adult health interventions[38]), so the most likely implications of this are that either (less likely) our bar has always been too low and we should have always been doing this hypothetical global health R&D or advocacy instead of supporting GiveWell top charities, or (more likely) we will find many good opportunities better than the marginal GiveWell dollar but not enough that they independently drive our marginal dollar. Our new valuation on health (relative to income) is also a little higher than GiveWell’s, which in principle means that there could be things above our bar but below theirs, though in practice the valuations are close enough that we don’t think this is likely to be a big deal.
More concretely, we’ve been continuing to explore new areas that we think might be more leveraged than the GiveWell top charities, including recently making hires (announcements coming soon!) to lead new programs in global aid advocacy and South Asian air quality. The basic thesis on these new causes is to try to “multiply sources of leverage for philanthropic impact (e.g., advocacy, scientific research, helping the global poor) to get more humanitarian impact per dollar (for instance via advocacy around scientific research funding or policies, or scientific research around global health interventions, or policy around global health and development).” With our first hires in these new causes starting next year, it’s too soon for us to have a major update on the marginal cost-effectiveness of spending far out the curve from where we are now, but a few modest updates:
The a priori case for the existence of large scale leveraged interventions more cost-effective than the GiveWell margin continues to seem compelling to us. The Bill and Melinda Gates Foundation spends well over half a billion dollars a year on global health research and development[39] and we find it plausible (though far from obvious, and haven’t been able to get great data on the view) that the marginal dollar there is better than the GiveWell margin.
But we haven’t found anything obviously more cost-effective than the GiveWell margin and scalable to billions of dollars a year. We’re far from being done looking, and have only covered a small part of the conceptual space, but we’re also not prepared to bet that we will succeed at that scale in the future.
For a more pessimistic prior, consider that at GiveWell’s bar of 8x GiveDirectly, the cost per outcome-as-good-as-averting-an-under-5 death is about $4000-$4500, and the cost per actual under-5 life saved (ignoring other benefits) for a charity focused on saving kids’ lives, is about $6000-$7000.[40] There are about 5 million under-5 deaths per year, which implies that they would all be eliminated for $20-35B/year if GiveWell’s cost-effectiveness level could be maintained to an arbitrary scale. Total development assistance for health is more than that. If there were more than $3B/year of room-for-more-funding an order of magnitude more cost-effective than GiveWell’s margin, it would need to be as effective as eliminating all child mortality. This argument isn’t decisive by any means but can help give a sense of how hard it would be to beat the GiveWell margin by a lot at massive scale: there just aren’t that many orders of magnitude to work with.
We still don’t think all of our existing grantmaking necessarily hits this bar, and are continuing to try to move flexible portfolios towards higher expected-return areas while learning more about our returns and considering reducing our spending in others.
Our current best guess is that we won’t be able to spend as much as we need to within the Global Health and Wellbeing frame at a significantly higher marginal cost-effectiveness rate (though average might be higher) than the GiveWell top charities, so the marginal cost-effectiveness of the GiveWell recommendations continues to be a relevant metric for our overall bar. However, we still expect most of our medium-term growth in GHW to be in new causes that can take advantage of the leveraged returns to research and advocacy, and could imagine that we’ll eventually find enough room for more funding in those interventions that we will need to raise the bar again.
We haven’t done a thorough analysis of the costs of over- vs under-shooting “the bar” for all of our causes, but one important takeaway from our analysis of that for the GiveWell setting, which may or may not properly extrapolate, is that saving and collecting investment returns isn’t “free” (or positive) from an impact perspective. That is because, very roughly, the world is getting better (and accordingly opportunities to improve the world are getting worse) over time, and saved funding doesn’t have that long to compound and has to be spent later at a higher rate given the “spend down within our primary donors’ lifetimes” constraint (which in turn likely means it will be spent at a lower cost-effectiveness further out the annual spending curve). We also think we will be in a much better place to raise more funding from other donors if we’re spending down our existing resources, and the expected benefits of that, along with the ex ante possibility of raising a lot more money, makes it theoretically ambiguous whether the costs of under- or over-estimating the “true” bar are higher. Accordingly we’re just going with our very rough and round current best guess for the bar for now, rather than doing a full expected-value calculation, and we will revisit in the future as we learn more.
Bottom line
We are now treating our bar as “roughly 1,000x” (with our new weights on health) for the GiveWell top charities and in our new cause selection and grantmaking, though we retain considerable uncertainty and expect to continue to revisit that over the coming years. For the typical mix of GiveWell interventions, this bar is about 20% lower given our new moral weights.[41]
We think it’s important to note that the bar is very rough – we aren’t very confident that it, or the BOTECs we consider against it, are even within a factor of 2 of correct – and we will continue to put considerable weight on factors not included in our rough back-of-the-envelope calculations in making major decisions.
Due to this analysis and the lower forward-looking bar, we’re planning to give more to the GiveWell top charities this year and going forward – more on that next week.
Appendix A
The available direct service interventions in health, like the ones GiveWell recommends, are far more cost-effective in low-income countries than high-income countries, so the discussion above focuses on what value we should place on lifesaving interventions in low-income countries. If we were focused instead on saving lives in the developed world, likely via advocacy of some sort, we might trade off differently between lifesaving vs income-enhancing interventions – we are uncertain over a range of rich-world DALY valuations between 2-6 units of log-income.
There are theoretical and empirical reasons to think that the exchange rate at which people trade off mortality risks against income gains differs systematically across income levels, with richer people valuing mortality more relative to income.
VSL elasticity to income
The main empirical evidence is from the VSL literature described above. As discussed, economists often attempt to statistically estimate a function mapping VSL to income, anchoring it off the better-validated VSL figures in high-income countries.
This literature generally finds that individuals’ willingness to pay for life expectancy increases with income, which is unsurprising – a dollar matters a lot more to a rich person, so if everyone valued a DALY equally then VSLYs would increase linearly with income. Most reviews also find that this willingness to pay increases at a faster pace than income. For example, Robinson et al. 2019 review the mainstream literature, which finds that the elasticity of VSL to income is between 1.0-1.2 across LICs (and a bit below 1 across the developed world), though Robinson’s own analysis suggests an elasticity of 1.5 for extrapolating to LMICs.[42] An elasticity of 1.2 would mean that if two individuals’ income differs by 10%, then on average the dollar value they place on a year of life expectancy will differ by 12%.
Lisa Robinson chaired a commission, sponsored by the Gates Foundation, that recommended the following ensemble approach:
VSL is anchored to US at 160x income, with an income elasticity of 1.5, and a lower bound of 20x income.
VSL is anchored to US at 160x income, with an income elasticity of 1.0
VSL is anchored to OECD at 100x income, with an income elasticity of 1.0
These yield the following VSLY estimates for someone at an income 1/100th that of the US[43]:
0.5x income, via lower bound[44]
4x income[45]
2.5x income[46] Here again is the chart from our discussion of LIC VSLYs above. As noted above, in this chart we plot all the estimates found by the literature search in Robinson et al. 2019’s meta-analysis – they searched for all VSL analyses, whether stated or revealed, in any country that had been classified as low- or middle-income in the last 20 years.[47]
I’ve added a few lines to show various elasticities you could use to predict LMIC VSLYs based on US VSLYs. An elasticity of 1 would say that willingness to pay for a year of life expectancy varies 1:1 with income – combining that with the US VSLY of 4 years of income, we’d predict that individuals in any country are willing, on average, to trade 4 units of log-income for 1 year of life expectancy. If instead we combined an elasticity of 1.1 with the US VSLY, we’d predict that individuals at the global poverty line would be willing to trade roughly 2.5 years of income for a year of life expectancy – this is roughly in line with the VSLYs from IDInsight’s surveys of communities demographically similar to GiveWell beneficiaries.
It seems to me that any elasticity between, say, 0.9 and 1.3 is potentially compatible with this data.
Analysts are often interested in the relationship between VSL and national-level income statistics like per-capita GDP, even though we often have measures of the respondents’ incomes, because it is often more practical to apply heuristics to national-level income statistics, especially when deriving VSL estimates to inform national policies. When we analyze VSLY measured in multiples of GNI per capita, rather than respondents’ income, we see a stronger relationship between income and VSLY – this data could be compatible with elasticities between, say, 1.0 and 1.5. This seems to be because the respondents in LMIC VSL studies report lower average incomes than their respective national average – presumably because the social scientists performing these studies are interested in somewhat poorer populations.[48] We suspect that comparing LMIC VSL estimates to national-level income averages, rather than to respondents’ (lower) incomes, biases analyses like Robinson et al. toward finding higher elasticities of VSL to income.
Theoretical arguments for DALY valuations to vary by income
One theoretical argument would go like this: If you think we can improve individuals’ lives by improving their incomes, and you also think the moral impact of saving a life varies somewhat with the quality of that life (i.e. it’s better to extend a happy life than a miserable life), then it follows that it is more valuable in theory to extend the life of a typical high-income country resident than that of a typical person at the global poverty line.[49] Many people (including us) find this a deeply concerning line of reasoning – and critically, this theoretical dynamic is in reality swamped by the fact that it is dramatically less expensive to extend the life of someone at the global poverty line, which is why the overwhelming majority of our GHW portfolio is focused on extending lives and increasing incomes in low and lower middle income countries.
Bringing these considerations together
We’ve been unsettled about how to aggregate these lines of argument, but ended up concluding that we didn’t need to reach a resolution on this because the expected cost of mistakes if we were wrong (i.e., if we assumed 2x and the true answer were 6x, or vice versa) were low.[50]
For now, we haven’t decided specifically how to weigh lives-vs-income tradeoffs in high-income countries, and when we face decisions that might depend on the specifics, will test a range of values between 2 and 6 units of log-income.
- ↩︎
If our marginal returns were not equal across different programs, then we could increase our overall impact by reallocating resources from low-marginal-return to high-marginal-return programs. We assume programs face diminishing marginal returns as their funding increases, so this sort of reallocation would reduce the difference in marginal returns across programs. If we did this enough, the marginal returns would eventually be equal.
- ↩︎
Given our new moral weights, an intervention could meet 1000x by averting 1 DALY for every $100 in spending – that’s 50% less cost-effective than previous moral weights required. But given our new mapping of DALYs to deaths, this means averting 1 child death (or equivalently bad outcome) for every $5100 in spending – which is just a 33% lower bar than our previous moral weights. (Footnote 37 walks through the math for this, and the Measurement of DALYs section explains the reasons.) Meanwhile, an income intervention would meet the 1000x bar by delivering an increase of 1 unit of log-income per $50 spent, under either the new or old weights – so the bar doesn’t move in those terms.
We can aggregate these according to the impact shares of a typical dollar to GiveWell top charities. According to our old weights, a typical dollar to GiveWell top charities gets 55% of its impact from income effects, 41% from child mortality effects, and 4% from adult mortality effects. (See calculation here.)
55%*1+41%*1.5+4%*2 = 1.25; i.e. the impact of a typical dollar to GiveWell top charities has 1.25x more moral weight according to our new weights than our old weights. This means that it is 20% easier to meet the 1000x bar under the new weights than the old ones.
We want our bar to continue to reflect the cost effectiveness of the unfunded margin of GiveWell’s top charities. GiveWell’s top charities include a mix of income and health benefits. That means that mechanically the change in weights influences the bar; the change is proportional to health benefits as a share of total benefits generated by GiveWell’s top charities. This mechanical change due to shifting weights is offset by the other factors discussed in this final section.
- ↩︎
Specifically, we say that if we can generate a 1-unit increase in the natural log of income for $50k in grantmaking, the grant has a cost-effectiveness of “1x”. If we can generate that same outcome for $25k in grantmaking, the grant has a cost-effectiveness of “2x”, etc.
- ↩︎
See GiveWell’s analysis here.
- ↩︎
As of 2019, the GBD’s Reference Life Table gives a normative life expectancy at birth of 88.8 years.
The methodology is described in, for example, this 2016 Lancet article, which says: “We computed YLLs using the standard GBD methods whereby each death is multiplied by the normative standard life expectancy at each age. The normative standard life expectancy at birth… is based on the lowest observed death rates for each 5-year age group in populations larger than 5 million.”
- ↩︎
In fact, the GBD reports 345k under-5 malaria deaths in Sub-Saharan Africa in 2019, and 30.536M DALYs, and 29.965M YLLs for that age group. So the average YLLs counted per under-5 death are 86.8 and the average total DALYs per death (including YLDs to kids who live) are 88.5.
- ↩︎
This is my recollection but this is no longer correct given GiveWell’s current moral weights and cost-effectiveness estimates; I haven’t investigated the cause of the apparent change and there’s a possibility I’m mis-remembering or miscalculated at the time.
- ↩︎
For more discussion of the assumptions in this literature, we recommend the “Valuing income versus health” section of this GiveWell post.
- ↩︎
The best US VSL studies we know of value the life of a working-age adult at 160 years of income. For example, this is the conclusion of Viscusi and Masterman 2017, to my (Peter’s) eye a well-executed meta-analysis of wage-risk studies in the US. (Wage-risk studies examine how much extra compensation employees demand in exchange for taking jobs with higher mortality risks.) It is also the conclusion of mainstream approaches such as the USDOT (which uses the same category of studies as Viscusi and Masterman, but is less careful about correcting for biases like publication bias) and the EPA and HHS (which use a broad set of surveys and revealed-preference studies.). Robinson et al. 2019 table 1 compares each of these sources’ estimates of the VSL to concurrent US per-capita income, and in each case they find the VSL is roughly 160 times income.
An average working-age adult has roughly 40 years of remaining life expectancy (OWID), so that comes out to a VSLY (value of a statistical life-year) of 160/40=4 years of income in the US studies.
Studies that look across the OECD tend to find a VSL is worth roughly 100 years of income, per Robinson et al. 2019. This would value a VSLY at 100/40=2.5 years of income.
- ↩︎
The Robinson et al. 2019 meta-analysis, discussed below, searched for all VSL studies that took place in any country that has been low- or middle-income in the past 20 years. All of their identified studies took place in countries that are currently middle- or high-income. GiveWell also says that they are “unaware of existing studies that asked people in sub-Saharan Africa how they would trade off money versus mortality risks”.
There are some revealed-preference studies in low-income contexts, but as GiveWell says: “…our impression is that estimates of the value of life from these papers have not yet been used by major decisionmakers and are based on different methodologies than typical VSL estimates, so they should not yet be interpreted as “standard” assumptions.” (See also GiveWell’s further discussion in footnote 15 on that page.)
- ↩︎
These are the articles found by the literature search in Robinson et al. 2019’s meta-analysis (including any analyses that the meta-analysis authors discarded simply for finding “unreasonably” high or low VSLs.)
- ↩︎
VSL studies generally focus on how respondents trade off income vs mortality risks to adults.
- ↩︎
For example, Robinson et al. 2019 says: “[T]here are few or no direct estimates of VSL for most [LMICs]. Instead, analysts typically extrapolate values from wealthier countries, adjusting only for income differences. This extrapolation requires selecting a base value and an income elasticity that summarizes the rate at which VSL changes with income.” (Page 1)
Other sources that endorse this approach include Viscusi & Masterman 2017 (page 1: “This article proposes that the best way to calculate a population average VSL for countries with insufficient or unreliable data is to transfer a base VSL from the United States calculated using labor market estimates from Census of Fatal Occupational Injuries data, coupled with adjustments for differences in income between the United States and the country of interest.”) and this 2016 IHME / World Bank report on the costs of air pollution (page 48: “Because WTP studies are still lacking in many of the world’s countries, the only practical way to implement a welfare-based approach in a global cost assessment is to come up with a strategy for adjusting some “base VSL” from the original context in which it was studied (such as the United States) to the context of other countries.”)
- ↩︎
See the section “VSL Elasticity to Income” in Appendix A.
- ↩︎
See footnote 4 in this GiveWell post.
- ↩︎
Among other questions, IDInsight asked respondents how they would trade off lifesaving vs income-enhancing interventions, in a parallel framework to other VSL studies. Responses varied widely, and in some cases were hard to reconcile with simple models of expected value, but IDInsight processed them to suggest that respondents valued saving the life of a family member at 144 times per-capita GDP for a child or 119 times per-capita GDP for an adult.
Dividing 144 by the average remaining life expectancy of a child in GW beneficiary countries gives a VSLY of 2.1 marginal income doublings; dividing 119 by the remaining life expectancy of an adult gives a VSLY of 3.8. See calculations on the IDInsight tab here.
- ↩︎
- ↩︎
For example, a trendline through all these points might start at 3.25 (on the harmonized “satisfaction ladder” scale) for incomes of $500/year, and double to 6.5 for incomes of $32,000/year.
- ↩︎
Economists often prefer to treat subjective wellbeing numbers as ordinally comparable but not cardinally comparable. I.e. They assume that someone who reports a life satisfaction of 4 is happier than someone who reports a 3, but they don’t assume that the difference in happiness from 3 to 4 is the same as the difference from 4 to 5.
Section 1 of this 2020 working paper by Michael Plant has a nice literature review. It discusses non-cardinality objections from economists, and claims that psychologists generally do assume cardinality of this data. The remainder of that Michael Plant paper mounts a moderately strong argument in favor of assuming cardinality.
Also note that some economists like Stevenson and Wolfers use this data in ways that assume some cardinality, e.g. by testing for satiation.
- ↩︎
ln(64) ≈ 4, so 4 units of log-income = a 64x increase in income, which is worth 1 year of life expectancy.
- ↩︎
For example, if “actual” subjective wellbeing scales linearly with distance above 2 on the reported life satisfaction scale, then going from a 3.25 to a 6.5 means more than tripling subjective wellbeing, not doubling. This would lower the implied DALY valuation a bit, but not nearly enough to be consistent with our old weights.
- ↩︎
In GiveWell’s 2020 moral weights, they value a 1-unit increase in log-income at 1.44 units of moral weight, and a YLD (which is defined by WHO so as to be equivalent to a DALY) at 2.3 units of moral weight. 2.3/1.44=1.6 units of log-income per YLD. Similarly, GiveWell estimates that an adult malaria death entails 32 years of life lost, and they value this outcome at 73 units of moral weight. 73/32/1.44 = 1.6 units of log-income per year of life lost.
In the Measurement of DALYs section we discuss whether GiveWell’s model is interpretable in terms of DALYs.
- ↩︎
As interpreted in footnote 9 of this GiveWell post.
- ↩︎
- ↩︎
US government agencies such as the Department of Health and Human Services use VSLs of roughly 160x per-capita income. See Table 1 of Robinson et al. 2019. As discussed in the “Beneficiary Preferences” section above, dividing by the average remaining life expectancy of a working-age adult gives us a VSLY of roughly 4x income.
- ↩︎
As mentioned above, the British NICE currently uses a QALY valuation of £20-£30 ($27k-41k), compared to a UK GDP/capita of roughly $40k. That means valuing a QALY (which is similar to a DALY) as low as 68% of annual income.
- ↩︎
As shown in GiveWell’s 2020 moral weights update, their weight on a YLD is 2.3. (See page 8.)
- ↩︎
If you divide GiveWell’s latest moral weight of an adult malaria death by their moral weight of a YLD (which is defined by WHO so as to be equivalent to a DALY) you get 73⁄2.3=32. This accords with GiveWell’s analysis of the distribution of mortality by age group in Kenya, which says that adult malaria deaths affect individuals who would otherwise have, on average, 32 years of remaining life expectancy per the local life tables.
- ↩︎
Per GiveWell’s analysis of the distribution of mortality by age group in Kenya.
- ↩︎
For simplicity, we use GiveWell’s “unadjusted” numbers to derive the breakdown of impact for each child-health intervention. This means our numbers may be a bit different from GiveWell’s. GiveWell adjusts for various “excluded effects” like morbidity which affect the cost-effectiveness of the intervention. We assume the excluded effects amplify or attenuate mortality and income effects to match GiveWell’s adjusted overall cost-effectiveness, rather than separately accounting for morbidity etc.
- ↩︎
The change in our framework doubles the value of each DALY, but also counts, on average, 25% fewer DALYS per child death. 75%*2=1.5x as much impact per dollar spent.
As noted above, we were previously inconsistent in how we translated deaths into DALYs. For the purposes of this analysis I assume that our old framework measured the DALY burden using national life tables – i.e. the DALY burden of a death is the remaining life expectancy that the life tables would indicate the deceased could have expected given their age and gender.
This yields, for instance, a burden of 68 DALYs per child malaria death in sub-Saharan Africa. Our new approach would yield a burden of 51 DALYs per child malaria death. 51/68=75%.
- ↩︎
We worked with GiveWell to analyze the weighted average of GiveWell’s typical 2021 interventions. According to GiveWell’s moral weights, roughly half the unadjusted impact of a typical dollar to GiveWell comes in the form of lives saved, and half the impact comes via income effects. (Roughly 70% of a typical dollar goes to child-mortality charities, which get 30% of their impact via income effects. The other 30% of the typical dollar goes to deworming charities, which get 100% of their impact via income effects. 70%*30%+30% ≈ 50%.) See footnote 29 for a discussion of how we handle “excluded effects”. This share of impact – 50% income effects, 50% mortality effects – is then scaled to a cost-effectiveness level of 10x GiveDirectly in column 3, and 7.5x GiveDirectly in column 4.
- ↩︎
See footnote 2.
- ↩︎
This is based on fitting isoelastic curves to projections GiveWell has performed to model their opportunity set, though they are quite uncertain about those projections and wouldn’t want to independently defend them.
- ↩︎
In 2020, GiveWell found roughly $210M of funding opportunities at a cost-effectiveness of at least 10x GiveDirectly according to their modeling. Extending that point along an isoelastic curve, with an eta of 0.375, traces out the frontier of spending capacity that you might expect GiveWell to find once they’d explored other levels of cost-effectiveness as thoroughly as they’ve explored the opportunities 10x as cost-effective as GiveDirectly. That frontier would have implied $380M at 8x: (380/210)^-0.375 = 8⁄10.
- ↩︎
i.e. it equalizes our bar in terms of present expected value.
- ↩︎
As noted above, according to GiveWell’s moral weights, roughly half the impact of a typical dollar to GiveWell top charities comes in the form of lives saved, and half the impact comes via income effects.
OP’s new moral weights place 25% more weight than GiveWell’s on lifesaving effects relative to income effects. (GiveWell implicitly values a DALY at 1.6 units of log-income, while we will value a DALY at 2 units of log-income.) So OP would say that a typical dollar to GiveWell top charities is worth 1.25*50%+50% = 1.125 more than GiveWell would, measured in multiples of GiveDirectly’s cost-effectiveness.
Meanwhile, GiveWell’s “GiveDirectly” benchmark is worth 119x in OP terms, as calculated here. The recipients are ~175x poorer than OP’s benchmark individual with $50k of income. The cost-effectiveness ratio drops to 119x after various adjustments like overhead and diminishing marginal returns (since GiveDirectly’s cash transfers are large enough that the marginal effect is less than would be indicated by the pre-transfer income of the recipients.)
7.51.125119=1008x in OP terms. See calculations here.
- ↩︎
With our DALY valuation increasing by a factor of 2, and our nominal bar staying constant, the bar is falling by a factor of 2 in DALY terms. (I.e. an intervention can avert half as many DALYs per dollar and still meet the bar.)
Our new approach to measuring DALYs means we only count 67% as many DALYs per child death, on average. This means the bar is falling by a factor of 2*67% = 1.5 in child-death terms. (I.e. an intervention can avert 2⁄3 as many child deaths per dollar and still meet the bar.)
- ↩︎
Based on G-FINDER’s categorization here.
- ↩︎
See bookmarked cells here. For simplicity, we use GiveWell’s “unadjusted” numbers to derive the breakdown of impact for each child-health intervention. This means our numbers may be a bit different from GiveWell’s.
- ↩︎
See footnote 2.
- ↩︎
Robinson et al. 2019’s literature review suggests an income elasticity of 1-1.2 is mainstream across LMICs: “More recent reviews seem to be coalescing around estimates closer to 1.0 (OECD, 2016; World Bank and IHME, 2016; Viscusi & Masterman, 2017a , b ; Masterman & Viscusi, 2018), generally recommending elasticities around 0.8 for extrapolating across high-income countries and between 1.0 and 1.2 for lower-income countries.”
As I note below, I don’t think the VSL evidence rules out any elasticity between 1.0-1.5. When I’ve done my own re-analysis of Robinson et al’s data, I found that a fairly natural set of assumptions gives an elasticity closer to 1.0.
- ↩︎
Robinson’s formulae yield VSLs rather than VSLYs. We could use her formulae to derive VSLs, and then divide by the adult life expectancy in each country; but in that case the second and third approaches mean that any population with shorter life expectancy mechanically has higher VSLYs in income terms. I think it makes more sense to translate into VSLYs before applying the formulae.
- ↩︎
Assuming 40 years of life expectancy gives us a US VSLY of 4x income. We apply an elasticity of 1.5: 4*(100^-1.5)*100=0.4. Meanwhile, reinterpreting the lower bound in terms of VSLY gives us a lower bound of 0.5x income. (Robinson’s lower bound is 1/8th US VSL; 1/8th US VSLY is 0.5x income.) Max(0.5, 0.4) = 0.5.
- ↩︎
Assuming 40 years of life expectancy gives us a US VSLY of 4x income. We apply an elasticity of 1.0: 4*(100^-1)*100=4
- ↩︎
Assuming 40 years of life expectancy gives us an OECD VSLY of 4x income. We apply an elasticity of 1.0: 2.5*(100^-1)*100=2.5
- ↩︎
This chart’s methodology is discussed further above.
- ↩︎
For example, the first paper listed in Appendix B of Robinson et al’s meta-analysis is Mahmud 2009, which focuses specifically on “rural households” in Bangladesh. Most papers in Robinson et al reported lower respondent per-capita income than national per-capita GNI, 35% lower on average – see bookmarked cell here.
- ↩︎
More specifically, if you think utility is proportional to the natural log of income and the value of saving a life should be proportional to the utility experienced/forgone, the valuation on a life-year with a 100x more income should be 4.6 natural log units higher. So if the value of a life-year in a LIC were fixed at 2 natural log units, that simplistic model would imply the value of a HIC life-year should be 6.6 natural log units, which is much higher than typical VSLY estimates.
- ↩︎
Our analysis tends to find that picking the wrong moral weight only means sacrificing 2-5% of the good we could do, so long as our opportunity curves have meaningfully diminishing marginal returns and typical opportunities for lifesaving in the developed world are at least moderately less cost-effective than other kinds of interventions. This spreadsheet walks through my calculation, please feel free to email me if you have questions about it.
Thank you for sharing, it’s fantastic to see such a level of detail! Minor suggestion: it might be helpful for you to explicitly state that “we” = OpenPhil at the beginning of the post—that’s not necessarily clear to folks who aren’t as familiar with x-posts from the blog.
Thanks for this. Totally apart from all the crucially important work you guys do at openphil, I have a weird personal interest in finding ways to estimate and compare the value of time, health, risk, etc, under different circumstances. (For instance—exactly how beneficial is exercise? How much is my free time worth? How should I weigh an extra year of savings against the costs of an extra year of high-income work? Etc… these questions seem esoteric but they can become surprisingly important for big lifestyle & career decisions.) Lots of people consider these issues, but often they do so in a shallow or incomplete way. Seeing this kind of expert, well-researched utilitarian reasoning helps me think more clearly about these questions in my own life.