Research report: modern alternative proteins did not replace meat purchases in restaurants
Overview
This post summarizes a new preprint on alternative proteins from the Humane and Sustainable Food Lab: New alternatives, same orders. We investigated 19[1] restaurants[2] that introduced plant-based alternative proteins throughout 2016-2023, including Beyond sausage, the Impossible burger, and many others. We find essentially no evidence here that alternative proteins reduce meat purchases or those of other animal products, even for the same individual customers over time[3].
Interactive plots here.
Why this matters
A central theory of change for alt proteins is substitution: match meat on taste, price, and convenience, and consumers should replace a majority of their meat purchases with alternatives. EAs, including funders, are excited about this approach as a way of reducing animal suffering and creating a more environmentally sustainable food system. Coefficient Giving recently announced a $10M R&D fund for making better tasting alt proteins, while the Nova Vista Foundation is investing a further $10 million in policy and market-shaping, which they consider “high EV bets due to their leverage.” There is also a general sense in EA that the animal advocacy movement might be on the verge of a large influx of funding, much of which may go to alt proteins.
Even strong proponents seem to agree, however, that consumer reception to extant alt proteins has been disappointing. For instance, Beyond Meat is a potential bankruptcy candidate. Meanwhile, the alt protein venture capital market has been in steep decline since 2021.
The academic literature tells a more optimistic story. Though our lab found very little displacement of meat from the introduction of a chicken alternative in an online, Chipotle-style survey experiment, a few well-regarded papers from researchers at Cambridge, Oxford and a few other UK universities find that introducing plant-based proteins reduces meat consumption. Garnett et al. (2019) looked at “94,644 meals” in a university setting and found that “doubling vegetarian availability from 25 to 50% increased vegetarian purchases (and decreased meat purchases) by 7.8, 14.9, and 14.5 percentage points;” Becker et al. (2026) analyzed 26,170 meal purchases across six UK worksite cafeterias and found that replacing one meat- or fish-based meal with a plant-based meal for a week led to a decline that week in meat purchases of about 7 percentage points[4].
Our view is that the question of whether current proteins displace meat, or instead provide more options for vegetarians, has clear implications for the next generation of alt protein products. Even if future products are indistinguishable from meat in blind taste tests, what people eat isn’t only about flavor but also about culture, upbringing, tradition, etc. A prior review by Jacob_Peacock suggests that price, taste, and convenience parity will not be enough to displace meat by themselves.
It’s also worth recognizing the progress already made. If the technological headroom is smaller than we assume, the returns to knowing where and when alternative proteins work may exceed the returns to making them better.
Since previous evidence has largely centered around blind taste tests and replacement effects in school and workplace cafeterias, what has been missing is real purchasing behavior in real restaurants. That is the gap this study aims to fill and it is, to our knowledge, the first to assess the effects of introducing alternative proteins into restaurants. Part of this post will be devoted to discussing and contextualizing the strength of that evidence.
Which alt proteins?
The first question that comes to mind when discussing replacement effects is, which alternative proteins are we talking about? Are they ones that actually taste good and at parity with meat in any way, or completely unpalatable?
We specifically designed our study around modern[5] plant-based alternative proteins, that is, second-generation products designed to more closely replicate the flavor and fibrous texture of meat and other animal products (e.g., using high-moisture extrusion, shear cells, and 3D printing). Several restaurants introduced Impossible products, which according to multiple peer-reviewed blind taste tests, are near or at parity with meat for a sizable portion of consumers. What that means is that there were likely at least a few introductions of alternative proteins that were not rated substantially lower than meat products, and they still did not displace meat purchases. Also, importantly, these products weren’t ignored. In 6 of 7 restaurants, purchase volumes indicate a meaningful share of customers sampled them; they just didn’t buy less meat.
The other consideration is of course price. All the alternative proteins did command price premiums relative to their meat counterparts ($1-2.50), and this ‘tax’ could certainly have influenced the observed lack of replacement.
While it is true that the implications from these null results are restricted to a specific slice in time and place – when alternative proteins are still overpriced in the US and truly not at parity with meat – it is also important to understand the market context. Our restaurants introduced alternative proteins to their customers at the height of the alternative protein buzz. The first introductions in our dataset coincide with the initial 2016 popularization of Beyond and Impossible, and the later introductions with the mounting buy-in by industry.
Since ~2021 and the later part of this dataset, market penetration and consumer adoption have in fact declined, which can be seen in diminishing media attention, falling share prices, and the abating of actual household penetration[6] for plant-based meat. So at the least, these introductions can be seen as representative of a society-wide trial of the products when consumer curiosity, media salience, and industry backing were at their high.
What we did
We designed four separate analysis sets, each containing multiple outcome–exposure pairings. For every pairing, we fit a separate multi-restaurant time series model, adjusting for the same covariates across models, and extracting the exposure’s effect estimate. We repeated this for two sets of restaurants[7].
The four analysis sets are defined along two dimensions.
The first is how alt proteins show up on the menu, aka exposure novelty: distinguishing the effect of the overall availability of alternative proteins on a menu from the effect of their new introduction, treated as a quasi-experiment via interrupted time series.
The second is where displacement would show up in purchases, aka outcome specificity: distinguishing general animal-based purchases (nonvegan, meat-containing, chicken-and-fish-containing dishes) from counterpart-specific purchases where alt proteins are matched to the products they emulate (e.g., Beyond Sausage’s effect on sausage purchases).
Crossing them gives:
A1 -- overall availability on general purchases (36 pairings)
A2 -- overall availability on counterpart-specific purchases (10 pairings)
A3 -- new introductions on general purchases (6 pairings)
A4 -- new introductions on counterpart-specific purchases (3 pairings)
All effects are estimated relative to total purchases. This is done by adjusting the effect estimate of an exposure on the other outcomes (e.g., meat purchases) by its effect estimate on total purchases (see an example in the results section). Folding in those estimates and omitting single-restaurant models results in a final reported 40 total-adjusted pairings (30, 4, 5, 1 versus the 36, 10, 6, 3 above).
The covariates used in all pairings comprised prices of menu categories (meat, vegetarian, vegan), time, seasonality (day of the week, holidays, month, season, year), and trends outside the restaurants (weather, inflation). Since net effects could still reflect an evolving customer base rather than individual change, we also ran within-customer sensitivity analyses (with the same covariates). This sort of consideration substantially deflated an earlier cafeteria study’s apparent displacement effect.
Other modeling details overstretch this post. The “short” version is that we designed a custom multilevel Bayesian INGARCH, which is a count time series model akin to the continuous-valued ARMA and GARCH models; among other features, we used hierarchical interventions (since some restaurants had multiple introductions), zero truncation (closure handling), and regularization (covariate shrinkage and selection).
Results
Across A1-A4, we report results from 40 pairings. (In total, we fit ~130 multilevel models over all analyses including within-customer sensitivity analyses and analyses of the lower-data-quality 19-restaurant set.) For brevity, we summarize the results only at the across-restaurant (pooled) level, not the within-restaurant level.
A1
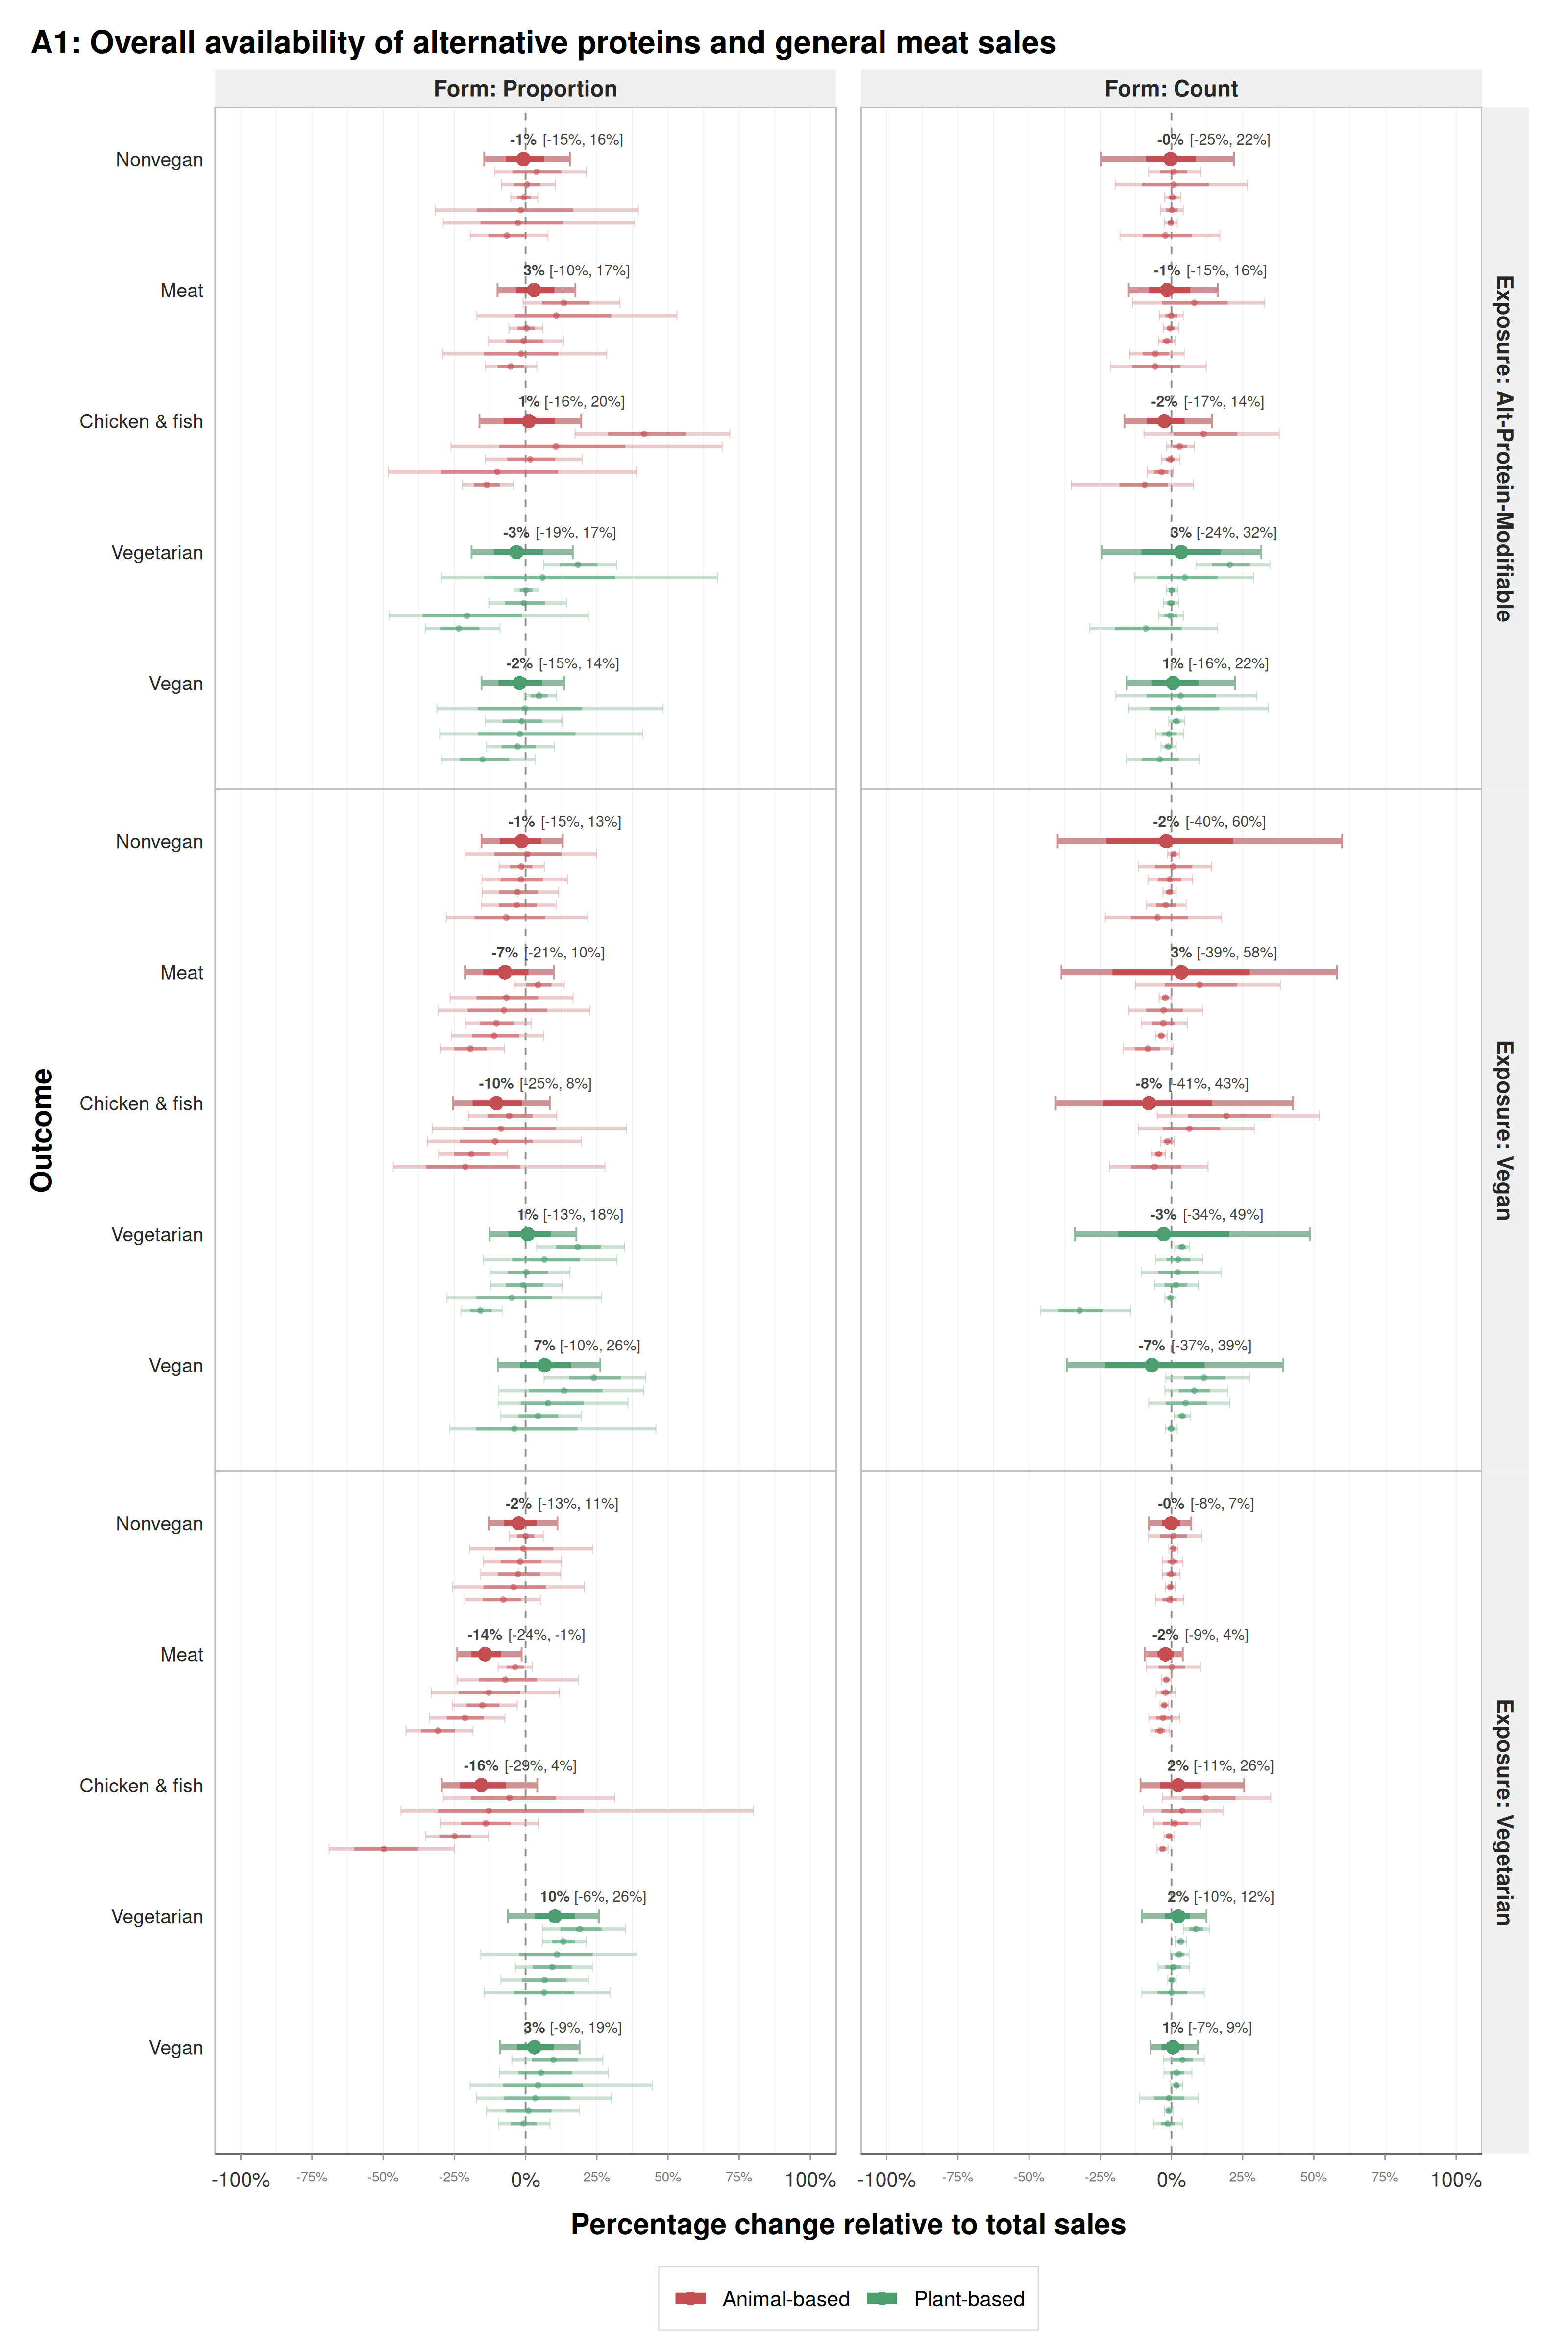
Here, we assessed the effect of the overall availability of a) alternative-protein-modifiable[8], b) vegetarian, and c) vegan dishes on each of 1) nonvegan purchases 2) meat purchases, 3) chicken-and-fish purchases, 4) vegetarian purchases, and 5) vegan purchases. These three exposures were in fact different because many orders containing alternative proteins were not actually vegetarian. For example, a substantial number of ‘Impossible burger’ orders surprisingly contained bacon, likely purchased by curious customers or nonvegetarians aiming to lower their meat consumption.
We measured availability as both a ‘count’ and a ‘proportion’ on the menu. Taken across these 2 parametrizations, the 3 exposures, and the 5 outcomes, we then have 2x3x5 = 30 pairings and therefore 30 pooled estimates. A1 had the only pooled estimates in our study that were significant at the uncorrected level (more on multiplicity correction in a moment): vegetarian dish availability (only as a proportion) on both meat purchases and chicken-and-fish purchases. These estimates were not significant after correction, though the effect on the chicken-and-fish outcome was nearly significant at the corrected level.
The strength of evidence for these specific results depends on the interpretation of the estimates. From one viewpoint, they may likely be noise. We specifically apply a correction because with so many statistical tests, there are likely to be a few false positives even in a reality with null effects; in fact, we expect exactly the amount of false positives we see here: 1-2 false positives from 30 tests. Furthermore, statistical significance acts as a clear demarcation and threshold for what is considered evidence in formal publication even if evidence truly lies along a continuum.
On the other hand, all uncorrected-significant effect estimates were for the same exposure, and all were in the expected correct direction. When considered as pure effect estimates with substantial posterior mass in that expected direction, they instead provide light evidence. Either way, the main takeaway is that vegetarian dish availability as a proportion of the menu may have effects on meat reduction (but not necessarily on animal product reduction in general), but this should be further investigated.
The forest plot of effects for A1 is below. To interpret the plot, here’s an example using one of the pooled estimates: the effect of vegetarian availability (as a count) on vegetarian purchases had a point estimate of 2% (very bottom right), indicating an exposure-driven +2% change in purchases relative to changes in total purchases. This could happen if the vegetarian purchases estimate was 22.4% (1.224) and total purchases estimate was 20% (1.20) since 1.224/1.20 = 1.02 but it could also be 0.918/0.90 = 1.02. In simple terms, the vegetarian dish count was associated with vegetarian purchases growing 2% above and beyond total purchases.
Interactive plots for all analyses can be found here.
The other analysis sets, A2-A4, had only null results.
A2
A2 assessed the effect of the overall availability of category-matched alternative proteins on category-matched meat- and animal-product-containing dishes. We measured availability as both a ‘count’ and a ‘presence’ on the menu. Due to a lack of category-matched alternative proteins, the ‘presence’ models did not afford pooled estimates. The remaining ‘count’ models amounted to = 4 pairings and therefore 4 pooled estimates, which were 1) breakfast-style meat (sausage and bacon), 2) chicken, 3) dairy, and 4) egg dishes.
A3
A3 assessed the effect of newly introduced alternative proteins on the same five general outcomes as A1. We specifically treated each first appearance of an alternative protein in the restaurants as a quasi-experiment, and estimated the change in purchases around that date using an interrupted time series. Unlike A1 and A2, interrupted time series yields two estimates per pairing: a ‘level change,’ the immediate shift in purchases at launch, and a ‘slope change,’ the shift in the annual trend afterwards. With 5 outcomes and 1 exposure we then had 5 pairings and therefore 10 pooled estimates. None were significant, corrected or uncorrected, though each points in the expected direction.
A4
A4 assessed the effect of newly introduced alternative proteins on the same counterpart-specific outcomes as A2. Two outcomes only had a singular restaurant; the only pooled estimate was breakfast-style meat. With 1 outcome-exposure we then had 1 pairing and 2 pooled estimates. Neither were significant, corrected or uncorrected, but both point in the expected direction.
The restaurants in detail
In our investigation, we started with 31 restaurants. Twelve of the restaurants had low data quality (extensive missing data) or alternative protein introductions that weren’t relevant to our study (products that were not modern or confounded introductions). Of the remaining 19, only 7 restaurants had data of high enough quality for us to have full confidence in the final estimates; we analyzed all 19 together as a separate second-tiered analysis.
None of the restaurants were affiliated with national brands. They represent multiple cuisines and smaller service formats including independent fast-casual establishments and local chains with multiple physical locations. The 7 primary restaurants were: 1) a local Greek rotisserie chain, 2) a local fast-food burger chain, 3) a German sausage grill, 4) a salad and panini shop, 5) a breakfast café, 6) a coffee shop, and 7) a predominately vegan juice bar.
They had a total of 7 introduction events, and featured 32 alternative protein products across new introductions and already established products. The full spread mimics:
Burgers (4/32; Impossible Foods, Beyond Meat)
Sausages (3/32; Field Roast, Beyond Meat)
Sausage patties (4/32; Impossible Foods, other)
Lamb (1/32; Black Sheep)
Bacon (1/32; Thrilling Foods)
Chicken (1/32, unknown brand)
Egg (2/32; JUST Egg)
Cheese (2/32; unknown brand)
Cream cheese (1/32; unknown brand)
Sour cream (1/32; unknown brand)
Vegan baked desserts (12/32; made in house with unknown brands)
As seen from this list, we were also interested in alternatives for animal-based products more broadly including egg and milk alternatives. There were no cultivated products.
Real-world data problems
In total, we analyzed 1.2 million transactions across our 7 restaurants. The dataset’s original labels (e.g., plant based) were limited and contained extensive measurement error; real-world transaction data is unstructured and very messy, in this case containing data entry errors, inconsistent naming schemes for dishes, and complete misclassifications. More importantly, customer-specific modifications to dish orders were exceedingly common and we wanted labels for specific product categories, including nonvegan, meat-containing, chicken-and-fish-containing, vegetarian, and vegan[9]. Automating labeling was the obvious choice, but we made sure to validate our labels with manual annotations for dish name, order modification combinations that covered thousands of dishes and orders; this amounted to consolidating 3,364 point-of-sale item names into 393 verified menu items and reconstructing menu timelines from web archives and social media.
At the time of annotation (spring 2025), this required some cleverness with regard to the ‘in-context learning’ and LLM harness used, including supplying ground-truth menu context, batching, and reinjecting context at the right interval. The ‘Thinking’ feature in models, newly available in the budget models Gemini 2.5 Flash, o4-mini, and Claude ~3.7 Sonnet during April, in particular marked the line between accurate and inaccurate labeling for this dataset. With current flagship models (summer 2026), labeling would likely require less of this scaffolding per some recent tests.
Where do we go from here?
Alternative proteins were not found to definitively replace meat or animal product purchases in this study.
To be clear about what we did not test: cultivated meat, grocery settings, and price interventions (what happens if alternative proteins truly undercut meat in price). Also, 7 restaurants is a convenience sample from essentially only the US; observational data can’t conclusively establish causation despite preregistration, confounder adjustment, and ITS[10] designs; and real-world transaction data required substantial processing that surely retains imperfections.
The question is, how does this inform our steps going forward regarding 1) investing in plant-based alternative proteins, 2) developing and distributing cultured meat, 3) plant-based defaults, and other interventions? To return to the point in the beginning: we don’t know how close we are to the sensory ceiling, and if we are closer than we expect, learning where and when alternative proteins work may be more marginally effective than solely optimizing them.
One concrete implication for us: anyone building cost-effectiveness estimates for alternative protein investment on assumed displacement rates should treat those rates as an open empirical question rather than a given.
preprint · preregistration · data repo · analysis repo · interactive
Happy to answer any questions!
Acknowledgements
We’d like to gratefully thank Coefficient Giving and the Food Systems Research Fund for supporting this research, as well as Palate Insights and Souvla for providing data.
- ^
In the full manuscript, we frame this as 7 restaurants, since we perform analyses on both a higher-data-quality 7-restaurant set and a larger 19-restaurant set including those 7 restaurants.
- ^
The restaurants were predominately in the US, with a few in Canada and Australia.
- ^
We analyze changes within individual customers by linking anonymous transaction identifiers that include gender metadata.
- ^
They also found an “increased proportion of vegetarian products sold outside of the main meal range at lunch,” which they attribute to a possible “spillover effect of perceived social norms of vegetarianism, implicitly communicated via the higher availability of vegetarian main meals.” (Admittedly these meals were not “alt proteins” per se, but vegetarian and animal-based entrees were broadly similar in protein content, with an average difference of 2g less protein per vegetarian meal.)
- ^
When it was unclear whether products were ‘modern,’ the determining factor was their marketing and packaging at retail. For example, tofu, tempeh, jackfruit, and seitan would only be considered second generation when intended to emulate specific products out of the package: scrambled eggs (scrambled tofu), bacon (sliced tempeh), pulled pork (pulled jackfruit), and beef chunks (chunked seitan).
- ^
Definition: Household penetration is the percentage of total households in a specific market that purchase or use a product.
- ^
The higher-data-quality 7-restaurant set and the full 19-restaurant set, as described earlier.
- ^
Through working with the data, we determined ‘modifiable to include alternative proteins’ to be a better qualifier than strictly ‘containing’ here, since 1) many but not all menu items were modifiable, and 2) this choice is what customers experience at the time of order.
- ^
We also composed six product-specific classes from 14 more granular product categories. Breakfast-style meat as a class was composed of 1. bacon, 2. sausage, and 3. sausage patty. Similarly, we had ground meat (4. burgers, 5. meatballs, and 6. unformed ground meat), whole-muscle meat (7. pulled pork, 8. chunked lamb, and 9. other chunked meats), and chicken (10. fried and 11. unfried). For nonmeat classes, we had dairy (12. sweet and 13. savory) and egg (14. any).
- ^
Interrupted time series.
I think the key thing to test is when plant based substitutes are significantly cheaper than animal products. The two examples I know of now are margarine and egg replacer. The former got big market penetration (and I think some actual substitution) and the latter didn’t. As I’ve argued elsewhere, we could get plant based burgers to cost parity or better if we built a bigger factory. Then I think there would be some substitution for price sensitive consumers.
Jacob, together with Samara Mendez, previously wrote a shallow review about butter and margarine price substitution. They found that some studies, surprisingly, show them to be complementary goods, and thought this was primarily due to weird consumer behaviour not always reflecting econ 101, and secondarily due to econ methodologies always not capturing reality.
Wow—bizarre.
I agree that cost is the most important variable, especially when considering global impact. This study further reinforces some core beliefs I have about meat analogues:
1. At least for the next several years, the primary goal of commercializing meat analogues is to drive further R&D and scale production that will reduce cost (and increase quality)
2. An underrated outcome of meat analogues is making the cognitive leap to decide to become a vegetarian or vegan less daunting, which probably would not show up in these data
3. The vast majority of people who eat meat will not consider meat analogues attractive until they are far superior to animal products in at least one key way (cost, taste, and/or nutrition)
4. No matter how high-quality meat analogues become, most vegetarians and vegans will often choose traditional plant protein options like tofu, tempeh and legumes
I talk about this paper in light of comparing more modern meat alternatives (Beyond/Impossible/etc.) to traditional vegetarian mains (tofu/curry/etc.), and why the academic literature at least suggests more cause for optimism about the latter than the former, here:
https://regressiontothemeat.substack.com/p/the-more-successful-add-more-veggie
thank you very much for this really rigorous research