Exploring Key Cases with the Portfolio Builder

Key Links:
Introduction
Here, we show how the Portfolio Builder can be used to explore several scenarios and controversies of interest to the EA community. We are far from certain that the parameter values we have chosen below are accurate; we have not rigorously vetted them. Instead, we have used intuitive parameter values for illustrative purposes. Our goal here is to show users how they can put the Portfolio Tool to work, not to settle first-order questions.
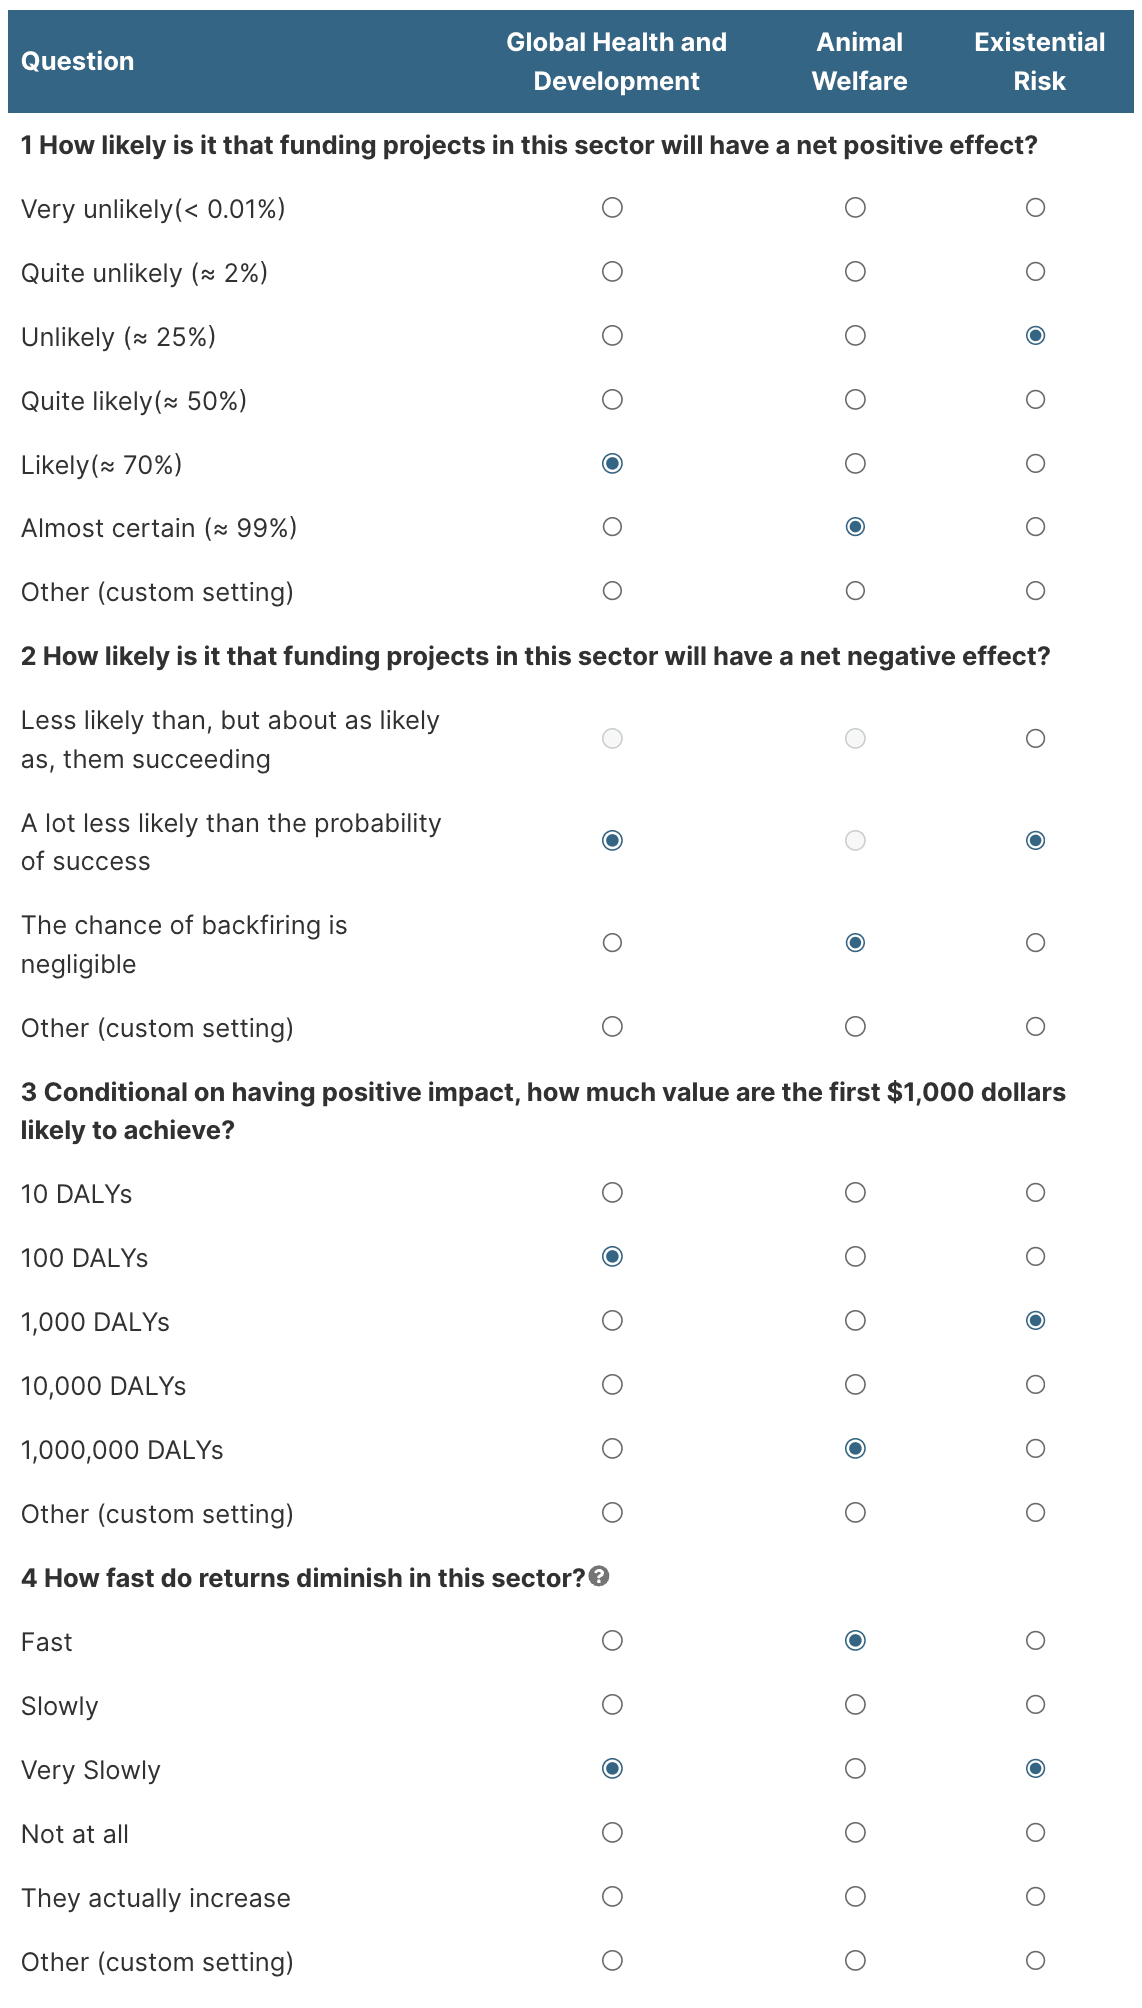
Portfolio allocations across cause areas are strongly influenced by one’s views about the potential scale of successes in those areas and the probability of those successes. For example, if you assign little or no value to the lives of animals, you will think that even “successful” projects in that area achieve very little. The expected value of x-risk actions varies by many orders of magnitude depending on one’s estimate of the value of the future (and future risk trajectories). In the tool, scale is primarily captured by the value of the first $1,000, which users can specify via their answer to quiz question 3 or by manually adjusting the ‘Positive Payoff Magnitude’ in the custom settings. This sets the initial scale of the payoff curve, telling you how much value is achieved for $1,000. Then, the rate of diminishing returns tells you how much the curve’s slope changes as more money is spent. For this reason, the rate of diminishing returns also captures aspects of overall scale. If you think that a cause area is very cost-effective at small amounts of money but that returns fall off rapidly, the overall amount of good that can be achieved in that area will be quite small. We can use these two strategies to characterize several key scenarios.
Focusing on the next few generations
Consider the “common sense case” for x-risk reduction, which only assesses x-risk actions by their effects on the next several generations. Here, we draw on Laura Duffy’s analysis of the cost-effectiveness of x-risk actions under a wide range of assumptions and decision theories. To evaluate the relatively short-term effects of x-risk reduction, we assume that the world’s average population size and quality of life per person will remain similar to their current levels (generating about 8 billion DALYs/year) and only consider value over the next 120 years. Therefore, we estimate that there are about 1 trillion DALYs in the span of the future that we care about here.
One way to characterize this scenario is to start with an estimate of the basis points of risk reduced per billion dollars spent (basis points per billion or bp/bn). Then, we use the estimate of the available value in the short-term future to calculate the expected value of a basis point reduction in risk. The naive way to do this is as follows.[1] Suppose we estimate that a successful x-risk project would reduce 3 bp/bn. If the future contains 1 trillion DALYs, 3 bp has an expected value of 300 million DALYs. A cost-effectiveness of 300 million DALYs per 1 billion dollars spent is the same as 300 DALYs per $1000.[2]
Suppose we take that 300 DALYs/$1000 estimate to be the all-things-considered estimate of the cost-effectiveness of x-risk, which already incorporates both the possibilities of futility and backfire. Then we would assume that x-risk has a 100% chance of success and adjust the scale and diminishing returns until the expected DALYs/$1000 is correct (for the budget we’re going to spend):
At these levels of cost-effectiveness, the tool tends to assign all of the portfolio to x-risk causes under EV maximization.[3]
However, we don’t think that the 3 bp/bn estimate is best thought of as the all-things-considered expected value of x-risk funding. Instead, it should be thought of as the value of the project if successful, where the overall all-things-considered expected bp/bn of the project will incorporate probabilities of futility and backfire as well. As Duffy shows, an all-things-considered 3 bp/bn requires fairly favorable assumptions about the chances of success (see Table 1 on p. 26 of her report here).
We can use the custom settings of our tool to specify more detailed assumptions about x-risk interventions. Here’s one way to do it. Suppose we assume that a successful x-risk project would reduce 3 bp/bn. Then, assume the project has a 100% chance of success and find the scale that would deliver the 3 bp/bn = 300 DALYs/$1k amount for the budget you are considering. In our example, the Positive Payoff Magnitude that does this is 1.7 (see Figure 1). From there, you can manipulate the probabilities of success and failure (users can upload this scenario and manipulate parameters here). For example, perhaps you think the project has a 0.1 chance of succeeding, 0.01 chance of backfiring, and 0.89 chance of doing nothing, you would adjust the parameters accordingly. Introducing futility and backfire significantly reduces the expected DALYs/$1k. The most plausible x-risk project scenarios that Duffy considers reduce around 0.25 bp/bn = 25 DALYs/$1k, in line with our estimates here.
This affects the tool’s recommended allocations. Under EV, it recommends giving some of the budget to GHD and animal causes, even when we make fairly conservative assumptions about those cause areas (70% chance of success, 100 DALYs/first $1k, slowly diminishing returns, for an overall expected 22 DALYs/$1k over the entire budget)[4]:
If we make less conservative assumptions about the GHD and AW sectors, the allocations tilt in favor of them over x-risk. For example, if we think that GHD is almost certain to succeed, rather than 70% likely to succeed, then it dominates the expected value portfolio:
If we are more optimistic about animal causes, estimating a payoff of 1000 DALYs for the first $1k, then the tool says that giving everything to animal welfare will maximize EV (a point we will return to below).
As we can see, while expected value portfolios tend to favor x-risk, there are many parameter settings for which they do not. The effects of risk aversion tend to be more predictable. Under DMREU, the tool recommends giving most of the budget to GHD and AW causes since risk-averse decision theories punish options that have higher chances of futility or backfire:
High vs. low weights for animals
The Portfolio Builder is designed to answer questions about how we should distribute funding across different cause areas that have very different effects and beneficiaries. Moral weights are an attempt to measure the value of various outcomes on a common scale, so that cost-effectiveness estimates (value gained / $ spent) can be made across interventions that have very different effects. Insofar as we face choices between neartermist causes, we face choices about the relative importance of human and nonhuman welfare. If we value animals highly, then given the enormous number of farmed animals, animal welfare causes may dominate both global health and x-risk.
However, these choices depend on factors about which we are deeply uncertain. Rethink Priorities’ Moral Weights Project was one attempt to derive moral weights for various animal species, based on assessments of their probabilities of being sentient and their welfare ranges. Others assign lower moral weights, either because they judge that animals have lower probabilities of sentience or smaller welfare ranges, or because they place more value on non-hedonic goods that are distinctively human.
Using RP’s moral weights, we estimate a mean cost-effectiveness of around 1000 DALYs/$1k for highly successful animal welfare projects (e.g., reducing ammonia concentrations in shrimp farming and corporate campaigns for chickens). If we use much lower moral weights, we get cost-effectiveness estimates in the range of 20-100.[5] Clearly, recommended portfolios will differ significantly across this extensive range (different assumptions within the narrower range of 20-100 can also make a significant difference).
For example, suppose we just want to compare short-termist causes by setting the probability of impact of x-risk to 0. If we adjust the settings so that GHD averages 22 DALYs/ $1k over the budget and AW to the high estimate of 1000 DALYs/ $1k, then the tool allocates the entire budget to animals. Indeed, it allocates all the money to animals even at the higher end of the range of low moral weights.
Diminishing marginal returns
Many cause prioritization debates have centered around highly abstract theoretical issues: what is the correct way to treat low probabilities? Does the future have astronomical value? What are the relative moral weights of humans and non-humans? However, most actual funding decisions also turn on much more practical considerations: How many projects are shovel-ready? Which organizations can be trusted to spend money effectively? Can the best charities absorb any more funding or are they heavily constrained? Will my funding encourage or dissuade others from giving to the same causes?
These practical considerations concern a cause area’s diminishing marginal returns. There is some reason to think that judgments about diminishing returns have been extremely influential in determining actual allocations across various cause areas. This is borne out to a striking degree in the Portfolio Builder.
For example, suppose that it is true that farmed animal welfare projects, such as corporate campaigns for chickens, have been enormously cost-effective. However, suppose you think that we have already done the most effective projects, and there are no good candidates for new projects that would have similar impact. Therefore, you judge that returns in the AW space will diminish fast. Even if you are extremely optimistic about the cost-effectiveness and likelihood of success in the AW space (and relatively pessimistic about GHD and x-risk):
The optimal allocation under EV assigns almost nothing to AW:
If we instead assume that returns on AW funding diminish slowly, the entire budget is now allocated to animal causes:
There is nothing special about the animal sector here. Changing the diminishing marginal returns for cause areas has an enormous influence on allocations (and this holds for all decision theories). This is both obvious and under-appreciated. Attention to the actual economics of the philanthropic space can get lost in abstract philosophical debates. It doesn’t matter whether the value of the future is astronomical or animals have as much moral value as humans if the dollars we spend are ineffective in bringing about that value.
The significance of marginal returns also suggests that further research on the cost-effectiveness of capacity-building would be highly valuable. Money spent to increase the marginal utility of a cause area (e.g., by seeding new philanthropic projects in that space) could have enormous downstream effects on optimal funding allocations.
Acknowledgments
The Portfolio Tool is a project of the Worldview Investigation Team at Rethink Priorities. Arvo Muñoz Morán and Derek Shiller developed the tool; Hayley Clatterbuck wrote this post. Thanks to Arvo Muñoz Morán and David Moss for helpful feedback. If you like our work, please consider subscribing to our newsletter. You can explore our completed public work here.
- ^
We don’t think this is the right way to calculate the expected value of the future since it does not take the risk profile of the future into account. For example, if you think that we face many background risks that pose a significant chance of extinction or value reduction over the next 120 years, then the expected value of reducing risk is much lower.
- ^
A second strategy for putting a cap on the value of the future is to use diminishing marginal returns. Because the amount of value yielded per $1000 will decrease with larger amounts of spending, the cost curve will eventually flatten. We explore diminishing marginal returns later in this post.
- ^
It is not appropriate to use other decision theories here since we did not specify probabilities of futility or backfire. Again, we took the 3 bp/bn estimate to already incorporate those values.
- ^
This adapts estimates for the cost-effectiveness of GHD projects from Open Philanthropy’s Cause Prioritization Framework. See the Portfolio Builder Tool FAQ for full details.
- ^
The mean of RP’s sentience-conditioned welfare range for chickens is 0.29. The lower welfare ranges for chickens that we use for comparison are between 0.01 and 0.04. See Duffy (2023) for the methodology.
- What do RP’s tools tell us about giving $100m to AW or GHD? by (7 Oct 2024 20:41 UTC; 167 points)
- Doing Prioritization Better by (16 Apr 2025 9:53 UTC; 144 points)
- Taking Uncertainty Seriously (or, Why Tools Matter) by (19 Jul 2024 10:30 UTC; 116 points)
- Rethink Priorities’ Portfolio Builder Tool by (10 Jul 2024 12:06 UTC; 103 points)
- 's comment on Doing Prioritization Better by (29 Apr 2025 9:25 UTC; 4 points)
- Doing Prioritization Better by (LessWrong; 16 Apr 2025 18:46 UTC; 3 points)
Executive summary: The Portfolio Builder tool can be used to explore different scenarios in effective altruism by adjusting parameters like scale, probability of success, and diminishing returns for various cause areas, demonstrating how these factors influence optimal funding allocations.
Key points:
Short-term x-risk reduction scenarios show how probability of success and scale affect expected value calculations and funding recommendations.
Moral weights for animals significantly impact whether animal welfare causes dominate portfolios.
Diminishing marginal returns have an enormous influence on optimal allocations across cause areas.
The tool illustrates tradeoffs between global health and development, animal welfare, and existential risk reduction under different assumptions.
Further research on cost-effectiveness of capacity-building could greatly affect optimal funding allocations.
This comment was auto-generated by the EA Forum Team. Feel free to point out issues with this summary by replying to the comment, and contact us if you have feedback.