Medical research: cancer is hugely overfunded; here’s what to choose instead
Note: the below was posted to my blog; I expect formatting etc will be rendered better there. Also some important appendices and footnotes are available there, but not here. Apologies to international readers for the UK slant on this article, although I suspect that a similar story would apply in other developed countries.
-----------------------------------------------------------------------
If you’re going to donate to medical research, don’t donate to cancer—there are better choices. Cancer accounts for 43% of the research spend, but only 9% of the disease burden, and you can see in the chart below that it’s an outlier.
Having said this, it may still be a better choice than some other (non-medical-research) charities.
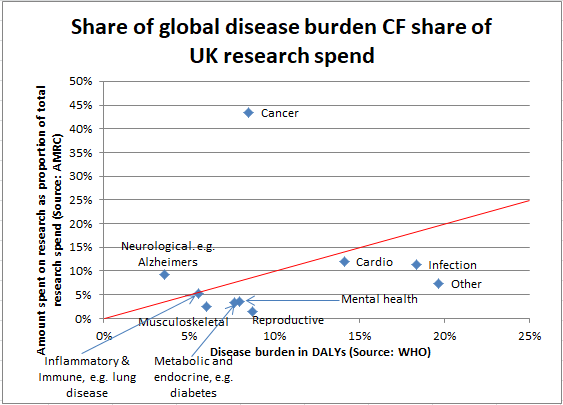
This chart seems to lead to the conclusion that you should pick other areas of research to fund, rather than cancer, on the grounds that it’s already a crowded funding area. Better areas appear to be reproductive health & childbirth and infectious disease. If you want to see a table of the data from this chart, together with the figures that show the gap between the disease burden and the research spend (this gap being proportional to the distance of the point from the red line on the above chart) check out the footnote1. (reminder—for footnotes, see my blog)
Reasons why you might disagree with this conclusion
1. Tractability—scale and neglectedness aren’t the only things that matter
2. You may disagree with the DALY weights
3. The research spend figures are only showing part of the picture
4. Some categories may be being researched, but aren’t captured in these stats properly
5. This chart uses global disease burden—you may care about the local disease burden
6. These categories are too crude
1. Tractability—scale and neglectedness aren’t the only things that matter
The chart above may seem to suggest that the scale of the problem is the only factor to consider. This is not the case. We may choose to fund something because we think that more progress will be made if we fund that area; in this scenario, we may say that this is a more tractable (or “easy”) area of research. In general tractability is good, because funding something with a higher chance of success is better than funding something with a lower chance of success, all other things being equal.
However, we know that the funds *aren’t* being allocated to cancer as opposed to other areas because donors have taken this into account and consider cancer to be more tractable.
So should we expect better tractability, or better progress, from well-researched areas (such as cancer) or less-well-researched areas (such as mental health)?
Some examples to illustrate what I mean:
- Cancer: Cancer Research UK talk about the current cancer survival rate having reached 50%, and their aim to reach 75% by 2034; my reading of their language is that they are optimistic that cancer (an area which already has a track record of progress) is a good tractable area to fund.
- Mental Health: MQ (a mental health research research charity) seem to consider funding under-funded research to be an opportunity; as far as I can tell, they have made no explicit claims that (for example) mental health may have lower hanging research fruit, so to speak. However implicit in their language is the belief that tractability for mental health is at least as good as that of cancer.
My—admittedly cursory—conversations with researchers suggest that there are arguments both ways as the above examples suggest. Sometimes an under-explored area can yield low-hanging fruits; sometimes an area being under-explored means that researchers haven’t quite worked out the best research questions to ask yet, which might mean that research in that area is leading nowhere.
To my mind, both arguments seem reasonable, so I’m inclined to assume that we can treat tractability as roughly equal across health categories. If anyone can give a better, and evidence-based, indication of how to treat this, I would love to take this into account.
2. You may disagree with the DALY weights
Determining the disease burden involves using a measure commonly used by the WHO called the DALY, which counts how many years have been lost from people dying together with the number of years spent in disability. DALYs generally assume that being disabled is better than being dead, but how much better depends on the disability; a weighting factor is assigned to each type of disability2. However getting these right is hard, and you may disagree with the WHO on this.
3. The research spend figures are only showing part of the picture
It’s true that the figures focus just on UK spend, and also ignore government expenditure. It could be that, for example, that UK charitable cancer research spend is really high to make up for a lack of government spend on cancer research, or a lack of spend by other developed nations. I suspect that this isn’t true, however I haven’t done the digging to check.
The reason I suspect that this isn’t true is (to echo an earlier comment): we know that the funds *aren’t* being allocated to cancer as opposed to other areas because donors have taken this into account and are making up for a lack of government or international research spend.
4. Some categories may be being researched, but aren’t captured in these stats properly
For example, 2.7% of the global morbidity burden comes from road injuries. It could be that research is happening on road injuries, but (perhaps) it’s not captured in the statistics because the source of the data (the Association of Medical Research Charities, or AMRC) used data that didn’t treat this as medical research.
Overall, I don’t think this is likely to be a concern, except in “Other”, which in any case is a fairly unhelpful category.
5. This chart uses global disease burden—you may care about the local disease burden
Interestingly, I had assumed that changing the global disease burden to the UK-specific disease burden would account for the apparent over-allocation to cancer, however it appears that this only goes part of the way towards doing this—there is still a material over-allocation to cancer based on the UK prevalence of cancer. I’ve created a copy of the above chart, but replaced the global disease burden with the UK-specific disease burden—you can find the chart below3. (reminder—for footnotes, see my blog)
6. These categories are too crude
To a certain extent, this is a fair criticism—for example, lumping together several different metabolic and endocrine diseases leaves open some of the uncertainties that arise from lumping things together; e.g. maybe the proportion spent on diabetes research is (perhaps) higher than the proportion of disability burden attributable to diabetes, but we aren’t seeing it because the disease burden for non-diabetes conditions within the metabolic/endocrine category is also quite high. (I haven’t checked whether this is the case.) As a later piece of work, I may see whether it’s possible break those categories down further.
In particular, “Other” is a notably crude and unhelpful category; it is likely that it includes some sub-categories which are more neglected than reproductive health or infectious disease, so seeing this breakdown could be useful.
However I don’t think it detracts from the conclusion about cancer—it’s still true that the UK allocates 43% of its research funding to cancer, whereas the only 9% of the global disability burden is for cancer.
A minor note...
In case you’re feeling like you’ve seen something like this before… after the ice bucket challenge there was an infographic doing the rounds that compared how much money research charities got with how much they kill people. I would suggest that this chart is in fact much better than that infographic—if you would like to know more, I’ve expanded on this in a footnote.4 (reminder—for footnotes, see my blog)
And lastly, apologies to international readers for the UK focus of this piece. I suspect that its conclusions would still apply in most other countries in the developed world, but have not checked this.
For sources, appendices, and footnotes, please see http://thinkingaboutcharity.blogspot.co.uk/2017/08/donating-to-medical-research-heres-why.html.
That goal can be easily reached. You just need to double the people that you diagnose with cancer.
In practice, it’s possible to increase the number of people that get diagnosed with cancer by increasing the amount of screening that’s done.
The US does more screening than Europe and has as a result a higher cancer survival rate. In recent years the US government came to the conclusion that the US does overtesting that doesn’t provide clinical benefits and pushed back breast cancer screening to a higher age.
The goal of cancer research should be about lowering the number of cancer death per year. If there’s the argument that curing other illnesses increases the cancer death rate, then an alternative goal might to reduce the amount of people who die to cancer under the age of 80 years.
This article (on The Conversation) describes in detail why survival rates are misleading—due to Lead Time and Length Time bias—and how death rates reveal the actual benefits of screening.
Cancer research may not be so bad at far as developed world interventions go.
The Wellcome Trust, a UK-based medical research charity funding research into human and animal health, estimated that “total expenditure on cancer-related research [in the UK] from 1970 to 2009 was £15 billion” and that “over the period 1991–2010, the interventions included in the study produced 5.9 million quality-adjusted life years”. This would imply a return of £2542.37 per DALY at the time of the study, or ~$4195 per DALY in 2016 US dollars.
Separately, Holden Karnofsky at the Open Philanthropy Project estimated the cost-effectiveness of cancer research in the US to be ~$2800 per DALY.
Notably, none of these estimates compare well to the best developing world interventions (~$80 per DALY), but they are far more cost-effective than the average medical intervention at $30K per DALY in 2016 US dollars (Tengs, et. al., 1994, p371).
Of course, that these estimates are not robust and comparisons with figures from other sources are not apples-to-apples.
Agreed. I think that medical research is probably a pretty decent choice for the reasons you give, but that cancer is likely to be the worst choice within the medical research space.
Many attempts to do anti-aging treatment and attempts to cure diseases with gene therapy lead to increased cancer rates. If we would succeed in solving cancer we could use more aggressive treatment for other diseases.
This isn’t a criticism of the analysis but a question about the audience for which it was intended. Do many EAs give to medical research? Whilst there are lots of non-EAs who donate to, say, cancer research, I can’t remember having a conversation with an EA where they’d said this is what they donate to.
FWIW, I agree that cancer seems to substantially overfunded compared to alternatives.
Personally, I’d recommend donating to fund nanotechnology research (especially nanobiotechnology). Almost all diseases fundamentally occur at the nanoscale. I’d assume that our ability to manipulate matter at this scale in targeted ways is close to necessary and sufficient to cure many diseases, and that once we get advanced nanotechnology our medicine will improve leaps and bounds. Unfortunately, people like to feel that their interventions are more direct, so basic research that could lead to better tools to cure many diseases is likely drastically underfunded.
What exactly does that mean? What kind of nanotech are you thinking about?
The vast majority of ailments derive from unfortunate happenings at the subcellular level (i.e. the nanoscale). This includes amyloid buildup in alzheimers, DNA mutations in cancer, etc etc. Right now, medicine is—to a large degree—hoping to get lucky by finding chemicals that happen to combat these processes. But a more thorough ability of actually influencing events on this scale could be a boon for medicine. What type of nanotech am I envisioning exactly? That’s pretty broad—though in the short/ medium term it could be carbon nanotubes targeting cancer cells (http://www.sciencedirect.com/science/article/pii/S0304419X10000144), could be DNA origami used to deliver drugs in a targeted way (http://www.nature.com/news/dna-robot-could-kill-cancer-cells-1.10047), or could be something else entirely.
Given that these all seem to connect with aging issues, I wonder how open the EA community would be to tackling aging as an illness. The foundation that focuses on this is the SENS Foundation (http://www.sens.org/). Aubrey deGrey is the leading figure behind this focus (https://www.youtube.com/watch?v=AvWtSUdOWVI).
I was looking for information about what you are saying and this page seemed interesting to me, especially with the new genetic technology of chromosomes should take a lookhttps://medicalnews.science/