EA Survey 2019 Series: Cause Prioritization
Summary
Global Poverty remains the most popular single cause in our sample as a whole.
When pressed to choose only one of the traditional broad cause areas of EA (Global Poverty, Animal Welfare, Meta, Long Term Future, Other) the Long Term Future/Catastrophic and Existential Risk Reduction is the most popular (41%).
42% of EAs have changed their cause area focus since they joined the movement.
A majority (57%) of those who changed cause moved away from Global Poverty, and a majority (54%) moved towards the Long Term Future/Catastrophic and Existential Risk Reduction.
There are many differences in cause prioritization across groups. On the whole, more involved groups appear to prioritise Global Poverty and Climate Change less and longtermist causes more.
One should not infer too large a relationship between levels of involvement in EA and cause prioritization due to the absence of perfect instruments for measuring cause prioritization and because some influences on cause prioritization may not be captured in the survey data.
This post is the second in Rethink Charity’s series on the EA Survey 2019, which provides an annual snapshot of the EA community. In this report, we explore how EAs in the survey prioritize cause areas, how they have changed cause preferences since they joined EA, and differences according to demographics and group membership. In the first post we explored the characteristics and tendencies of EAs captured in the survey. In future posts, we will explore how these EAs first heard of and got involved in effective altruism, their donation patterns, geographic distribution and their career paths, among others. We are open to requests from the community of analyses they would like to see done, albeit with no guarantee that we can do them.
Introduction
Peter Singer recently cautioned against EA having too narrow a focus, specifically highlighting existential risk as the public face of EA being a threat to a broad-based movement. How many and which causes to prioritize is a continual topic of discussion in the EA community. On the EA Forum there have been many discussions about the relative cost-effectiveness of global poverty compared to animal welfare and climate change, the relative emphasis on meta versus direct work,longtermsim, and the search for Cause X, among others. In this year’s survey data we can explore how much priority EAs think a given cause should receive and how this differs by levels of involvement in EA, if at all. This analysis draws mainly on three key questions in the survey: fine-grained cause areas, broad cause areas, and cause switching. These questions are included in the appendix.
Top causes
Fine-grained cause areas
The simplest (though crudest) way to analyse these responses is to look at the share of “top priority” responses for each of the fine-grained cause areas. People could rate more than one area as the “top priority”. This means the total number of responses may exceed the number of respondents, but conceptually it is reasonable to think EAs can hold multiple top priorities and engage in worldview diversification. In the figure below we show what percent of all “top priority” responses went to a given cause area. 1,687 respondents chose at least 1 top priority cause and 278 (16.5%) of these selected more than one top priority cause.
N.B. images can be viewed in full size if opened in a new tab.
As in previous years (1,2), Global Poverty was the largest single cause out of the options presented. Climate Change received the second largest number of top priority responses, followed by AI Risk. This is a reversal from 2018’s results but the difference between Climate Change and AI Risk prioritization does not seem very substantial. Without longitudinal panel data it is unclear if this is due to under/oversampling,veteran EAs changing their preferences or a change in the composition of preferences among EAs due to factors like recruiting more EAs who prioritize Climate Change. Mental Health and Nuclear Security attracted the fewest responses indicating that they should be the top priority, as in 2018’s survey.
Despite some limitations we noted last year, we again combine AI Risk, Biosecurity, Nuclear Security and Existential Risk (other) together into one Long Term Future category. When doing so, the gap between Global Poverty and Long Term Future type causes is substantially reduced, such that Long Term Future (combined) is the second most popular top priority cause.[1]
Broad cause areas
Following through on our stated intention last year to get better insight into the issues arising from offering more fine-grained cause options, we asked about Long Term Future cause prioritization as whole, alongside other traditional broad cause area options (Global Poverty, Animal Welfare, Meta, Other). When pressed to choose only one top cause, a plurality (40.8%) chose the Long Term Future/Catastrophic and Existential Risk Reduction (LTF).[2]
We can compare the split between the fine-grained and forced choice questions. We look at how those who selected a “top priority” cause when able to choose multiple fine-grained causes changed their selection when they were forced to choose just one of the broad cause areas.
As might be expected, the majority (87%) of those who selected “top priority” for Global Poverty then selected Global Poverty in the forced choice question, 80% of those preferring Animal Welfare chose Animal Welfare, and 60% of Meta top priority supporters chose Meta. Those who gave top priority to Cause Prioritization broke almost equally towards LTF (35%) and Meta (36%) and those prioritising Mental Health favoured Global Poverty the most (37%). Pluralities of the other causes broke towards LTF: AI Risk 85%, Other X-risk 77%, Nuclear Security 60%, Biosecurity 55%,Climate Change 46%,Other Cause 38%, Improving Rationality/Decision Making/Science 33%.
This is more clearly seen in the ribbon plot where only the largest number of responses moving from each category is highlighted in orange.[3] The majority of those who gave Global Poverty “top priority” (on the left) also then picked Global Poverty when forced to choose only one cause (on the right). One can also clearly see the flow from many of the other cause areas towards Long Term Future.
One might have expected that those who selected one of the fine-grained top priority causes not specifically represented by one of the broad cause area labels (such as Mental Health) would have then selected “Other”. However, no plurality of any cause area opted for “other” when forced to choose only one. This could imply latent second choice preferences, or simply that respondents slotted their preferred specific cause into one of these broad categories (Climate Change into Long Term Future or Mental Health into Global Poverty). This may also be helpful in understanding who EAs perceive the primary beneficiaries of a cause are; those alive today or in the far future. For example, it is also noteworthy that a plurality (nearing a majority at 46%) of those who chose Climate Change then opted for Long Term Future/Catastrophic and Existential Risk Reduction.
Full range of responses
Looking at only “top priority” cause selections misses out on a large chunk of the data and opinion within the EA survey. The full range of responses suggests a more even distribution of interest in causes across EAs.
In the likert graph below, causes are listed in descending order based on the average of their full scale rating.[4] Most listed causes received substantial support, with no cause receiving fewer than 59% of respondents suggesting that it should receive at least “significant resources”. The top five causes, as ranked by EAs in the survey, are Global Poverty, Cause Prioritization, AI Risk, Climate Change, and Biosecurity. These all received 44% or more of responses indicating that they are near-top or top priorities. It appears then that there is considerable overlap in the top cause areas prioritized by EAs in the survey and those areas highlighted by a recent survey of some EA organization leaders [5] and 80,000 Hours’ problem profiles page.[6]
Most causes were judged by ~34-49% of respondents as being the “top priority” or “near the top priority”. The exceptions were Nuclear Security and Mental Health, which received only ~22-29% of respondents ranking each of them that highly, and Global Poverty, which 62% of respondents rated as a top or near top priority.
Write-in cause areas
The fine-grained cause rating question gave respondents the option to write in an “other cause”. ~30% of these were reiterations of cause areas already listed(the most common responses falling under improving rationality/decision making). Some of these sought to make clearer distinctions within these broader categories. For example, 10% demarcated Global Health from Global Poverty and 4% wanted to specify Wild Animal Suffering as distinct from Animal Welfare/Rights. The other most popular causes mentioned were S-Risks (7.8%), international relations or great power conflict (6.5%), and EA movement building (5.5%). Much smaller shares mentioned economic growth, anti-aging, environmental degradation, and inequality (racial or gender).
Cause preference change
This year we asked respondents whether they prioritize a different cause now to when they first became involved with EA. Of the 1,944 who answered this question, 42% had changed their cause area focus.
Those who changed cause had been in EA on average 3.6 years, compared to 3.2 years for those who didn’t change. Compared to those who didn’t change, those who changed cause are 4 years younger or were 4 years younger when they joined EA (see table below).[7] Most EAs did not change cause area irrespective of the year they joined.[8]
784 respondents detailed what cause they originally prioritised that is different from what they now prioritize. The most common cause that a respondent reported changing from was Global Poverty (57% of hand-coded responses), followed by Climate Change (11%). The question did not ask respondents to specify which cause they prioritise today (though some did write this). In our data, there are two potential ways to see how respondents’ cause preferences have changed: comparing to “top priority” causes or comparing to the forced choice cause selection. Analyzing this data and respondents’ current cause preferences appears to confirm a previously identified trend of EAs moving away from Global Poverty and towards AI.
In the first approach, we compare reported past focus area to the cause that was given “top priority” in the scaled question (excluding 16.5% who gave more than one top priority). 572 (71%) of the 810 who reported changing their cause also gave only one top priority cause and reported in detail their previous top cause. The picture is mainly one of those entering EA prioritizing Global Poverty and then spreading out to one of the other cause areas in a rather diffuse manner. Reducing risks from AI is the most common top priority today, but by no means the majority, among those who prioritized Global Poverty or Animal Welfare when they joined EA. Due to the low number of respondents who selected many of the other fine-grained cause options as their previous focus area, many are bunched together in the ribbon plot below as “all other causes”.
In the second approach, we look at the forced choice questions. Note this does not necessarily reflect what a given respondent does prioritize now, but only what they would if forced to pick one from the given list. 84% of those who chose Global Poverty in the forced choice question had not changed cause area at all. A majority of those who chose Long Term Future (55%) or Meta (65%) for the forced choice question have changed cause since they joined. 53% of those who changed cause chose LTF in the forced choice question and among the causes EAs prioritised when they joined, pluralities chose LTF when forced. Due to the low number of respondents who selected many of the fine-grained cause options, many are bunched together in the ribbon plot below as “all other causes”.
The survey included a question asking EAs to report their level of engagement in EA on a scale of No Engagement to High Engagement.[9] Those who claim to be highly engaged in EA appear more likely to have switched causes than those less engaged, and members of the EA groups we asked about tend to report higher rates of cause changing than non-members.[10]
Group membership
We examined differences in cause prioritization across various different groups within our sample. Overall, a greater preference for typical longtermist causes and weaker preference for Global Poverty and Climate Change appears among respondents with indicators of being more involved in EA. We attempt to control for confounders in the regressions in the Predictors section below, which are often more sensitive than simple bivariate tests (lumping the data into groups and testing the difference in means).
Given that the EA Survey appears to receive responses from a fairly large number of people who are fairly new to the movement and/or not involved in many core EA groups or activities, we again think it is interesting to examine the responses of a narrower population who were plausibly more actively engaged and informed in core EA discussions. It is important to note that the EA population likely covers a much wider range of people than these highly engaged EAs.
Converting each of these options into a numerical point on a five point scale (ranging from (1) ‘I do not think any resources should be devoted to this cause’, to (5) ‘This cause should be the top priority’),[11] based on our findings last year, we expected to see members of LessWrong and the EA Forum to rank AI Risk highly and Global Poverty and Climate Change low and to do so more than non-members. Indeed, in the table below we do see this trend, with the causes receiving the highest rating per group highlighted in dark green, and the cause a group gave the lowest rating to highlighted in dark red. EAs who are not members of any of the groups (LessWrong, EA Forum, EA Facebook, GWWC, Local EA group) give a higher rating to Climate Change and Global Poverty than group members. We again see a similar pattern between EA Forum members and the broader population of the EA Facebook group, the latter of which comprised ~50% of the sample and are less associated with in-depth, advanced content than the EA Forum.
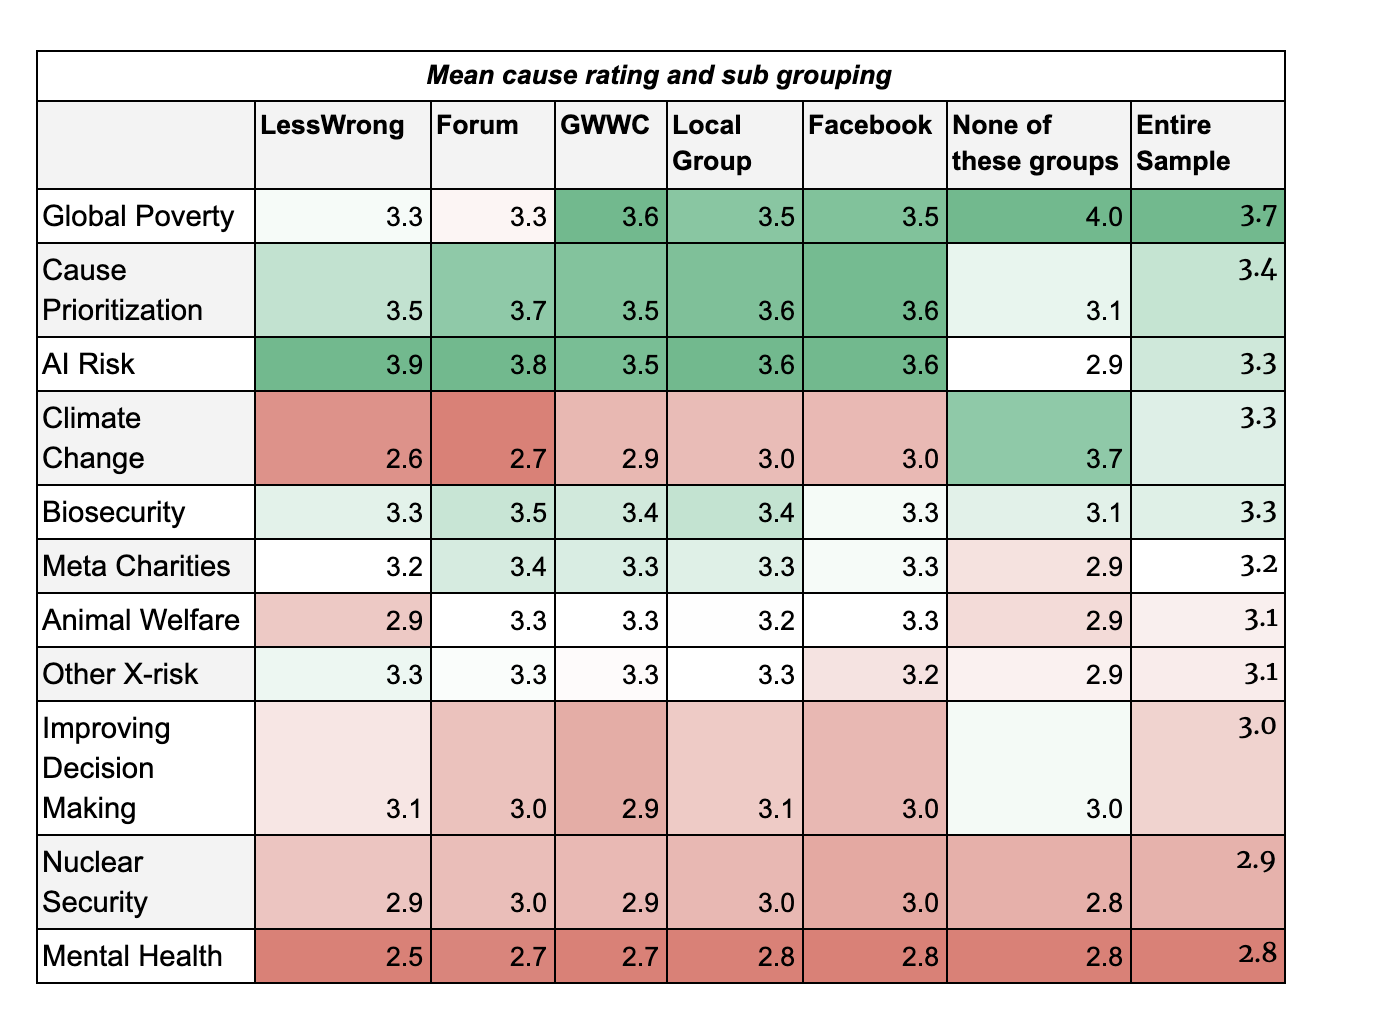
We can also see that members of the groups highlighted above favour LTF more than the EA survey population as a whole, and more than those who are not members of any of those groups. We return to the significance of group membership in the associations section below.
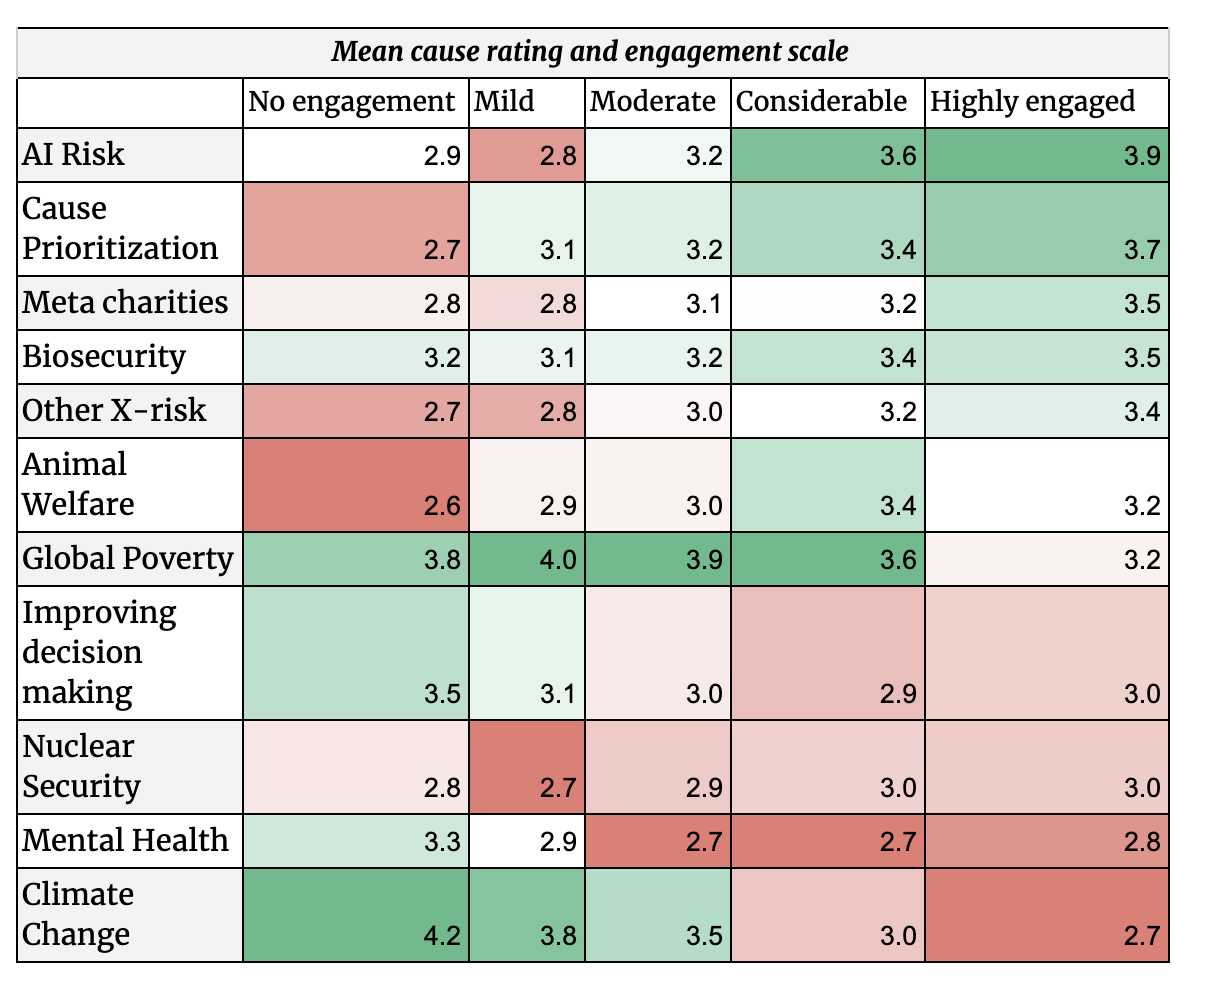
Mirroring this, we see that those who rated themselves as highly engaged give higher mean ratings to causes typically considered longtermist/X-risk and those with self-reported lower engagement give these causes lower priority. It is interesting to note that “No engagement” EAs appear to be more favourable towards LTF than mild or moderately engaged EAs but report among the lowest mean rankings of fine-grained causes typically associated with LTF such as AI risk.
Those claiming to be veg*n (vegetarian or vegan) appear to prioritize Animal Welfare more than meat eaters, and other groups.[12] Men appear to lean more towards Other X-risks and AI Risk than women, and women tend to lean more towards Global Poverty, Mental Health, Animal Welfare, and Climate Change.[13] The figure below shows the difference between male and female in the average mean cause ratings. Men also appear to skew more towards LTF when forced to choose while a plurality of women chose Global Poverty.[14]
Predictors
Controlling for possible confounders we have highlighted above independently in the descriptives is an important way to reduce the chance of drawing too large an inference from any one finding. Like last year, we performed regressions to tease out any associations suggested by descriptive analysis. We did not have reasons to employ a very different model to the one used in 2018 so we mostly replicate it,[15] despite the low amount of variance that it explains (2% to 15%) and problems of multicollinearity between many hypothesized predictors. More details on the models and analysis we use can be found here. We think these stand mostly as an important reminder that cause prioritization is a multifaceted concept that can not be boiled down simply to membership of a certain group.
There appears to be a general trend in the data of a greater preference for AI Risk/LTF causes and a lesser preference for Global Poverty and Climate Change across LessWrong members, EA Forum members, and those with 80,000 Hours coaching. However, even in many cases of statistically surprising associations, the confidence intervals around these effects span a range of both plausibly substantial and practically insignificant values. It may be tempting to interpret the data below as representing a general trend for EAs to shift in the direction of AI Risk/LTF, and away from Global Poverty and Climate Change the more involved in EA discussions (online) they become. However, this interpretation should, of course, be heavily caveated given its post hoc nature and the weakness of the model overall.
Associations with fine-grained cause areas
Running ordinal regressions on the five-point scales for each cause area points towards many of the same associations as in 2018. These models explained only 2-11% of variance. It seemed very likely that at least some variables in the models would violate the proportional odds assumption, meaning the strength of any associations would vary across the cause rating scale. It was not possible to identify which variables violated this assumption or run an auto-fitted model which relaxed this assumption appropriately. We therefore can only report the results of a constrained model which likely overestimates the consistency of any associational strength. This is in addition to issues of multicollinearity that tend to inflate estimates.
How substantial are these (likely overestimated) associations? We highlight here only the largest detected effects in our data (odds ratio close to or above 2 times greater) that would be surprising to see, if there were no associations in reality and we accepted being wrong 5% of the time in the long run.
For a member of LessWrong, the odds of giving AI risk top priority versus the combined lower priority categories are 2.5 times greater (95% confidence interval: 1.8 − 3.4) than for non-members, given that all of the other variables in the model are held constant. Members of LessWrong are also 2 times (1.5- 2.8) more likely to put Global poverty in a lower category than non members. EA Forum members are 2 times (1.5- 2.7) less likely to prioritise Global Poverty than non members. Those getting into EA via TLYCS are 2.3 (1.6 −3.4) times more likely to put Global Poverty in a higher category and 2.2 (1.5 − 3.2) times more likely to rank Animal Welfare highly, than those not getting into EA this way. Those who got into EA via 80,000 Hours are 1.9 times (1.5 − 2.4) more likely to prioritize AI. Those not on the Left or Centre Left are 2.8 times (2.1 − 3.8) less likely to prioritize Climate Change and males are 1.9 times (1.5 − 2.4) less likely to prioritize Climate Change. Veg*ns are 7 times(5.5. − 9) more likely to prioritize Animal Welfare.
Associations with forced choice causes
We also sought to see if these same associations appeared in the forced choice cause data. The multinomial regression of the data points to some associations that would be surprising, if we assumed there was no relationship in reality and accepted being wrong only 5% of the time in the long run. However, the model explains only ~15% of the variation in cause selection. Note that the substantive association of most of these factors on the probability of choosing a certain cause category are quite small. We here highlight just the largest average marginal effects.
A LessWrong member’s probability of choosing the Long Term Future is 19.8 percentage points higher (95% confidence interval: 13-27 percentage points) than a non-member.Having done 80,000 Hours coaching is associated with a 15 percentage points (7-23) higher probability in choosing LTF. Being a member of the EA Forum or LessWrong are associated with a 17 percentage points (9-26) decrease in the probability of choosing Global Poverty. Becoming involved in EA via GWWC or TLYCS are positively associated with choosing Global Poverty (10 percentage points (5-15), 16 percentage points (7-25)). TYLCS is also associated with a 13 percentage points (3-23) lower probability of choosing Meta. Finally, being veg*n is associated with a 32 percentage points (24-41) increase in choosing Animal Welfare/Rights, and 17 percentage points (12-22) lower probability of choosing Global Poverty. Most other factors are associated with effects that are either substantially or statistically insignificant, or both.
Multiple Correspondence Analysis
We used multiple correspondence analysis to look for patterns in cause prioritization.[16] In general, activity, organization membership and involvement were most strongly associated with which causes individuals prioritized. We started with a feature set that included variables related to being involved, membership, field of study, activity, self-identified engagement and identifiers such as gender, education level, politics and whether an individual was a student. We removed the “Other” category of cause prioritization because of the low response rate, respondents that provided the “not considered/not sure” option for any cause and respondents with NAs in any of the predictor variables. In addition, we removed the “Other” category of membership because a small number of respondents (the Dank_memes group) had an overwhelming effect on the analysis. Our final sample size was 1,307 respondents. We created a combined cause ranking of three levels (top, medium, and low) for each cause.
The resulting analysis explained about 14% of the variance in the first 2 dimensions, which is a typical amount for this type of multivariate analysis. An examination of the most influential factors indicated that those related to activity were predominant.
For a typical priority of AI Risk, we see that top ranking of this cause is related to high levels of activity in the EA community (where variation along the first axis is most important).
We attempted to gain some greater insight by using the self-reported EA engagement scale as a proxy for activity. With the activity variables removed, the analysis explained about 11% of the variation. Important explanatory variables were related to membership, involvement and diet.
However, the basic pattern of degree of involvement in the EA community as a predictor of ranking of AI Risk vs Climate Change did not alter.
The ranking of Global Poverty was similar to Climate Change in its correlation with less involvement in the EA community (not shown), while that of Cause Prioritization, Meta, and other existential risks (not shown) were similar to AI Risk (below).
In addition, Animal Welfare was higher ranked by active members in the EA community than less active members, and was further related to dietary choices
Predictors of all other causes were quite poorly resolved by this analysis.
Credits
The annual EA Survey is a project of Rethink Charity with analysis and commentary from researchers at Rethink Priorities.
This essay was written by Neil Dullaghan with contributions from Kim Cuddington. Thanks to David Moss and Peter Hurford for comments.
If you like our work, please consider subscribing to our newsletter. You can see all our work to date here.
Other articles in the EA Survey 2019 Series can be found here
Appendix
Respondents were asked to indicate how far they prioritised a range of fine-grained cause areas from the following options:
This cause should be the top priority (Please choose one)
This cause should be a near-top priority
This cause deserves significant resources but less than the top priorities
I do not think this is a priority, but should receive some resources
I do not think any resources should be devoted to this cause
Not considered / Not sure
2,033 out of 2,513 (81%) self-identified EAs in our sample gave a response regarding at least one cause area. This question was a multi-select question which allowed respondents to select multiple top causes (though included a prompt to limit this somewhat). In our analyzes below we exclude “Not considered/Not sure” responses.
In this year’s survey we added a question that asked respondents to pick only one top cause from among the traditional broader division between EA cause areas:
Global Poverty
Animal Welfare
Meta
Long Term Future / Catastrophic and Existential Risk Reduction
Other
2,024 out of 2,513 (81%) respondents gave an answer to this forced choice question, including 99% of those who answered the previous question.
We also asked When you first became involved with EA, was the cause area you most prioritized different from the one you do now? If so, which was it? 1,944 (77%) respondents selected one of the two choices:
I most prioritized the same cause that I do now
I most prioritized a different cause (please specify which)
- ↩︎
The percentages in the graph differ very slightly from the previous one because any response for one of the long term future causes was treated as a single response, so the total number of “top priority” responses is lower.
- ↩︎
490 respondents did not offer a response to the forced choice question, but they also mostly did not offer a top priority in the multiple cause question.
- ↩︎
It should be kept in mind that EAs could select multiple top priority causes in the first instance so there is some double-counting at work here. For example, an individual could have rated both AI Risk and Nuclear Security as “top priorities” and when forced to pick only one opted for LTF, meaning there are two datapoints leading to LTF. However, this only affects the aesthetic of the ribbon plot and not the overall trends.
- ↩︎
We omitted those who responded “Not Sure/Not Considered”
- ↩︎
Note that that there are some concerns expressed in the comments section of that post that this survey did not contain a representative sample of EA leaders.Also it asked “What (rough) percentage of resources should the EA community devote to the following areas over the next five years?”
- ↩︎
Their cause are of “Navigating emerging technologies” highlights advanced artificial intelligence and synthetic biology, and their “Research and capacity building” section highlights “improving institutional decision making and building the ‘effective altruism’ community. While their latest “Our list of urgent global problems” page highlights AI Risk and Biosecurity at the top, but also Nuclear Security and Climate Change.
- ↩︎
Logistic regressions of each age or years in EA factor against changing causes suggests a 13% increase in the probability of having a different cause for each year in EA, and roughly 10% increase for being 10 years older, or 10 years older when you joined EA. The nominal (“uncorrected”) p-values were 0.004, 0.0001, 0.0001 respectively, but these have not been “corrected” for multiple-hypothesis testing.
- ↩︎
Except those in 2011 and 2014 (52% and 50% changed respectively), however the differences are quite small and there were very EAs from these years too.
- ↩︎
(1) No engagement: I’ve heard of effective altruism, but do not engage with effective altruism content or ideas at all
(2) Mild engagement: I’ve engaged with a few articles, videos, podcasts, discussions, events on effective altruism (e.g. reading Doing Good Better or spending ~5 hours on the website of 80,000 Hours)
(3) Moderate engagement: I’ve engaged with multiple articles, videos, podcasts, discussions, or events on effective altruism (e.g. subscribing to the 80,000 Hours podcast or attending regular events at a local group). I sometimes consider the principles of effective altruism when I make decisions about my career or charitable donations.
(4) Considerable engagement: I’ve engaged extensively with effective altruism content (e.g. attending an EA Global conference, applying for career coaching, or organizing an EA meetup). I often consider the principles of effective altruism when I make decisions about my career or charitable donations.
(5) High engagement: I am heavily involved in the effective altruism community, perhaps helping to lead an EA group or working at an EA-aligned organization. I make heavy use of the principles of effective altruism when I make decisions about my career or charitable donations. - ↩︎
A simple logistic regression suggests those in higher engagement levels are 1.9 times (95% CIs: 1.8 −2.1) more likely to have changed cause those those in the lower levels of engagement combined (p<0.0001). Chi-squared tests for each group suggests that we can act as if group membership and cause preference changing are not independent and not be wrong more than 5% of the time in the long run, assuming a null hypothesis that there is no association. Chi-squared is an omnibus test and only tells us something is surprising in the data, but not what is driving this surprise.
- ↩︎
We recognise that the mean of a Likert scale as a measure of central tendency has limited meaning in interpretation.Though imperfect it’s unclear that reporting the means is a worse solution than other options the team discussed.
- ↩︎
Both Welch t-test and Kruskal–Wallis tests found a surprising result (p-value<0.0001)
- ↩︎
Welch t-tests of gender against these scaled cause ratings have p-values of 0.003 or lower, so we can act as if the null hypothesis of no difference between genders is false, and we would not be wrong more than 5% of the time in the long run. It should be noted that this is not an ideal significance test for ordinal data, Kruskal–Wallis tests suggest significant associations for these same causes of p-values of 0.002 or lower.
- ↩︎
A chi-squared test suggests a surprising association Pearson chi2(4) = 14.6545 Pr = 0.005
- ↩︎
We include the data from this year’s question self-reported engagement in EA, and omit the subject studied data due to concerns that any selections would be due to cherry-picking or some other bias.
- ↩︎
Kim Cuddington performed the analysis and writing for this section.
- CEA will continue to take a “principles-first” approach to EA by (Aug 20, 2024, 11:15 AM; 356 points)
- Rethink Priorities 2020 Impact and 2021 Strategy by (Nov 25, 2020, 1:28 PM; 118 points)
- EA Survey 2020: Cause Prioritization by (Jul 29, 2021, 6:06 PM; 100 points)
- Re-Launching Giving Green: an EA-run organization directing dollars towards impactful work in climate change by (Nov 17, 2020, 7:06 PM; 80 points)
- EA is becoming increasingly inaccessible, at the worst possible time by (Jul 22, 2022, 3:40 PM; 78 points)
- EA Survey 2019 Series: Community Demographics & Characteristics by (Dec 5, 2019, 8:25 PM; 75 points)
- What are the key ongoing debates in EA? by (Mar 8, 2020, 4:12 PM; 74 points)
- EA Survey 2019 Series: Donation Data by (Feb 13, 2020, 9:58 PM; 51 points)
- 's comment on New data suggests the ‘leaders’’ priorities represent the core of the community by (May 12, 2020, 11:47 AM; 49 points)
- EA Survey 2019 Series: Careers and Skills by (Jan 7, 2020, 9:13 PM; 46 points)
- EA Updates for January 2020 by (Jan 30, 2020, 6:38 PM; 44 points)
- EA Survey 2019 Series: Geographic Distribution of EAs by (Jan 22, 2020, 2:44 PM; 43 points)
- [Notes] Could climate change make Earth uninhabitable for humans? by (Jan 14, 2020, 10:13 PM; 40 points)
- Climate Change Is Neglected By EA by (May 23, 2020, 7:16 PM; 37 points)
- EA in Germany: Insights about local groups by (Aug 1, 2020, 10:34 AM; 33 points)
- New skilled volunteering board for effective animal advocacy by (Jun 18, 2021, 12:27 PM; 31 points)
- EA Organization Updates: December 2019 by (Jan 16, 2020, 11:47 AM; 27 points)
- Utilizing global attention during crises for EA causes by (Mar 18, 2020, 8:49 AM; 26 points)
- What should EAs interested in climate change do? by (Jan 10, 2020, 5:34 PM; 25 points)
- 's comment on Can we drive development at scale? An interim update on economic growth work by (Oct 28, 2020, 9:49 AM; 23 points)
- Survey-Proposal: Cause-Area Switching by (Aug 6, 2021, 2:23 AM; 18 points)
- 's comment on Launching a new resource: ‘Effective Altruism: An Introduction’ by (Apr 17, 2021, 8:34 AM; 18 points)
- 's comment on Deference Culture in EA by (Jun 7, 2022, 5:01 PM; 15 points)
- Giving Green: An early investigation into the impact of insider and outsider policy advocacy on climate change by (Aug 30, 2021, 10:34 PM; 14 points)
- 's comment on Why Hasn’t Effective Altruism Grown Since 2015? by (Mar 10, 2021, 7:46 PM; 11 points)
- 's comment on Some thoughts on deference and inside-view models by (Jun 3, 2020, 10:59 AM; 8 points)
- 's comment on Response to recent criticisms of EA “longtermist” thinking by (Jan 6, 2020, 6:49 AM; 8 points)
- 's comment on EA Survey 2024: How People Get Involved in EA by (Mar 24, 2025, 9:47 PM; 8 points)
- 's comment on Research into people’s willingness to change cause *areas*? by (Jul 29, 2021, 5:47 PM; 3 points)
- 's comment on New data suggests the ‘leaders’’ priorities represent the core of the community by (May 14, 2020, 10:24 AM; 2 points)
- 's comment on What should EAs interested in climate change do? by (Jan 13, 2020, 5:31 PM; 1 point)
Good work. A minor point:
I don’t think the riders when discussing significant results along the lines of “being wrong 5% of the time in the long run” sometimes doesn’t make sense. Compare
To:
Although commonly the significance threshold is equated with the ‘type 1 error rate’ which in turn is equated with ‘the chance of falsely rejecting the null hypothesis’, this is mistaken (1). P values are not estimates of the likelihood of the null hypothesis, but of the observation (as or more extreme) conditioned on that hypothesis. P(Null|significant result) needs one to specify the prior. Likewise, T1 errors are best thought of as the ‘risk’ of the test giving the wrong indication, rather than the risk of you making the wrong judgement. (There’s also some remarks on family-wise versus false discovery rates which can be neglected.)
So the first quote is sort-of right (although assuming the null then talking about the probability of being wrong may confuse rather than clarify), but the second one isn’t: you may (following standard statistical practice) reject the null hypothesis given P < 0.05, but this doesn’t tell you there is a 5% chance of the null being true when you do so.
Hi, thanks.
I agree that “If I have observed a p < .05, what is the probability that the null hypothesis is true?” is a different question than “If the null hypothesis is true, what is the probability of observing this (or more extreme) data”. Only the latter question is answered by a p-value (the former needing some bayesian-style subjective prior). I haven’t yet seen a clear consensus on how to report this in a way that is easy for the lay reader.
The phrases I employed (highlighted in your comment) were suggested in writing by Daniel Lakens, although I added a caveat about the null in the second quote which is perhaps incorrect. His defence of the phrase “we can act as if the null hypothesis is false, and we would not be wrong more than 5% of the time in the long run” is the specific use of the word ‘act’, “which does not imply anything about whether this specific hypothesis is true or false, but merely states that if we act as if the null-hypothesis is false any time we observe p < alpha, we will not make an error more than alpha percent of the time”. I would be very interested if you have suggestions of a similar standard phrasing which captures both the probability of observing data (not a hypothesis) and is somewhat easy for a non-stats reader to grasp.
As an aside, what is your opinion on reporting p values greater than the relevant alpha level? I’ve read Daniel Lakens suggesting if you have p< .05 one could write something like “because given our sample size of 50 per group, and our alpha level of 0.05, only observed differences more extreme than 0.4 could be statistically significant, and our observed mean difference was 0.35, we could not reject the null hypothesis’.” This seems a bit wordy for any lay reader but would it be worth even including in a footnote?
It was commendable to seek advice, but I fear in this case the recommendation you got doesn’t hit the mark.
I don’t see the use of ‘act (as if)’ as helping much. Firstly, it is not clear what it means to be ‘wrong about’ ‘acting as if the null hypothesis is false’, but I don’t think however one cashes this out it avoids the problem of the absent prior. Even if we say “We will follow the policy of rejecting the null whenever p < alpha”, knowing the error rate of this policy overall still demands a ‘grand prior’ of something like “how likely is a given (/randomly selected?) null hypothesis we are considering to be true?”
Perhaps what Lakens has in mind is as we expand the set of null hypothesis we are testing to some very large set the prior becomes maximally uninformative (and so alpha converges to the significance threshold), but this is deeply uncertain to me—and, besides, we want to know (and a reader might reasonably interpret the rider as being about) the likelihood of this policy getting the wrong result for the particular null hypothesis under discussion.
--
As I fear this thread demonstrates, p values are a subject which tends to get more opaque the more one tries to make them clear (only typically rivalled by ‘confidence interval’). They’re also generally much lower yield than most other bits of statistical information (i.e. we generally care a lot more about narrowing down the universe of possible hypotheses by effect size etc. rather than simply excluding one). The write-up should be welcomed for providing higher yield bits of information (e.g. effect sizes with CIs, regression coefficients, etc.) where it can.
Most statistical work never bothers to crisply explain exactly what it means by ‘significantly different (P = 0.03)’ or similar, and I think it is defensible to leave it at that rather than wading into the treacherous territory of trying to give a clear explanation (notwithstanding the fact the typical reader will misunderstand what this means). My attempt would be not to provide an ‘in-line explanation’, but offer an explanatory footnote (maybe after the first p value), something like this:
Thanks for this!
To clarify, this refers to those who actually changed causes, specifically, right?
For the “Mean cause rating and sub grouping” table, it would be helpful to have the total ratings too, for comparison, so we can see how veg*ns, meat eaters, men and women differ from the average.
Hi,
On your first point, yes you are correct. Among those who prioritized Global Poverty OR Animal Welfare AND changed causes, pluralities of them changed to AI.
On your second point, I’ve now added a column in the group membership and demographics tables that shows the average for the sample as a whole. I hope this helps.
Thanks!
Thanks for this. I like the ribbon plots!
Did you by chance look at cause prio differences between countries and saw anything interesting? I dimly remember there used to be a trend along the lines of a bit more animal welfare in continental Europe, global poverty in UK and x-risk in the US.
Hi, thanks! We will explore cause prioritization and the geographic distribution of EAs in a forthcoming post. We tried to keep a narrower focus in this post, on involvement in EA and just a few demographics, as we did in last year’s post.