GWWC Reporting Attrition Visualization
A few weeks ago Giving What We Can published their impact evaluation. As an organization that supports people in making long term altruistic commitments, the question of how much people stick to those commitments is pretty important. We don’t know what people are actually doing, but whether they’re reporting donations to GWWC is a decent proxy, and the evaluation includes a table of how many members were still reporting donations:
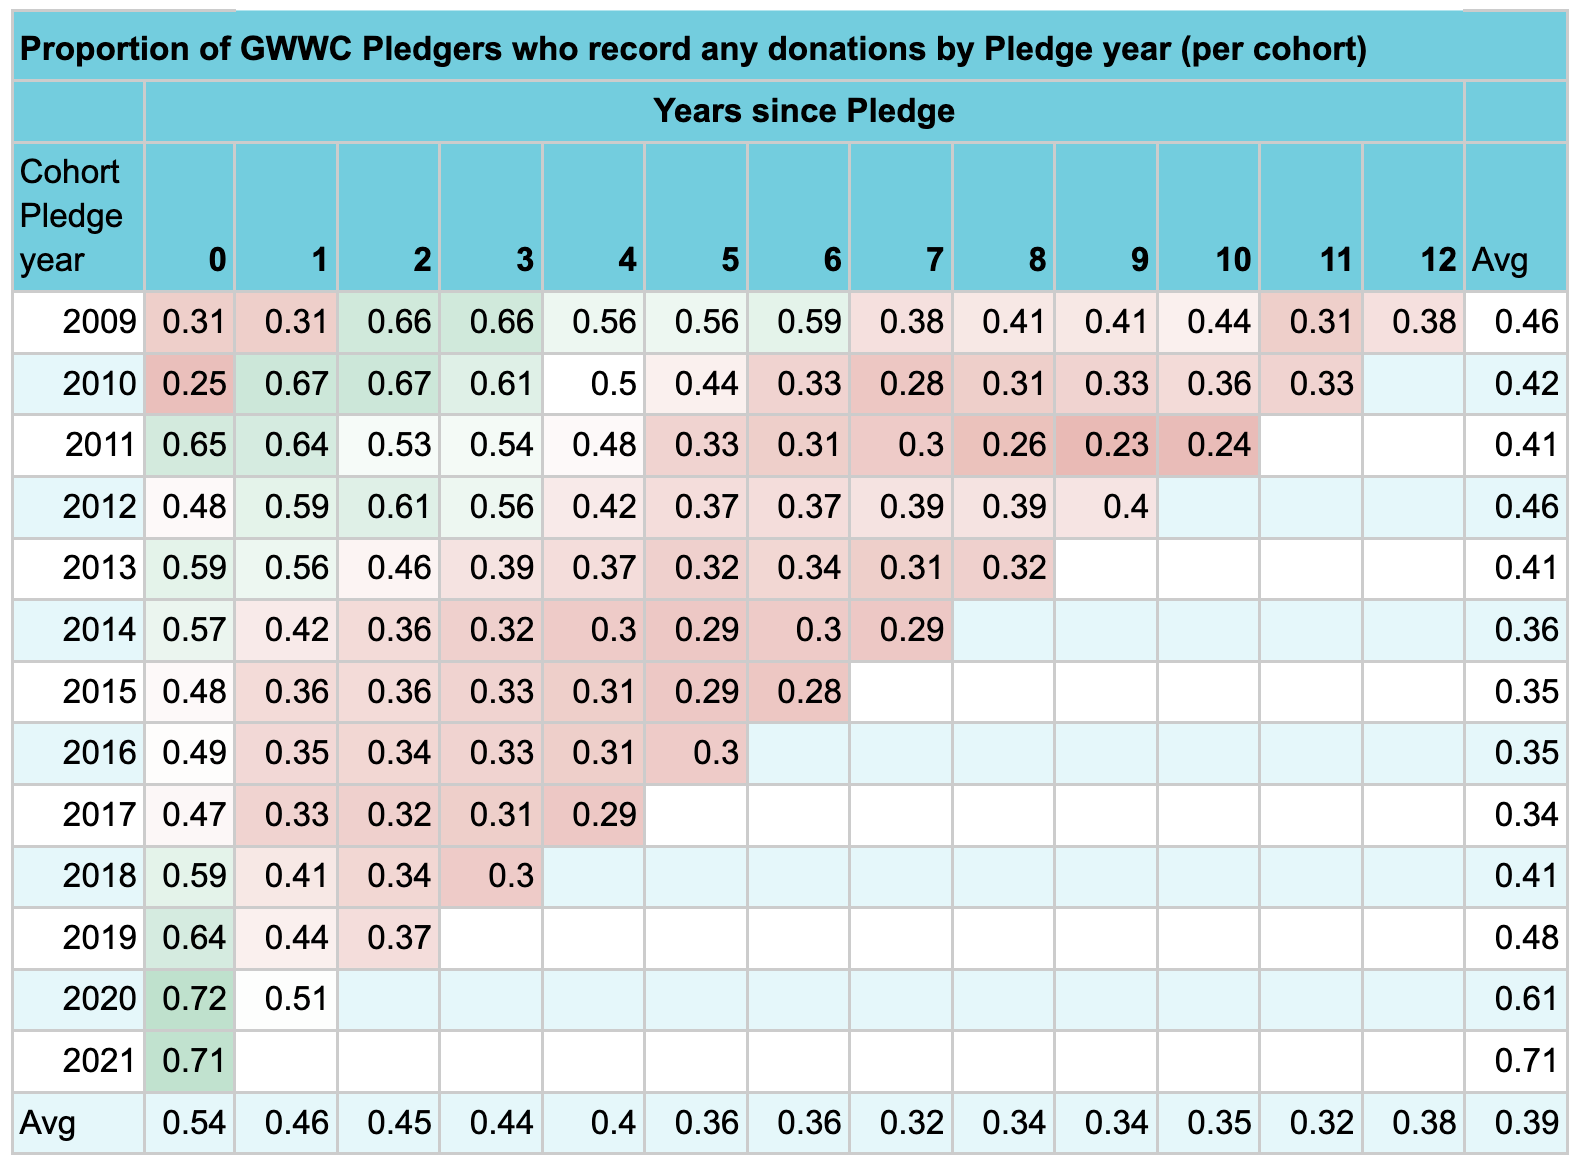
This is interesting data, but I found it a bit hard to think about. I tried a few ways of visualizing it, and made a pair of charts:
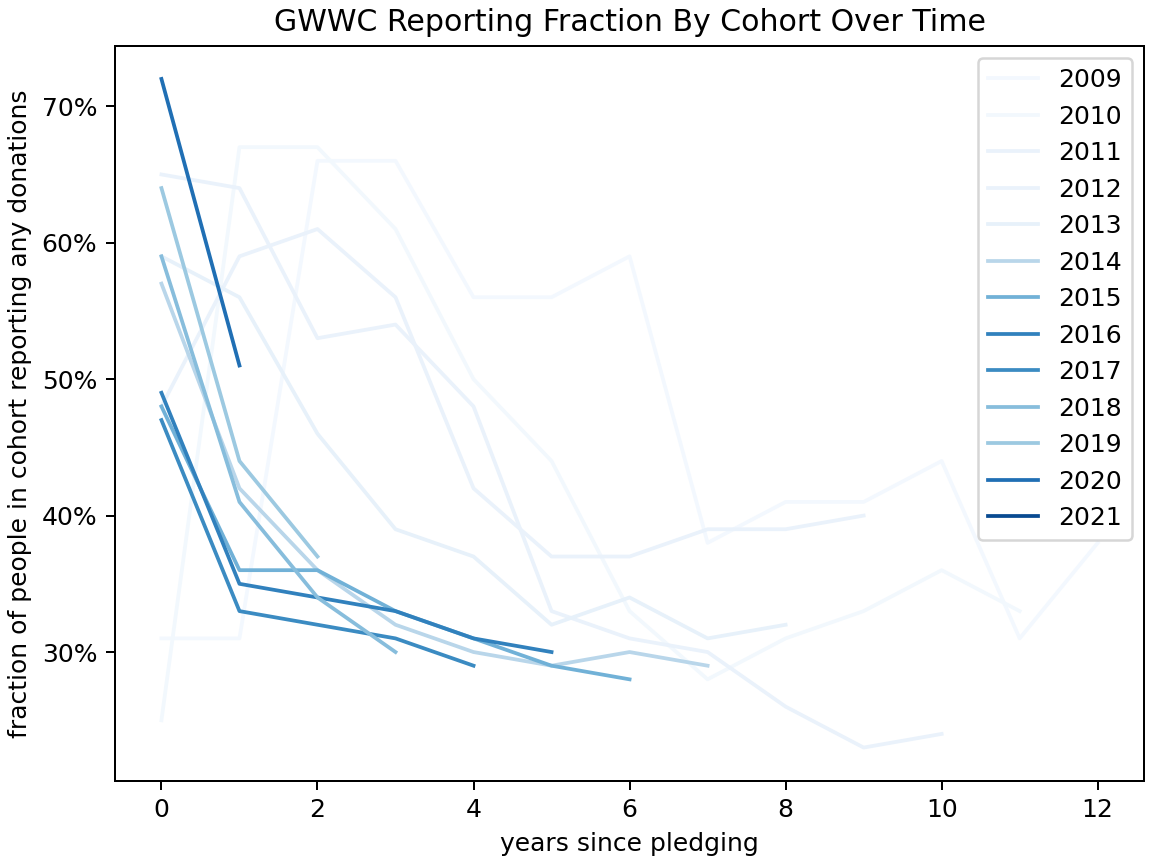
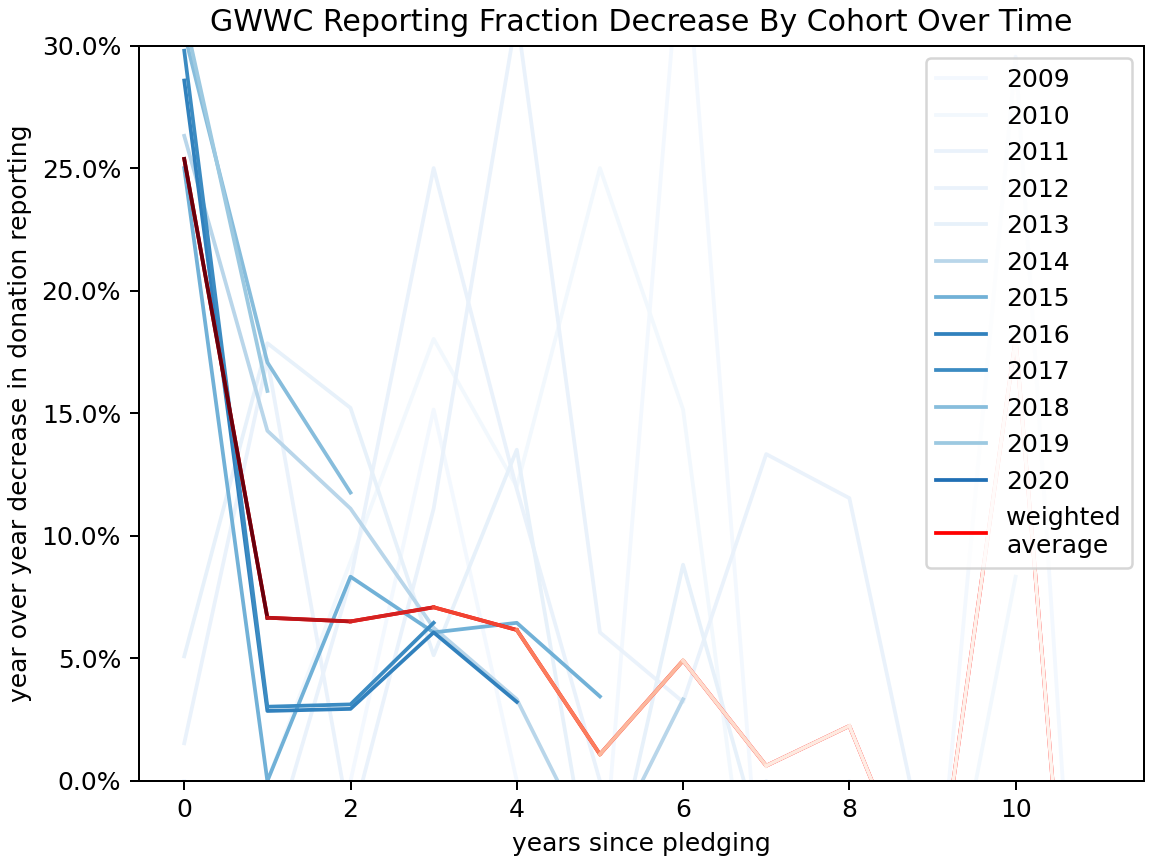
I colored each line with an intensity proportional to the number of people in the cohort, since that represents how much information it represents. The weighted average line fades out over time as it represents progressively fewer members.
Some thoughts, looking at the charts:
Later cohorts, starting around 2015, fall off faster than earlier cohorts.
Reporting attrition is quite sharp at first, and then slows down, but it doesn’t go to zero.
After the initial attrition it seems to end up around 2-6% annually, though this depends a lot on where you see “initial attrition” ending.
There’s probably some sort of effect of the calendar year (“how hard did GWWC push people to report donations”) and I haven’t looked at this.
Disclosure: my wife used to be President of GWWC. I haven’t run this post by her and I don’t know her views here. I shared a draft of with GWWC before posting.
As a datapoint—I haven’t got round to reporting my donations for a few years.
Yeah, I also don’t report despite continuing to make my pledge donations. It doesn’t feel like a core part of the pledge to me.
Same, I also decided my comparative advantage isn’t to give to registered charities but to more idiosyncratic one-off stuff (though this isn’t always enough to add up to 10%)
I mean, reporting isn’t (and hasn’t been) part of the pledge while giving is, so that makes sense!
I have also barely reported, despite keeping the pledge for 10 years. Will finally get my reckoning with missing out on the pin though...
Thanks for writing this! I’ve been wondering about these numbers for a while, and it’s nice to see that retention is higher than I feared (for such a weighty commitment w/no serious enforcement).
This is also a good reminder for me to update the last few years of my GWWC records next time I donate, since I’ve become part of the problem :-(
It’s interesting that the year 0 reporting rate has changed so much recently. I wonder if there is less focus on students?
I think it’s also that more people report by default in year 0 because more new pledgers use the donation platform (thus reporting donations automatically) rather than doing manual reporting.
Makes sense, good point!
Eyeballing the chart, it seems like more than a “years since pledge” dependence, there’s a “actual year” dependence independent of the pledge year, at least after year 0. The most stark change is from 2010 to 2011, when reporting rates increased significantly for both of the first two cohorts. I’m guessing that this is due to some technicality rather than an actual behavior change. There also seems to be a significant decay across all cohorts from 2015 to 2016 that would likely be even more obvious if plotted. Maybe this also has a boring explanation, or maybe it has to do with identifiable events in 2016.