A critical review of GiveWell’s 2022 cost-effectiveness model
Section 1 – Introduction
1.1 Summary
This is an entry into the ‘Effective Altruism Red Teaming Contest’ – it looks critically at GiveWell’s current cost-effectiveness model. The goal of the essay is to change GiveWell’s mind about the appropriateness of specific features of their cost-effectiveness model. However, I have tried to avoid writing an exhaustive point-by-point deconstruction of GiveWell’s model and instead tried to shine a light on common ‘blind spots’ that frequently occur in economic modelling and which the EA community has apparently not error-corrected until this point. In that respect a secondary goal of the essay is to be more broadly applicable and change the EA community’s view about what the gold-standard in economic evaluation looks like and help provide a framework for error-correcting future economic models.
This contributes to a larger strategic ambition I think EA should have, which is improving modelling capacity to the point where economic models can be used as reliable guides to action. Economic models are the most transparent and flexible framework we have invented for difficult decisions taken under resource constraint (and uncertainty), and in utilitarian frameworks a cost-effectiveness model is an argument in its own right (and debatably the only kind of argument that has real meaning in this framework). Despite this, EA appears much more bearish on the use of economic models than sister disciplines such as Health Economics. My conclusion in this piece is that there scope for a paradigm shift in EA modelling before which will improve decision-making around contentious issues.
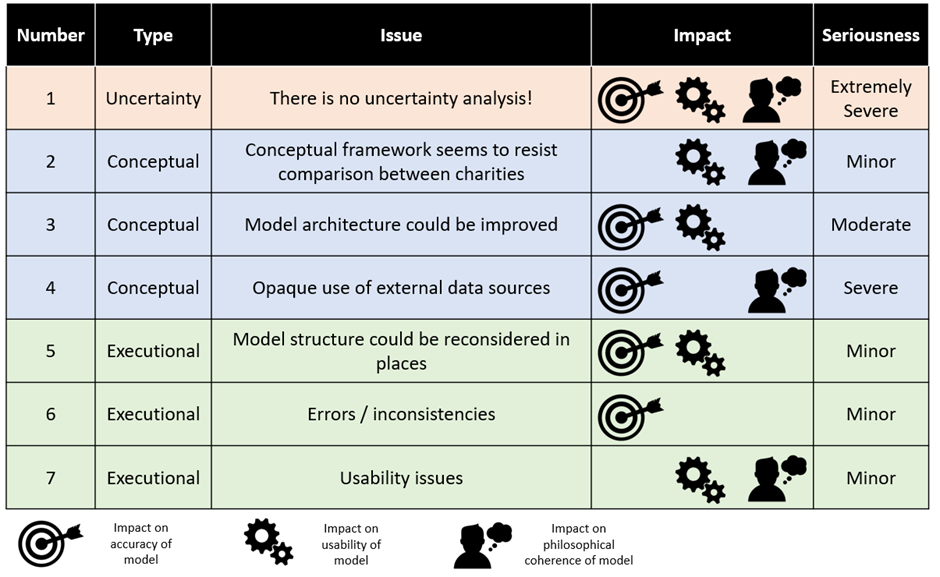
In general, GiveWell’s model is of very high quality. It has few errors, and almost no errors that substantially change conclusions. I would be delighted if professional modellers I work with had paid such care and attention to a piece of cost-effectiveness analysis. However, it has a number of ‘architectural’ features which could be improved with further effort. For example, the structure of the model is difficult to follow (and likely prone to error) and data sources are used in a way which appears inappropriate at times. A summary of the issues considered in this essay is presented below:

In my view, all of these issues except the issue of uncertainty analysis could be trivially fixed (trivial for people as intelligent as the GiveWell staff, anyway!). The issue of uncertainty analysis is much more serious; no attempt is made in the model to systematically investigate uncertainty and this potentially leads to the model being underutilised by GiveWell. This failure to conduct uncertainty analysis is not limited to GiveWell, but is instead low hanging fruit for greatly improving the impact of future cost-effectiveness modelling across the whole of EA. I will write an essay on this topic specifically in the very near-term future.
1.2 Context
This essay is an attempt to ‘red team’ the current state of cost-effectiveness modelling in Effective Altruism. I have done this by picking a cost-effectiveness model which I believe to be close to the current state-of-the-art in EA cost-effectiveness modelling – GiveWell’s 2022 cost-effectiveness analysis spreadsheet – and applied the same level of scrutiny I would as if I was peer reviewing an economic model in my own discipline of Health Economics. For various reasons I’ll address below, it was easier for me to give this critique after completely refactoring the original model, and therefore much of what follows is based on my own analysis of GiveWell’s input data. You might find it helpful to have my refactored version of the model open as a companion piece to this essay. If so, it is downloadable here – please note some fairly heavy caveats around completeness I make further down.
I’m a cost-effectiveness modeller for a large pharmaceutical company, and as such I was interested in exploring the red team contest from the perspective of my own paradigm, Health Economics. I see Health Economics and Effective Altruism as being sister disciplines, both concerned with maximising the good done with a fixed budget in different contexts. As a top-level view, the major difference between the two areas is that Health Economics is extremely adversarial by its nature; industry economists want to show their drugs are very cost-effective to get them approved for use by payers and regulatory economists want to show the opposite to extract price concessions from industry. As a result, Health Economics has evolved in a different way to Effective Altruism – almost all major philosophical disputes in Health Economics are resolved by fiat via a regulatory agency (“This is the value of a statistical life whether you like it or not”), and the energy of the entire quantitative side of the pharmaceutical industry has therefore gone into getting value-add from increasingly sophisticated economic models (rather than sophisticated philosophical accounts of health). My thinking in approaching this call for critique was that I could see whether advances in the cutting edge of Health Economics could improve the modelling approaches of Effective Altruists.
I hope this goes without saying, but this isn’t intended to be an attack on GiveWell’s modelling team. I have enormous respect for what the team has been able to achieve, and insofar as any of my criticisms land it is only because I get a huge advantage by cribbing from several decades of iterative improvements to Health Economic models which they don’t have access to. Given that the GiveWell team basically had to invent EA modelling from scratch, the fact they have produced something which can recognisably stand toe-to-toe with anything we’re currently doing in Health Economics is a credit to the organisation and wider EA community[1].
Section 2 – Methods
2.1 Choice of approach
There is no universally accepted method of offering a summary assessment of the quality of a cost-effectiveness model. However, most modellers would agree that if you want to move past summary assessments and genuinely certify a model as free of errors it is necessary to roll up your sleeves and go cell-by-cell through the model looking for trouble. Often the target of ‘completely free of errors’ is unnecessarily high, but since EA models are built on different principles to Health Economic models I thought gold-plating the review made sense in this case.
I’ve chosen to review the current GiveWell cost-effectiveness evaluation of its major charities. I think this is an appropriate choice for a couple of reasons:
Most people who I asked said that it represented close to the state of the art in EA cost-effectiveness modelling. Therefore, my working assumption is that issues in the GiveWell model will likely exist in other models.
Those who didn’t agree it was ‘state of the art’ were nevertheless happy to agree it represented one of the most visible examples of a high-quality piece of modelling in EA spaces. Therefore, I assume that processes of error correction and content aggregation which work in EA spaces will have worked particularly effectively on this model.
GiveWell are a large organisation in the EA space, and therefore critiquing their model feel less like I’m just dumping on one poor guy trying to contribute and more like I’m entering into the spirit of good-faith external critique of EA.
2.2 GiveWell model
The GiveWell cost-effectiveness model has been in continuous development since at least 2012 (the first available online copy), and reflects the decision problem facing Effective Altruists – “Which charity is the most cost-effective?”. The 2022 version covers nine target charities and looks at a variety of factors relating to their costs and effectiveness. The key output is ‘cost-effectiveness in multiples of GiveDirectly’s effectiveness’. This is obviously a non-standard reporting measure but it makes some sense in context; relative to other charities we know a lot about the effectiveness of Cash Transfer and therefore can use Cash Transfer charities as a sort of ‘standard candle’ against which to compare others (GiveWell ideally want charities they recommend to be 10x more effective than GiveDirectly). The key inputs are estimates for effectiveness of each intervention and estimates for the value of certain moral outcomes expressed as multiples of GiveDirectly outputs. For example, the GiveDirectly model assumes that raising ln(consumption) by one unit is morally equivalent to 40% of a saved life-year. In terms of structure, the model aggregates together key inputs for each charity before presenting a probable overall effectiveness estimate, as per the diagram below. In the jargon, it is a ‘deterministic decision tree’ architected in Microsoft Excel. GiveWell offer some more details about their philosophy of model building here.
Overall, the GiveWell model is broadly in a very good state (ignoring for the moment the issue of uncertainty analysis). However, there are quite a lot of potential improvements to what you would typically describe as ‘architecture’, which is to say how the logic of the model is laid out for an analyst to examine. I found that eventually these improvements were impossible to keep a track of on a piece of notepaper and it was quicker just to build my own model from scratch and keep track of them live in Excel. You might find it helpful to have my refactored version of the model open as a companion piece to this essay. If so, it is downloadable here. I hope that putting out my model to the same level of public scrutiny as the GiveWell model will make it clear quite how good a job the GiveWell team has done; I’d be astounded if my model has fewer mistakes than theirs, overall.
The table below shows the results of the Original GiveWell model and my own Refactored model. You can see that the Original model gives results which are pretty close to the Refactored model (always within +/- 35% except AMF which is discussed below). This is as strong as signal as you could possibly want that the GiveWell model reliably estimates the impact of donating to their top charities (except for AMF). Please be aware that New Incentives is missing from all subsequent analysis because I ran out of time to include it—it is nothing personal!
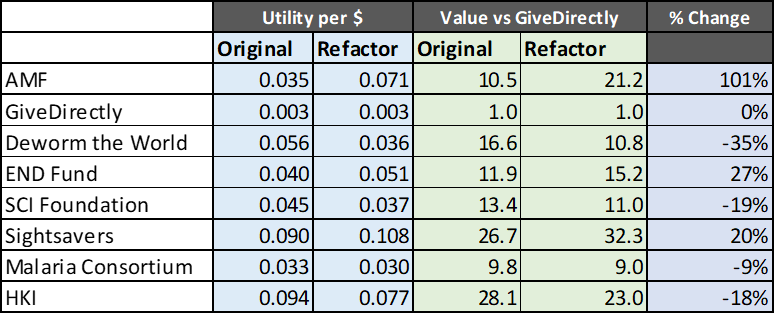
The key reason for the changes between versions of the model are:
There is a slight issue in the Original model with how expected future life years are calculated (they are discounted at too low a rate). Fixing this means that any intervention which saves lives will save a different number of discounted life-years in the Original and Refactored model.
The assumption of how income is aggregated across the household is different for different charities. In Cash Transfer charities it is assumed that the money from the cash transfer is divided across 4.7 members of a hypothetical household, whereas in the Deworming charities it is assumed that the money generated by the intervention is multiplied by two to account for resource-sharing within a household of any size. This seemed very inconsistent to me, so I normalised everything to Cash Transfer approach. This has a big impact on any intervention which generates consumption income.
There is a fairly serious error in the Original model where GiveWell assume that a malaria death prevented by Malaria Consortium also prevents 0.5 indirect deaths… and then forgets to apply this to AMF. Correcting this error greatly increases the cost-effectiveness of AMF, although in fairness to GiveWell it is not as easy to correct the error as I have pretended in my Refactored model (since it is almost certain I double count some lives saved)
In all probability there is more than one major error in my Refactored model – the Original model follows modelling best practice of having many eyes review the plausibility / logic of the work, whereas mine is banged together for the purpose of being easy to do uncertainty analysis with.
You can see that my analysis of GiveDirectly, which has none of these issues, is exactly the same as GiveWell’s analysis of the same charity, which is a reassuring sign that neither of us has done anything too exotic in our calculations.
I should comment here on a fifth possible change between models; I haven’t included Leverage / Funging adjustments as per the GiveWell model and instead just hard-coded GiveWell’s outputs here into my model.
‘Leverage’ is where donations to a charity cause others to spend more on that charity, and ‘funging’ is the opposite. This sort of development scenario planning is clearly important but is well outside my realm of expertise, so I can’t credibly comment on the logic of the GiveWell approach. Having said that, a topline examination of the model structure in this area has alarm bells blaring for me. For example, on the AMF tab, row 212 is hardcoded (which is almost always the sign of a development assumption accidentally pushed to production). Rows 204 to 208 are supposed to be the parameters which control the probability of different leverage / funging scenarios, but these parameters are not piped anywhere so they are either wrong or mislabelled. Row 220 is supposed to be the final calculation but cannot return a value greater than zero so forces a ‘funging’ return even if you want to explore ‘leveraging’ scenarios. There are similarly confusing elements relating to these calculations in most of the other tabs, although AMF is particularly hard to parse. For the sake of not overstepping my expertise I’ve just piped GiveWell’s conclusions straight into my model, but I would recommend GiveWell take another look at the model logic in this area.
2.3 Key findings 1 – Uncertainty analysis
My key finding actually didn’t require anything more than a completely superficial review of the GiveWell model. It is very striking to a Health Economist’s eyes that the GiveWell model significantly underutilised mathematical tools for uncertainty analysis (in fact, it doesn’t use any of them). This is a very significant oversight, since it means that GiveWell have no way of quantifying their risk of being wrong about the charities they recommend.
GiveWell isn’t alone here – aside from a few isolated examples of individual elements of the uncertainty analysis toolkit being used in a non-systematic fashion, the whole of EA tends to be quite weak on this topic. Unfortunately, it would double the length of this essay to even superficially touch on uncertainty analysis, so I will put that all into another essay which I’ll commit to publishing before the end of the Red Team contest. I really think this might be a metaphorical ‘hundred-dollar bill on the sidewalk’ for EA to pick up in respect to resolving some issues which appear to perennially crop up on the forums.
2.4 Key findings 2 – Everything else
Most of the rest of the GiveWell model is of a consistently high standard. Errors – such that they are – tend to relate more to missed opportunities to make the model more robust, or usable, or both. I’ve divided my critique into two sections; conceptual and executional. Conceptual issues are those which take place before anyone even puts metaphorical pen to metaphorical paper, and would probably require a complete refactoring of the model to implement. Executional issues relate more to on-the-ground decisions made by modellers, and could reasonably easily be changed in time for the 2023 version of the model.
The table below summarises the issues which I found with the model, and the two sections following go into detail on specific points.
Section 3 – Conceptual issue of model design
3.1 Conceptual framework
It is pretty clear that GiveWell and I disagree about the basic point of building a cost-effectiveness model. In my view, which I think it would probably be fair to say is the conventional view in Health Economics, the only purpose of a cost-effectiveness model is to compare alternate uses of the same funding. I doubt any Health Economist would disagree with GiveWell that it is nice to be able to see the absolute cost per [outcome] of an intervention, or to explore how different factors affect a programmes cost-effectiveness – but I’m equally confident that all Health Economists would agree that the only point to doing that stuff is because it helps sharpen the decision you make between competing alternative uses of scarce resources. Anything else is just academic pettifogging.
I’m not certain I can make legible all the ways that the GiveWell model appears to shy away from the sharpest possible use of cost-effectiveness analysis – I think it depends too much on having seen hundreds of cost-effectiveness models in the past and noticing that this one appears ‘fluffier’ on the decision rule than normal. However, I can make legible one aspect of what is leading me to the conclusion. Earlier, I gave a table of results comparing my own and GiveWell’s results. In fact, I had to work quite hard to generate the GiveWell side of this table; rather than a single summary number, the results GiveWell produce are an estimate is produced representing the effectiveness of the intervention in terms of multiples of GiveDirectly interventions at the bottom(ish) of each charity evaluation. Furthermore, this is not even presented as a summary effect for the whole charity; instead, the value is calculated separately for each country the charity operates in and the user has to take a weighted average in their head[2]. An example of such an output is provided below (you can see the relevant value is the third row from the bottom).
The issue of having to take weighted averages in your head is – I think – a genuine oversight by the GiveWell team (because they add weighted averages into some charities and there is no conceptual reason not to do this in every case that I can see). However, on the broader issue of not comparing charities against each other directly I worry that GiveWell have fallen for a subtle conceptual trap.
That conceptual trap would be confusing ‘decision-making at the margin’ (ie the shadow price of philanthropy) with ‘tools used to estimate the margin’ (ie rules of thumb like charities having to be 10x better than GiveWell). The reason this is a trap is that it actually hardly matters at all whether either of these charities are 10x more effective than GiveDirectly – if the most cost-effective charity in the world was only 5x more effective than GiveDirectly I’d still want to donate to that charity if I could [3]. You can spend so much time arguing about whether it should be a 10x or a 10.5x multiplier that you lose sight of the fact that 10x is just a tool you’re using to prioritise charities for investigation of the thing we’re really interested in, which is the opportunity cost of donating to one charity vs another.
I accept GiveWell have a robust defence of their approach. They say they prefer to use cost-effectiveness estimates only as one input in their thinking about charities (with ‘track record’ and ‘certainty of results’ being two other important but hard-to-quantify inputs), and therefore (I infer) don’t want to compare charities head-to-head because the 21.2x of AMF is not the same sort of ‘thing’ as the 9.8x of Malaria Consortium. For sure, Health Economists would agree that there may be factors beyond pure cost-effectiveness to consider when making a decision (e.g. equity considerations, commercial negotiation strategies that companies might employ and so on), but typically this consideration happens after the cost-effectiveness modelling, to avoid falling into the trap I mentioned above where you implicitly state that you are working with two different kinds of ‘thing’ even though they actually compete for the same resources [4].
I accept I’m inserting myself into a long-running debate in EA here, without much hope of moving the needle on an issue which is presumably a lot deeper than I fully understand. However, I really do want to stress how jarring it is to see a cost-effectiveness model which doesn’t actually deliver on the promise of guiding resource utilisation at the margin. An economic model is the most transparent and democratic method we have of determining which of a given set of charities will do the most good, and any attempt to use intuition to plug gaps rather than trying to formalise that intuition undoes a lot of the benefit of creating a model in the first place.
My recommendation would be that GiveWell adopt the convention of my model of piping all results to a single summary output table. That is, irrespective of whether GiveWell change their philosophical view on expect value economic modelling, they should behave as though they have changed their view when in ‘modelling mode’ and then make whatever adjustments they feel are necessary afterwards. I’ve tried to flag below where I think errors are directly caused by this conceptual confusion.
3.2 Model architecture
3.2.1 Introduction
After the issue of uncertainty analysis, I’d say the model architecture is the second biggest issue I have with the GiveWell model, and really the closest thing to a genuine ‘error’ rather than a conceptual step which could be improved. Model architecture is how different elements of your model interact with each other, and how they are laid out to a user.
It is fairly clear that the GiveWell team are not professional modellers, in the same way it would be obvious to a professional programmer that I am not a coder (this will be obvious as soon as you check the code in my Refactored model!). That is to say, there’s a lot of wasted effort in the GiveWell model which is typical when intelligent people are concentrating on making something functional rather than using slick technique. A very common manifestation of the ‘intelligent people thinking very hard about things’ school of model design is extremely cramped and confusing model architecture. This is because you have to be a straight up genius to try and design a model as complex as the GiveWell model without using modern model planning methods, and people at that level of genius don’t need crutches the rest of us rely on like clear and straightforward model layout. However, bad architecture is technical debt that you are eventually going to have to service on your model; when you hand it over to a new member of staff it takes longer to get that member of staff up to speed and increases the probability of someone making an error when they update the model.
In general, the GiveWell model architecture looks like the below:
There’s a central pillar which is every charity that they plan to evaluate, and then that central pillar grabs from a bunch of external data sources or some ancillary calculation spreadsheets where necessary. Sometimes, elements from the central pillar grab from other elements of the central pillar, which is a big no-no which I’ll discuss momentarily.
Compare to the architecture in my Refactored model:
The external data sources are piped into one holding spreadsheet, which is then used to calculate intervention-specific effects. Each of these two pillars grabs data from only one or two places, and then the outputs are piped to a ‘results’ section. The ‘results’ are a very important part of the conceptual framework for the model (as I outline above) but also for the architecture – it gives the outputs somewhere to go to that isn’t right on top of the inputs and calculations.
I don’t definitely know which model architecture appears more intuitively appealing to you, but to explain some of the differences as I see them:
Results are more clearly differentiated from intermediate calculations
Better Input / Output differentiation
No appreciable cross-sheet piping
More supportive of good micro-level architecture
External data sources are corralled to one place
I’ll talk about each below. I’m afraid this section is really long, but I also think the most relevant to anyone interested in building their own cost-effectiveness models.
3.2.2 Results are more clearly differentiated from intermediate calculations
As discussed in the ‘Conceptual Framework’ section above
3.2.3 Better Input / Output differentiation
One of the biggest improvements in the Refactored model is a much clearer differentiation between where inputs go and where outputs go. In particular, I have only three tabs that a user should ever input information into compared to about 12 in the Original model. The GiveWell model carries quite a significant risk of confusing outputs for inputs and so breaking the model when adjusting it. The image below shows a typical calculation sheet for the GiveWell model, and for me it is very hard to figure out what you can change without breaking the model elsewhere, or how you should make the changes to ensure they are correctly implemented (made harder by the fact that the formatting is often inconsistent![5])
A consistent model architecture is really important for spotting when you are making assumptions in one area but not in another. For example, the assumption about how many people share resources within a household is quite uncertain, and is considered to be 4.7 in all Cash Transfer interventions but 0.5 in all Deworming interventions (ie any income increase for the intervention is doubled to reflect sharing the resources across a household). It seems to me that this is an inconsistency in the model, because different numbers of people share resources in two otherwise similar situations. But it might not be an inconsistency – perhaps Cash Transfer and Deworming money is somehow different (hypothetically, because the Cash Transfer is windfall money whereas the Deworming money is earned income in the future). There is no real way to tell because the Original model has no centralised source of assumptions, so I can’t see whether the change violates the assumptions or is consistent with a more complex assumption (for example a separate input for ‘windfall money household size’ and ‘earned income household size’). But if that’s the case, then which of these two assumptions should be used for the portion of GiveWell money which is invested in a capital good and so pays off more like earned income? Explicit assumptions are critical to avoid spiralling confusion like this, and I/O differentiation is critical to make assumptions explicit.
Apparent errors of assumption consistency are pervasive throughout the Original model, and most of them also made it into the Refactored model because I wasn’t confident I understood the ground-level facts well enough to be bold about changing things. A few other examples of this issue:
When cash is transferred by GiveDirectly there is a 5% reduction in the amount transferred due to ‘negative spillover effect’. However, when cash is transferred by New Incentives this deflator is not applied. People are assumed to invest a certain percentage of money transferred by GiveDirectly, but there is no functionality to invest money transferred by New Incentives.
AMF loses a certain amount of effectiveness in some countries where Malaria Consortium operates due to some of their bednet distribution inevitably going to the same people as Malaria Consortium have targeted with Seasonal Malaria Chemoprevention. However, Malaria Consortium doesn’t have a corresponding figure for effectiveness lost due to bednet distribution.
The calculations for Malaria Consortium assume that every death from malaria causes 50% of a death from non-malaria sources. This is because “Empirical research suggests that malaria control interventions often have a larger effect on all-cause mortality than would be expected exclusively from declines in malaria-specific mortality”. However, there is no corresponding figure for AMF (I corrected this in the Refactored model and this is why AMF does so much better from the refactor [6]).
GiveDirectly has no leverage / funging adjustment, while every other charity does
New Incentives includes an ‘adjustment towards skeptical prior’, while no other charity does
New Incentives has a different discount rate for future life years than every other charity for reasons I can’t understand (and it is inconsistently applied to life years that New Incentives generates)
3.2.4 No appreciable cross-sheet piping
Piping outputs across sheets is a highly risky architectural decision. For example, you might think, “Well the development effects of HKI are unknown, but likely to be about 47% of the development effects of Malaria Consortium. So, in the cell which expects an input for HKI development effects I’ll just cross-reference the same cell in Malaria Consortium, multiplied by 47%”. The insidious thing about this approach is it works, and works so well that unless you stay very aggressively on top of it you can end up with a spiderweb of cross-referencing across the sheet.
Once you’ve developed such a spiderweb it is almost impossible to fix it without consigning the model to the fire and starting again. For example, consider you learned some fact which altered your assessment of Malaria Consortium’s benefits but not HKIs. You might go into the Malaria Consortium sheet, change the input and then save the sheet. But because Malaria Consortium is piped into HKI, you’ve also just altered HKI’s cost-effectiveness without meaning to. Importantly, you’ll get no warning message about this, and the next person to open the sheet won’t be made aware of the change. The only possible way you can prevent the problem is by checking that no unexpected changes have been made to the outputs every time you change an input, which is both time consuming and not robust anyway, because you can have nightmare scenarios where you are changing an input which is supposed to change HKI’s output, just not by as much as if the cell wasn’t piped across (eg the ‘not ideal design’ scenario in the diagram below).
Better architectural design can improve your chances of catching such an error. By having very clear differentiation between cells which are inputs and cells which are calculations, and keeping all the input cells in one place, you lower the risk that there is unexpected logic in the model you need to know about and remember. This enormously improves usability, and helps prevent error to boot.
The key rule I was taught it that sheets are either inputs, outputs or neutral with respect to other sheets, and it should be clear at a glance what their relationship is. That is, you should NEVER have a sheet which both references and is referenced by a second sheet, nor should you have a single sheet which references across ‘levels’ (although everyone does this second one so I’m not really being fair by dinging GiveWell for it).
A few other examples of the issue:
The proportion of deworming going to children is piped from the SCI Foundation to the END Fund
Development effects from the Malaria Consortium also pipe into New Incentives, as well as HKI
A multiplier for resource sharing in a household is piped from Deworm the World to Malaria Consortium (but not AMF, I’ve just noticed…)
The duration of effects of SMC is piped from Deworm the World to Malaria Consortium
The annual consumption per capita is piped from GiveDirectly to New Incentives
Also, a lot of assumptions about deworming effectiveness are piped from Deworm the World to other deworming charities, although this is slightly more justifiable than the others because you’d only ever want to change these assumptions en mass for the whole deworming space. Nevertheless, it is annoying to have to look in different places to find inputs you need (and will require masses of work if Deworm the World ever drops out of the top charities list) so I’d still change it.
3.2.5 More supportive of good micro-level architecture
Micro-level architecture is less about the grand sweep of model organisation, and more about how the model is laid out on a sheet-by-sheet basis. This is not amazing in the Original model, but in fairness to GiveWell it isn’t amazing in the Refactored model either because the problem space is so complex. A big problem GiveWell have is that their decision to put so much calculation and so many different sorts of calculation onto one sheet leads to challenging micro-architecture.
The diagram below shows the conceptual micro-architecture of the Deworm the World calculations for both the Original model (left, 219 rows) and the Refactored model (right, 36 rows). In fact, the Refactored model contains the calculations for all the deworming charities, so is actually doing four times more work than the same sheet in the Original model. However, an important point to remember in modelling is that ‘processor time is cheap’, and making a single sheet long and complicated is not a bad thing if the only thing that suffers is your laptop.
However, I think that piping information into and out of the sheet as in the Refactored model is a clear micro-architecture improvement, because it makes it very easy to find the information you need. Having worked with the Original model for a while now during the refactoring process, I can confirm that it is very hard to find the correct output quickly, and easy to make a mistake (eg selecting the charity- and intervention- adjusted results from Results 2 rather than the unadjusted results from Results 1). This is made even harder by the fact the sections are not always in the same order for each charity.
Confusing micro-architecture is the handmaiden of the most toxic modelling error of all, the ‘Inconsistent Formula’ error. This is where your micro-architecture becomes so cramped and hard to read that it becomes easier to add ad-hoc corrections to cells that need them, rather than taking a systematic approach to how you would include these corrections from the get-go because the systematisation of the sheet has broken down so badly.
To give an example of what I’m talking about, GiveWell try to estimate how much they need to adjust the base case mortality reduction estimates from Imdad et al (2017)’s study on vitamin A supplementation to account for internal and external validity adjustments. They note that there needs to be a further validity adjustment for Kenya because there is an unusually high vitamin A prevalence there. So, in the row labelled ‘Expected deaths averted in cohort due to program’ they multiply the base case by the internal and external validity adjustment… except for Kenya, where they multiply the base case by the internal and Kenya-adjusted validity adjustment (you can see in the screenshot below Excel is trying to tell you about this error by putting a little green triangle in the corner of the cell where a nonstandard formula has been entered).
This is a very common way of losing important information in your model – a new analyst comes along and (for example) decides to weight the internal and external adjustment differently. They write their new formula in the first cell of the row and then copy-paste it into the rest of the row. Your Kenya adjustment has now disappeared, but the model description still says it exists; the error won’t be discovered until someone goes cell-by-cell through the model and is switched on enough to expect a modified formula there.
In my refactored model I correct this – every country is multiplied by the internal, external and Kenya adjustment, but only Kenya has a non-zero value for the Kenya adjustment. You can see the impact of some of my other changes too – for example there are no user inputs on this page in my model (so even if you were deliberately trying to mess up the Kenya thing, you wouldn’t be able to in a way that matters)
Another example of this issue is that in the AMF calculations, the formula for ‘Counterfactual mortality with no bednet distribution’ differs between countries where SMC operates and where it does not. However, note the particularly nasty way this issue manifests – if an error was made in the 2021 model and then copied+pasted over in the 2022 model I wouldn’t be able to find it because the formula would look consistent with all the others. So in theory, there could be many more errors lurking that cannot be detected by someone like me who is just looking for inconsistent micro-architecture; consistent micro-architecture could be just as wrong if consistency is not intended!
3.2.6 External data sources are corralled to just one sheet
Which I’ll discuss in the next section, ‘Choice of Data Sources’
3.2.7 Conclusions
Taken together, I think my architecture is superior to GiveWell’s Original architecture – it is easier to use and less prone to errors. However, model architecture is something which needs to be frequently re-evaluated, as architecture which works well for certain types of charity will work poorly for others. I went through seven different versions of the Refactored model before I settled on the one I eventually presented, and in hindsight I’m not completely happy with it for a variety of different reasons [7].
One small additional point; architecture is the single biggest element of a model which is prone to ‘cruft’, or decisions being made just because it is easier to do a thing the easy way now than to do it properly and save time in the future. Over time these cruft-y elements accumulate until they are the only reasonable way of making simple changes to the model, and changes of moderate complexity become impossible. It can be helpful to have an outsider sweep through the model every couple of years and yell at everyone about any proto-cruft they come across, because it is very hard to self-police when each decision in isolation is so reasonable.
3.3 Choice of data sources
One of the most conceptually different elements of the GiveWell model to a typical Health Economic model is the variety of data sources which are used to generate outputs. Normally a Health Economic model will use data from a one or (maximum) two randomised control trials, with a smattering of literature sources to fill in certain gaps. This obviously isn’t possible for the GiveWell model – it is significantly more conceptually complex than a typical health economic model, and hence requires more data sources.
3.2.1 Problems with ‘off the books’ calculations
One way that GiveWell attempt to design around this problem is to perform a lot of calculations ‘off the books’. So, for example, if you want to find out what value GiveWell assign to averting the death of a child under 5 with malaria you are instructed to reference two external documents; one which has GiveWell’s thinking about moral weights generally, which itself is the weighted average of three other sources of data and one which has GiveWell’s thinking about malaria specifically, which references IHME data (although this data is available in the spreadsheet itself so clicking through would only be masochistic).
The obvious logic of doing things this way is that it keeps the model lean and easily understandable. You don’t, for example, need to include a database of IHME data in a model which references the IHME data only quite loosely. However, the harm of doing things this way is equally apparent; it takes forever to source simple claims made in the model, and it isn’t always obvious where these claims come from. A big way in which this might happen is if GiveWell change the way they organise data on their Google Drive without realising that one of the pieces of data they are changing is propping up an important claim in the cost-effectiveness model seven or eight layers later – sort of like the XKCD comic below. You can see this effect in action if you switch from considering Malaria deaths to those caused by insufficient Vitamin A in cell A10 of the ‘Moral Weights’ tab – clearly at some point between the model being conceived and now it was decided that the spreadsheet referenced in this claim should be kept private to GiveWell staff only, and so hence it is impossible to verify whether GiveWell actually claim the value of a death due to vitamin A deficiency is what GiveWell say it is.
Perhaps more fundamentally, shifting calculations ‘off the books’ means that assumptions feeding into the model don’t necessarily share in the model logic. For example, instead of using the GiveWell assumptions about the value of life years lost, the model offers the possibility of using values derived from Lopez et al. These represent the present discounted value of life years lost for an intervention which saves a life at 5 years old, 10 years old, 15 years old and so on. The issue is that the discount rate is also an important input in the economic model – Lopez et al assume it is 3% while GiveWell assume it is 4% (calculations for this are, naturally enough, on a separate sheet). So GiveWell accidentally strongly commits to a philosophical position that the discount rate on life years is less than the discount rate for money.
Better architecture in this case would look like putting as much calculation as possible ‘on the books’. To a first approximation, any raw data which can physically (and legally) be placed into a model should be, and it should be properly piped into the model logic. One of the most important quotes in any endeavour like this is that ‘processor cycles are cheap’. Specifically, it took me several hours to figure out the issue with the discount rates I describe above, write code to fix it, and then test the impact of that adjusted code on the model outputs. It takes a computer bare fractions of a second to recalculate all the work I did when the model opens, and then it never thinks about those numbers again. The idea that we should be referencing data without including it in the model itself belongs in the ancient history where the amount of data we include as backup information matters in any material way.
This is done very nicely in the New Incentives calculations, where multiple different vaccine types are included on the same spreadsheet. While I would myself have shifted most of those calculations onto an ancillary sheet to keep the microarchitecture clean, the risk of error is greatly lessened by having them in the model somewhere.
3.2.2 Robustness of data sources cited
As a separate point, I am a bit confused about why certain data sources are selected for inclusion in the model. In a professional Health Economic model, a systematic literature review (SLR) is undertaken for all important inputs. This aims to identify every piece of available evidence published on a topic, and then (ideally) average out that evidence in a process called meta-analysis or (failing that) at least select a representative example of the literature to act as a surrogate for this meta-analysis.
This does not seem to have been done for most inputs in the GiveWell model. For example, the treatment effect of deworming on ln(income) is taken to be 0.109 based on a study by Miguel and Kremer (2004). I happen to know from background reading that this study is very influential in the deworming literature, but is it the only relevant study? Probably not, because I know that there are re-analyses of the Miguel and Kremer data. Has anything changed since 2004 when the study was published? Potentially, since Cochrane failed to find an effect of this size in 2019. I can’t tell whether these considerations have been rejected elsewhere (in some other document not linked in the model) or whether they just haven’t been considered. I note that a superb entry into the Red Team contest has flagged this as a major risk on another deworming parameter, which makes me suspect that this issue is endemic across the model.
Speculatively, I’d suggest that it looks like GiveWell don’t have a programmatic approach to this issue. The GiveWell model has several hundred inputs and 100+ SLRs are infeasible even for a well-funded pharma company. Ideally, we’d prioritise those inputs which are important for thorough evidence review, but the GiveWell model has no way to identify important inputs. This is quite closely related to the fact that the GiveWell model has no proper uncertainty analysis tools, so hopefully correcting that will correct this too.
Moreover, I’d suggest that if the Effective Altruism community has funds to disburse on meta-charity pursuits in the future, a very high-impact use of those funds would be bounties on high-quality SLRs for important parameters in an economic model. The cost of getting SLRs done professionally can be in the mid- six-figures, whereas an SLR can be done to a very similar standard by an enthusiastic amateur with time to burn [8].
Section 4 – Issues of model execution
4.1 Choice of model structure
GiveWell clearly struggled with the analysis of some charities more than others. I’m not certain if this is obvious to anyone looking at the model or if it is another thing which is illegible until you’ve seen hundreds of them. An example of what I’m talking about is the structure around life-years saved per life saved in malaria interventions. Upon learning that a life had been saved by a LLIN a straightforward way of finding out how many life-years had been saved as a result would be to ask how old the saved life was, consult an actuarial table for life expectancy at that age, and then subtract one from the other. GiveWell instead ask the probability that the life saved was in one of four buckets, then take an average life expectancy in each bucket, then consult an actuarial table for people in that bucket, then subtract one from the other. Even though GiveWell’s solution is more complex, it is actually less accurate, because it averages information which in principle we don’t have to average. This is illustrated in the diagram below (‘normal’ on top, GiveWell on bottom).
This is a slightly unfair way of driving intuition, because often the slickest modelling solution to a problem looks absolutely nothing like the ‘natural’ way to investigate a problem. However hopefully it does drive the right intuition – there are some Rube Goldberg -esque structural choices in the GiveWell model which I wouldn’t expect to see in a model made by experienced Health Economists.
As mentioned above, GiveWell use a ‘deterministic decision tree’ structure for their model. There are two key points about this structure of model, which can both be true at the same time:
A decision tree structure is entirely suitable (even optimal) for quite a lot of decision problems, even those with complex moving parts
A decision tree structure is often used by non-experts who are not aware of the benefits of alternative structural specifications
On the second point, it is my belief (asserted with no evidence except my intuition) that a decision tree replicates the way intelligent people actually think about difficult decisions in some fundamental way, so when it comes time to formalising that thought process in Excel a decision tree is the first tool that people reach for. The issue is that when you get to a problem that decision trees are badly suited for, intelligent people can find a way to force the decision tree to give them a comprehensible answer (for example by cramming a continuous variable like ‘age’ into four categories so it is tractable to the structure of a decision tree). This is related to the point I made about architecture becoming ‘crufty’ over time; after someone has gone to the trouble of building a decision tree it is easier to apply your intelligence to the problem of ‘age’ than it is to apply elbow grease and rebuild the structure from scratch, especially if you have an intelligence-surplus and a time-deficit like I imagine GiveWell do.
Some classic failure cases of decision trees include:
Time dependent interventions (or really any continuous variable). For example, from the day you get malaria your life gets worse (you earn less and can potentially die, according to the economic model). So in terms of calculating the output of the model, it matters a lot exactly when the malaria occurs. The more abstract the age categories the less accurate the model.
Complex partial interventions. For example, GiveWell transfers a large amount of money and generates a certain amount of utility for that transfer. New Incentives transfers a much smaller amount of money and so the logic of the deterministic decision tree requires that a proportionally smaller amount of utility is generated. But this might not be true – even if we assume the relationship between transfer size and utility is monotonic, there’s no reason to believe it is linear.
Compounding effects. For example, it is possible that the benefit of deworming on income drops off over time. Also, not all those who are dewormed should get the full 40 years of benefit, because some might die before then. But you can’t really take an average of income over time and life expectancy, because people living longer earn less. Decision trees are very bad at the sort of myriad-possibility analysis this creates. I’ve no doubt GiveWell could figure out formulas that analytically solve these problems, but personally I fear equations with logs, exponentiation and compounding in the same location because they’re opaque to me.
Path dependent effects. For example, AMF and Malaria Consortium operate in some of the same areas, and any life AMF saves shouldn’t be attributed to Malaria Consortium (and vice versa). It is very difficult to get a decision tree to understand this sort of concept without liberal cross-sheet piping, which is bad.
Dual-decision effects. I don’t think there’s actually an example of this in the GiveWell model, but decision trees can become quite ‘unstable’ if there are multiple decision points within the model, in the sense that a small change to inputs can have an extremely radical change to outputs. For example, a decision tree would be an utterly terrible choice for a serious evaluation of a ‘longtermist’ charity for a variety of reasons including this one.
As a suggestion, the GiveWell modellers might want to consider exploring other modelling structures for some of their charities which would be better served that way. Given the specific set of charities GiveWell are evaluating at the moment I would recommend first exploring ‘Markov Chain’ structures. These are very flexible and would allow for a lot more flexibility over e.g. parameters decaying, compounding and being path dependent. This comes at the cost of making certain other modelling tasks harder, so it is a question of the GiveWell team finding a balance they are happy with.
4.2 Errors
I’ve never built a model without errors, and so I’m acutely aware I’m sitting in a glass house about to start hefting stones around in this section. I am certainly not claiming I have some level of quality that GiveWell don’t have! Nevertheless, I have identified some areas which I think are just straight-up errors in the model, giving the wrong result:
The adjustment for charity-level factors double-counts these issues. For example, GiveWell assume that the risk of ‘Misappropriation without monitoring results’ is 10% for SCI Foundation and the risk of ‘False monitoring results’ is 5%. Taken together this gives a total risk of something going wrong with your donation of 10%+5% =15%. GiveWell says that each dollar you donate to SCI Foundation is therefore only ‘worth’ $0.85 (ie 85% of $1). However, we can see this isn’t a good assumption; if only 90% of your money ever makes it to the intended recipient (because 10% is misappropriated) then a 5% risk of false monitoring results means 5% * 90% of your original donation will be wasted, not 5% * 100% as GiveWell assume. This is only a difference of $0.005 per dollar donated vs the GiveWell assumption, but it matters a lot more when very large or very small percentage values are involved [9].
The model reports the effectiveness of an intervention per philanthropic dollar spent, but this is (subtly) incorrect. The decision problem facing GiveWell is not exactly finding the most cost-effective charity per philanthropic dollar, but rather finding the most cost-effective charity that my philanthropic dollar can contribute towards. So, the cost-effectiveness of a particular charity per dollar I personally donate ought to be the effectiveness that that dollar brings, plus any matched additional philanthropic funding that dollar generates – but I’ve still only spent one dollar when it comes to the ‘cost’ part of ‘cost-effectiveness’. The idea is that you might abstractly be interested in the total cost of an intervention vs its effects, or even the total philanthropic cost of an intervention vs its effects, but GiveWell is concretely interested in the good done by a marginal donation, so only the first actor matters. Hopefully the diagram below illuminates more than it confuses!
Further, the above issue is not quite consistent across the model – HKI and New Incentives do it the way I suggest whereas the other charities do it the ‘wrong’ way. At the very least the philosophical approach (known as the ‘perspective’ in jargon) should be consistent across all charities. Just to return to the conceptual framework issue from earlier, I note that this inconsistency would probably have been spotted if the costs of charities were being directly compared to each other – it is because the framework is wrong that this issue is so hard to spot.
The model uses estimates from Lopez et al (2006) to calculate how many future years of life a life saved is likely to lead to at different ages. However, Lopez uses a discount rate of 3% whereas the main GiveWell model uses a discount rate of 4%. This is important because it means the source used to calculate the future value of health and the source used to calculate the future value of consumption differ as to what the future will actually look like [10].
There’s a number of hard-coded formula in the New Incentives sheet (ie formula which contain an actual number rather than a reference to a cell), which therefore won’t update when you make changes to the model. This occurs on row 80, 81, 146, 162, 170. There’s also a stray hard-coded formula in AMF which occurs in Cell B28, which also contains an Inconsistent Formula Error, making it potentially the most erroneous cell in the entire model.
To give a sense about how minor these errors are, I would be extremely pleased and surprised if a model I submitted to a national regulator had nothing worse than these errors in. It is a great credit to the GiveWell team that in this area where hard work and intelligence (rather than experience of building different kinds of models) has the greatest returns, they are comfortably ahead of the professional curve for Health Economists on this metric.
4.3 Usability issues
Finally, a handful of minor miscellaneous irritants which don’t affect model accuracy but do make it harder to work with:
4.3.1 Unclear markup
It is helpful when cells which can be changed with user inputs are flagged, so that the user can be confident that they won’t break formulas by amending inputs to the model. GiveWell follows best practice in this area by colour-coding user-input cells as blue-text and calculation cells as black-text. There’s also a slightly peculiar convention of colour-coding cells piped from elsewhere in green-text, but there’s no particular harm in this. Personally, I find this convention quite tricky to follow at a glance – the blues and blacks sort of blend in to each other – but I have pretty bad eyesight so your mileage might vary.
The screenshot below is a typical element of the Original model:
And below this is a typical element from the Refactored model (this is actually images from two tabs, because the blue user-entry cells are kept strictly separate from the green piping cells and clear calculation cells):
I slightly prefer my convention of colour-coding the backgrounds to colour-coding the text, but it is not a strong preference.
What is slightly more problematic is that there are errors in the GiveWell markup. For example, in New Incentives there is a whole section (‘Adjustment for vaccines with multiple doses’) marked up as a calculation which is in fact a user-entry cell and in HKI / Sightsavers there is a section (‘Leverage/Funging adjustment’) which is marked up as user-entry when it is in fact a calculation – the latter way round is the particularly dangerous one because it means formula can get overwritten by mistake.
All of the above is compounded by the model architecture – a really smoothly designed model doesn’t need lots of colour coding to make everything make sense, because it is obvious which cells are inputs and which are outputs. Obviously, we all fall short of the Platonic ideal of beautiful model architecture, but certainly good architecture can compensate for inconsistent formatting and vice versa.
4.3.2 Unclear navigation
This is very much an issue of taste, but I find GiveWell’s model harder to navigate on a macro-level than my own. The GiveWell model has a coversheet with hyperlinks to different parts of the workbook, which then don’t have corresponding macros to take the user back to the coversheet (so the user clicks the tabs at the bottom of the spreadsheet for some things and the hyperlinks for others, potentially). In my model, every hyperlink is embedded at the side of every sheet, meaning it is much easier to jump around the spreadsheet.
I think the GiveWell method works better as the number of sheets increases, but I think for the small-ish number of sheets in both of our models it is reasonable to have everything accessible all the time.
4.3.3 Hidden cells
There are a lot of hidden cells in the GiveWell model. Some of these, like Columns F:S in the ‘Moral Weights’ spreadsheet are presumably hidden because they contain redundant functionality (in this case it is an alternative method of calculating the value of a statistical life which is no longer used). However, some are hidden entirely inexplicably to me – the image below shows 16 rows of the GiveDirectly calculations, with a number of those rows hidden by making them too small to read. I’m pretty certain this is an error because one of these hidden cells is a vitally important user input (the ‘Baseline annual consumption per capita’). Interestingly this problem doesn’t seem to exist on the Google Sheet so it is probably not the fault of the GiveWell team – but still bizarre and rather annoying!
I’d purge all hidden cells – both deliberate and non-deliberate.
4.3.4 Overcomplicated formula
Of all the things which confuse me about the GiveWell model, this one confuses me the most. Some of the formulas used by GiveWell are bafflingly overcomplicated. For example, here is the formula I use to reference the discount rate whenever it crops up:
=‘Moral Inputs’!$G$7
And here is the formula GiveWell use:
=INDEX(‘Moral weights and discount rate’!1:39,MATCH(“Overall discount rate”,‘Moral weights and discount rate’!A:A,0), MATCH(“Active”,‘Moral weights and discount rate’!1:1,0))
The only explanation I can think of is that perhaps this is the way that some old version of Google Sheets handles piping and nobody has corrected the formula since? There’s a fairly lengthy explanation about how to use these formula on the GiveWell website so I get the sense it is more deliberate than that. Either way it is a really weird way to handle data, but it always seems to give the correct outcome so I can hardly fault GiveWell for their commitment to it!
While I certainly wouldn’t be above mentioning this just on aesthetic grounds, it actually has major usability implications for the model because resolving that kind of formula takes so much longer than resolving a quick and direct formula. In the Original model it takes my laptop 8.3 seconds to update the discount in Excel (although much less than that if I keep the model in Sheets, for some reason). In the Refactored model it can update the discount rate over 1000 times in this same period. Since altering input variables rapidly is something we very much want to be doing while reviewing and updating a model, I’d recommend moving away from these ultra-complicated formulas.
4.3.5 Explanatory comments
To end on a positive note, I absolutely love the convention GiveWell adopt of including detailed explanatory comments on almost all data inputs in the model. It is common in Health Economics to include baffling dropdown menus full of impenetrable acronyms (would you prefer RPSTFM or mRPSTFM for your survival curve?), so to see a modelling team with such a strong emphasis on actually explaining what they are doing at every step is a real breath of fresh air. I also like the way that more detail on the figures can be communicated, such as discussing limitations with the evidence or uncertainty over the correct way of interpreting a study. All in all, this is something I will be taking back to my day-job with me.
Section 6 – Conclusions
Overall, the GiveWell model deserves its reputation as a strong example of Effective Altruism cost-effectiveness modelling. It accomplishes its goals of accurately calculating the base-case utility of each intervention, with only some very minor errors which don’t appear to fundamentally alter the value of its conclusions.
The major issue with the model is a lack of uncertainty analysis. I cannot stress how significant an improvement getting this nailed would be to the lives of the EA community. Other issues are mostly just missed opportunities to architecture the model in a way that will make it easier to work with, locate errors and future-proof the analysis. Of these ‘architectural errors’ the most important by far is a non-standard use of external sources; both source discovery/aggregation (which is usually done with a systematic literature review) and source input in the model (which is usually done by directly including the source in the model, rather than linking out to an external – but still first-party – analysis).
Recommendations for improving future iterations of the model (in a rough order of importance) are:
The goal of a cost-effectiveness model is always to solve a decision problem – there is no other use for a model other than academic curiosity. The model should be treated as though it is the only thing GiveWell use to make decisions, which would involve designing significantly more ‘adversarial’ results pages and potentially including other charities for evaluation to ensure that the least cost-effective top charities are still effective enough to differentiate themselves from the pack. This is true whether or not GiveWell actually treat the model as the only thing that is used to make decisions; to do anything less is to deliberately underutilise the model.
Strongly consider the overall architecture of the model before beginning work on a future version. If the model type changes for any charity, the optimal architecture will probably change accordingly, so this is something to consider more seriously if GiveWell move away from deterministic decision trees for any of their charities.
Undertake at least some systematisation of literature sources to the model. If this has already been done, it may be appropriate to mention this in the model in a comment bubble over the relevant section to avoid the impression of atypical evidence synthesis methods.
Generally fix all errors, formatting issues and either fix or explain weird differences between superficially similar charities (eg pick a certain multiplier for resources in a household and stick with it).
- ^
Moreover, the decision problem facing GiveWell modellers is significantly harder than those I’d face in my day-job. Cash Transfers and Deworming are completely dissimilar interventions, so you can’t reuse much model logic from one intervention to another. Given this, it wasn’t even like the GiveWell team could just adapt existing common techniques when they were inventing EA modelling.
- ^
It is my understanding that donors cannot demand their donation is spent in a particular country – if this is not the case then I withdraw that last critical comment and GiveWell are right to split outcomes by country, but then they should also report results by country-charity combination rather than by charity
- ^
In conventional cost-effectiveness modelling there is no such thing as a technology which is ‘cost-effective’ in a vacuum; much like the Sith, pharmaceutical products become cost-effective only by defeating other pharmaceutical products in value-for-money stakes.
- ^
I’m not sure if an exception which proves the rule is helpful here, but just in case; I used to work mostly on fertility interventions. Fertility interventions have two main effects from a medical point of view—they can create babies where none would have existed before (and these babies have their own stream of QALYs), and they can manage the mental health impact of wanting children but not having them (which improves parental QALYs). Early on, me and my team took the decision that these QALYs really genuinely were different kinds of ‘thing’ and that we weren’t going to compare interventions head-to-head on these metrics. This was so that we didn’t have to prioritise interventions which created lots of babies per live birth (like IVF) at the expense of interventions which created an ordinary number of babies with excellent management of parental mental health (like psychosexual counselling). This was basically us sidestepping the Repugnant Conclusion. This is a very strong philosophical assumption (I’m not even sure we were right to make it, in hindsight) and I’d expect to see argumentation on the level of ‘the alternative is the Repugnant Conclusion’ before I’d accept it of GiveWell choosing not to compare charities head-to-head.
- ^
I know GiveWell colour code the sheet nicely but that isn’t exactly what I’m talking about. For example, suppose you wanted to change an entry in the second column and the second column ONLY. Are you confident that the entry in the third column will stay the same when you do? There is some inconsistency about whether the ‘user entry’ cells are always user entry, or if they link to other cells which are genuinely user entry and which will always be expected to co-vary.
- ^
I think the Refactored model actually probably overcorrects this parameter (potentially by quite a lot), since the studies which look at net use consider all-cause mortality whereas the studies which look at SMC consider only malaria incidence. However this distinction is inconsistently applied in the AMF calculations (eg AMF calculations row 67 looks at malaria mortality rather than all-cause mortality), so I decided for the sake of the Refactor to just cut through the complexity and keep the same assumptions for AMF as Malaria Consortium
- ^
I think there’s a lot of room to improve on what I eventually landed on by someone with better knowledge of which of GiveWell’s decisions were deliberate to better reflect the ground-level truths and which could potentially be changed in future versions of the model. Delighted to hash out some of my ideas in the comments if there is ever a refactor on the cards.
- ^
An SLR has three stages—protocol writing (quick), literature reviewing (very time consuming) and results synthesis (quick). The first and third step need to be done by someone who is reasonably familiar with the field. The ‘literature reviewing’ step could be distributed across the whole EA community, which is helpful because that’s the step which is most time-consuming. Distributed SLRs might be something to investigate if it hasn’t already been.
- ^
Having made this point, I then noticed just before I published the post that I had made exactly the same error in my model by taking a weighted average of effects across countries which you can’t do when those effects could be percentages (for the reason I outline in the text). So that’s rather a lot of egg on my face…
- ^
A classic example of the sorts of problems this might cause is the ‘Keeler-Cretin paradox’ – we should never intervene philanthropically because we can always save more lives by waiting until tomorrow and then making the same donation (except tomorrow we will also have to wait to maximise the good we do…). Interestingly this is actually philosophically justifiable in principle; in theory growth in the value of health could be greater than growth in the value of consumption over the same period, and hence produce a lower discount rate for health benefits than financial benefits over some defined period. However, my gut feeling is that GiveWell were not intending to commit hard to this position (‘differential discount rates’ in jargon), and should instead bring the discount rates into alignment (as I have done in the Refactored model)
- Winners of the EA Criticism and Red Teaming Contest by (1 Oct 2022 1:50 UTC; 227 points)
- EA & LW Forums Weekly Summary (21 Aug − 27 Aug 22’) by (30 Aug 2022 1:37 UTC; 144 points)
- Methods for improving uncertainty analysis in EA cost-effectiveness models by (29 Aug 2022 18:07 UTC; 128 points)
- Interactive replication of GiveWell’s cost-effectiveness model by (13 Feb 2026 3:24 UTC; 80 points)
- CEA’s work in 2022 by (21 Dec 2022 9:21 UTC; 78 points)
- 's comment on CEA/EV + OP + RP should engage an independent investigator to determine whether key figures in EA knew about the (likely) fraud at FTX by (13 Nov 2022 1:49 UTC; 75 points)
- An Examination of GiveWell’s Water Quality Intervention Cost-Effectiveness Analysis by (1 Nov 2022 1:00 UTC; 64 points)
- EA & LW Forums Weekly Summary (21 Aug − 27 Aug 22′) by (LessWrong; 30 Aug 2022 1:42 UTC; 57 points)
- Why are you reluctant to write on the EA Forum? by (4 Mar 2024 18:10 UTC; 51 points)
- Why are you reluctant to write on the EA Forum? by (4 Mar 2024 18:10 UTC; 51 points)
- Project ideas: Epistemics by (4 Jan 2024 7:26 UTC; 43 points)
- Project ideas: Epistemics by (LessWrong; 5 Jan 2024 23:41 UTC; 43 points)
- Seeking feedback on a MOOC draft plan: Skills for Doing Good Better by (16 Dec 2022 11:42 UTC; 41 points)
- 's comment on Celebrations and gratitude thread by (3 Sep 2022 14:14 UTC; 18 points)
- Monthly Overload of EA—September 2022 by (1 Sep 2022 13:43 UTC; 15 points)
- 's comment on CBA 301: Practical Advice by (12 Feb 2025 2:22 UTC; 10 points)
- Giving What We Can October Newsletter 2022 by (1 Nov 2022 3:08 UTC; 6 points)
- 's comment on Level up your spreadsheeting by (LessWrong; 26 May 2024 15:17 UTC; 5 points)
Thanks so much for putting this together. I’d love to put you in touch with our team, can you follow up with me at ben.bateman@givewell.org?
I want to link to my comment below because I’m slightly concerned if any non-negligible number of the criticisms in Froolow’s post are actually valid.
This is really fascinating and in-depth work, and seems very valuable. You might want to consider working for GiveWell or Open Phil given your skillset and clear passion for this topic!
I did want to comment about one particular item you mentioned. You said:
I think this is not actually correct? Deworming charities have a “replicability adjustment for deworming” applied to the cost-effectiveness number (see e.g. line 11 of the Deworm the World sheet), which is arrived at via a similar kind of Bayesian framework.
This looks like you are probably right—I’m really sorry I haven’t had time to go through both sets of calculations in detail but they do seem to be getting at the same sort of adjustment so that’s an excellent spot. I suppose regardless, if it isn’t obvious to a user that the same adjustment is being made to two different numbers then this is reason enough to make it more explicit!
Hi Froolow,
Thank you so much for this thoughtful review!
We’ve looked through the issues you identify as errors, and we believe that each of those is either not an error or is something we’ve deprioritized because addressing it would not change our grantmaking decisions. You can see our analysis here.
This only applies to the potential errors you pointed out, not your higher-level feedback or judgment calls. We’re grateful for your engagement here, and we are working on improving the architecture of our CEAs, in line with your higher-level feedback. We also recognize that the interpretability of our cost-effectiveness analysis is an area we need to improve, and we’re working on that as well.
Since the linked document was written for internal use, it hasn’t been fully vetted in the same way that what we publish on our website is. However, we thought it may be useful to share in its current form.
Best,
Andrew (GiveWell)
Really happy you found the critique valuable. I agree with everywhere you’ve said the issue is too small to be worth addressing, and also with the correction that because AMF and SMC used different data sources it was legitimate not to explicitly model indirect deaths for the AMF (I’m also pleased you’ve standardised your methodology in the updated model, because this was quite a big discrepancy between approaches).
I don’t totally agree with the other areas where you’ve said you’re confident there is no error at all. I think a better interpretation might be that you’ve got a reasonable simplifying assumption that isn’t worth adjusting. For example, you say that it is appropriate to use different methodologies to account for the spillover effects of cash transfer vs income increase from deworming, which results in larger effective household sizes for cash transfer than for deworming. This is because deworming increases income via improving the earning potential of one member of the household, so there needs to be an adjustment for multi-earner households. Obviously you’re the topic area experts so I’d defer to you on whether or not this is reasonable, but the way you’ve implemented this seems contestable to me in the abstract; around 40% of the benefits of GiveDirectly are assumed to be accrued in the form of dividends on a long-term capital investment, but those benefits are distributed across the entire family of 4.7 for the entire ten-year period of the intervention, whereas in the deworming models you explicitly downweight family size to account for dependents leaving the household over time and the possibility of having two earners in a household. It seems more defensible to me to use a constant family size over the two interventions, and instead adjust the number of consumption doublings the deworming intervention provides to account for some families having two wage earners (so a doubling in individual income from the intervention doesn’t translate to a doubling in household income in the model). That is to say; either approach seems completely reasonable in isolation, but using a different approach in the two interventions favours GiveDirectly (because a given transfer spread across more people results in more utility overall, due to utility being a function of log income increase). In hindsight it is probably a bit harsh to describe this as an ‘error’ by GiveWell because it is a good-faith effort to capture the most important part of the model dynamics, but I also don’t think it is unambiguously correct as you’ve indicated in your review document; there’s a genuine inconsistency here. Overall I feel the same about most of the other areas you’ve highlighted—I was probably a bit over-harsh describing them as ‘errors’, but nevertheless they are potentially risky methodological steps which seem to have simpler and less risky alternative implementations.
Also on a small point of clarification—your comments in the linked document suggest that you are not worried about the hard-coded cells because they don’t have any impact on calculations. Sorry if I wasn’t clear in the text, but the main impact of hard coded cells is that the model becomes really hard to maintain—you won’t have an intuitive sense about whether you can make certain changes or not, because certain calculations you might expect to take place actually won’t happen because of the hard coding.
I haven’t read this through and don’t know to what extent the criticisms are valid, but it certainly looks impressive.
My concern is, if some or many of these criticisms are valid, how a key player in the Effective Altruism movement could have been blind to them or at least not have addressed them, for so long. GiveWell and its cost-effectiveness model has been directing large amounts of money over the past 15 years. I would have hoped that somewhere along the road they would have opened up their model to scrutiny from world-leading experts in cost-effectiveness. I see in a comment that a GiveWell representative is very keen to chat to Froolow which raises the question—why has it taken so long for that chat to happen?
Perhaps other EA orgs are also neglecting opening up their analysis to world-leading experts?
One of the key takeaways in the body of the text which perhaps I should have brought out more in the summary is that the GiveWell model is basically as reliable as highly professionalised bodies like pharma companies have figured out how to make a cost-effectiveness model. A small number of minor errors are unexceptional for a model of this complexity, even models that we submit to pharma regulators that have had several million dollars of development behind them.
I would say that while the errors are uninteresting and unexceptional, the unusual model design decisions are worth commenting on. The GiveWell team are admirably transparent with their model, and anybody who wants to review it can have access to almost everything at the click of a button (some assumptions are gated to GiveWell staff, but these aren’t central). Given this, it is remarkable the EA community didn’t manage to surface anyone who knew enough about models to flag to GiveWell that there were optimisations in design to be made—the essay above is not really arcane modelling lore but rather something anyone with a few years’ experience in pharma HEOR could have told you. Is this because there are too few quant actors in the EA space? Is it because they don’t think their contributions would be valued so don’t speak up? Is it because criticism of GiveWell makes you unemployable in EA spaces so is heavily incentivised against? Etc etc. That is to say—I think asking why GiveWell missed the improvements is missing the important point, which is that everyone missed these improvements so there’s probably changes that can be made to expert knowledge synthesis in EA right across the board.
Just to add that I think outreach efforts like the Red Team contest are a really good way of doing this—I wouldn’t have heard about the EA Forums had it not been for the plug Scott Alexander gave the contest on Astral Codex Ten (which I read mostly for the stuff on prediction markets).
Thanks so much. This is a tour de force! I have one more suggestion about this model. I know that GiveWell has strong reasons to use its own metrics rather than DALYs or QALYs. The problem is that DALYs and QALYs are much more widely used in the academic literature.
My suggestion is the model should report estimated $/DALY averted in addition to (not instead of) the preferred units of cost-effectiveness as a multiple of cash transfers. This would:
Provide up-to-date benchmarks to catalyze shallow investigations of new cause areas. There’s no need to do a lot of modeling to quickly evaluate a new intervention that reports in units of $/DALY averted.
Allow for a quick “reality check” of these models. Do they lead to results that are in the same ballpark as published estimates from the literature?
Even if the EA cost-effectiveness units are indisputably better, the benefits of being able to engage more directly with the research community seem to outweigh the costs of adding a few rows to the model.
I don’t think this works to achieve the same end, because $/DALY is specific to measuring health benefits—it doesn’t provide any way to capture increased income, consumption, etc. Nonetheless, evaluations like “AMF saves a life for $4,000” must have been derived from a $/DALY estimate at some point in the pipeline so I suspect it is being calculated somewhere already.
That’s not true – GW’s AMF CEA goes straight to mortality reduction, no $/DALY intermediate step. None of the other GW CEAs use D/QALY either; if they don’t use mortality reduction they use 2x income.
Thanks for doing this (I’ve skimmed, hope to read carefully). I’ve been trying to encourage GW a bit in this direction myself, particularly more careful data and calculation processes and pipelines, and using of Monte-Carlo explicit uncertainty modeling. There may be some inertia issues at GW that need some encouragement to get past.
On the explicit uncertainty, I’m trying to keep track of and encourage projects HERE in this Gitbook. The work of Sam Nolan (QURI) and Joe; McGuire (HLI) seem particular relevant.
I’ll integrate your essay/refactoring here into that, and would love your involvement in that gitbook/project if you are interested. (Let’s chat?)
Please do use the Refactor however you would like, although please also add enough of a disclaimer to keep the context from this essay that the Refactor is an academic exercise which tries to stay roughly true to GiveWell’s design philosophy and assumptions while improving architecture and calculation conventions. I don’t think as a standalone piece of modelling it is the cutting edge of what EA could aspire to, whereas Nolan / McGuire really do seem to be operating at that level.
But yes, really happy to contribute if I can be of any help—drop me a message!
I think exercises like this are incredibly underrated and that the quantitative updates to the cost-effectiveness of each charity are the most important contribution of this post. But I do think that this would benefit a lot from putting the spreadsheet correction details in a technical appendix and dedicating more of the body to a substantive review of uncertainty analysis. You flag it as the most important disadvantage of GiveWell’s framework and then only promise to talk about it in a future post—the result is that this post does not have that much substance for people to discuss or think about, and most of the 45 minute read is spreadsheet details. So I wish I could engage in a critical discussion but I don’t think there’s much to engage with, except that AMF is looking pretty juicy right now.
I had the same thought. I enjoyed this, and I super appreciate the author writing it all up! Fascinating stuff. But it sort of felt like a home inspector telling me, “So your foundation is definitely going to crack and cause your house to fall into a sinkhole. I might tell you how to fix that in a few weeks. In the meantime, here’s an incredibly detailed analysis showing your roof is in good shape!”
This was fascinating. Thanks so much for writing it, and for including your refactored model for public viewing. I’m especially looking forward to the future post on uncertainty analysis.
As of now, I’m fairly optimistic about the potential of recent projects like Squiggle and Causal to help take uncertainty analysis beyond the pessimistic-to-optimistic interval presented in some of GiveWell’s older CEAs. I’d be interested in learning, from your future post, about the tools that health economists currently use to analyse uncertainty, and your views on how EAs should carry out uncertainty analysis going forward.
Note that there have been some independent uncertainty and sensitivity analyses in the past:
Uncertainty and sensitivity analyses of GiveWell’s cost-effectiveness analyses (from me)
https://forum.effectivealtruism.org/posts/ycLhq4Bmep8ssr4wR/quantifying-uncertainty-in-givewell-s-givedirectly-cost (from hazelfire)
This was an entertaining, informative, and very well presented read (that also plays well to my love for systems and processes). Thanks for putting it together.
Thanks, this is a very substantial and interesting post.
Could you clarify (to a layperson) what the disagreement is here?
My understanding: Say we need to choose between interventions A and B, where A and B have outputs of different types. In order to make a choice, we need to make some assumptions—either explicit or implicit—about how to compare those different types of outputs. Either we can make those assumptions explicitly and bake them into the model, or we can model the interventions with separate units, and then make the assumptions (either explicitly or implicitly).
I take it that your fertility analysis did not do this, but that GiveWell does do some of this (e.g. comparing lives saved to increased consumption), only they then take other things—like track record and strength of evidence—into account in addition to the model’s output. Is the disagreement that you think GiveWell should also include these additional considerations in the cost-effectiveness analysis?
Ah sorry, I think I might have confused the issue a bit with my footnote. I think I’ve managed to conflate two issues in your mind.
The first is exactly as you say; any intervention worth doing has some effects which are easy to model and some which are difficult (maybe impossible) to model. What GiveWell has done is completely reasonable here; modelling what it can and then making assumptions about how important the other things, like track record, are in comparison to the main cost-effectiveness results.
The second issue is the more subtle one that I was driving at. Imagine you are going to buy a new car, and your friend (who knows about cars) says that modern cars are 10x more fuel efficient than the car you currently drive. Speaking very roughly, there are two strategies you could pick from to choose your next car:
Completely ignore your friend, and pick the car that has the best MPG regardless of any other feature. This would be a good strategy if literally all you care about is fuel efficiency, but a bad strategy otherwise (because it is unlikely the most fuel efficient car is also the most comfortable to drive—especially if fuel efficiency and comfort are sort-of tradeoffs)
Treat your friend as having offered a useful rule of thumb, and so have an idea in your head about what ‘good’ fuel efficiency looks like. This is a good strategy if cars aren’t really directly comparable along a straightforward scale—a Ford F-150 isn’t ‘better’ or ‘worse’ than a Prius, it is just a different kind of thing.
Both GiveWell (implicitly) and me in my fertility days (explicitly) argue that QALYs are like cars—you can end up in a situation where you can generate different kinds of QALYs and your best bet is to compare them with a rule of thumb like GiveWell’s 10x multiplier. However I don’t think GiveWell is correct in making this assumption about charities—there is in fact a single measure like MPG which we want to ruthlessly optimise, and therefore we do actually want to it the F-150 and Prius directly against each other.
However my point in the essay is that GiveWell don’t actually have to choose—they can build their model as if they are in the first world and directly compare charities together, and then make their final decision as though they are in the second world and different charities will offer different profiles of benefit on top of their cost-effectiveness. This is pretty much the commonsense way of choosing a car too—you would look at MPG and directly compare cars in this way, but you might then consider other factors. It would be weird to lump all cars together in your head as ‘better than 10x my previous efficiency’ or ‘worse than 10x my previous efficiency’.