Health and happiness research topics—Part 1: Background on QALYs and DALYs
Sequence contents
Background on QALYs and DALYs
The sHALY: Developing subjective wellbeing-based health metrics
The WELBY (i): Measuring states worse than dead
The WELBY (ii): Establishing cardinality
The WELBY (iii): Capturing spillover effects
The WELBY (iv): Other measurement challenges
Applications in effective altruism
Applications outside effective altruism
Conclusions
Sequence summary
Note: As many of the posts have not yet been completed, I may edit this summary to reflect the final content.
This series of posts describes some of the metrics commonly used to evaluate health interventions and estimate the burden of disease, explains some problems with them, presents some alternatives, and suggests some potentially fruitful areas for further research.[1] It is primarily aimed at members of the effective altruism (EA) community who may wish to carry out one of the projects. Many of the topics would be suitable for student dissertations (especially in health economics, public health, psychology, and perhaps philosophy), but some of the most promising ideas would require major financial investment. Parts of the sequence—particularly the first and last posts—may also be worth reading for EAs with a general interest in evaluation methodology, global health, mental health, social care, and related fields.
I begin by looking at health-adjusted life-years (HALYs), particularly the quality-adjusted life-year (QALY) and the disability-adjusted life-year (DALY). By combining length of life and level of health in one metric, these enable direct comparison across a wide variety of health conditions, making them popular both for evaluating healthcare programmes and for quantifying the burden of diseases, injuries, and risk factors in a population. I’ve also heard EAs using these concepts informally as a generic unit of value.
However, HALYs have a number of major shortcomings in their current form. In particular:
They neglect non-health consequences of health interventions.
They rely on poorly-informed judgements of the general public.
They fail to acknowledge extreme suffering (and happiness).
They are difficult to interpret, capturing some but not all spillover effects.
They are of little use in prioritising across sectors or cause areas.
This can lead to inefficient allocation of resources, in healthcare and beyond.
Broadly, three alternative measures[2] could be developed in order to address these limitations:
The HALY+: a tweaked version of the original QALY or DALY that captures some non-health outcomes and/or relies on more informed preferences.
The sHALY: a “subjective wellbeing-based HALY” that retains the health-focused descriptive system but assigns weights to health states using experienced wellbeing rather than preferences.
The WELBY: a wellbeing-adjusted life-year that can, in principle, capture the benefits of all kinds of intervention. A variation, the pWELBY, uses preferences to assign weights to each level of wellbeing.
After introducing these metrics, this sequence of posts considers the additional research required to create them, and potential applications both within and outside EA. The importance, tractability, and neglectedness of each major project is briefly considered, though I do not attempt a formal priority ranking.[3] For individual researchers, my extremely tentative view is that work to establish the “dead point” (below which are states worse than dead) and lower bound on wellbeing scales is likely to have the greatest payoff—but, as with careers in general, the best choice of project is likely to depend heavily on personal fit. For well-funded research teams, including some large EA organizations, there may be the opportunity to resolve some key uncertainties and help establish wellbeing as the unit of measurement in global health and public policy.
While the main purpose of the sequence is to raise questions rather than provide answers, I conclude with some general thoughts about the value of work to improve and apply these outcome measures. Overall, I’m increasingly skeptical that any single metric will suit all purposes, and that the outcome measure is a major source of uncertainty in the biggest decisions, such as choosing between neartermist cause areas (such as global health) and longtermist ones (such as risks from artificial intelligence). I also think that the practical and normative challenges of using wellbeing, especially subjective wellbeing, have perhaps been underestimated. That said, progress on these questions could have significant implications for certain priorities, potentially changing our views on, for example, the relative importance of physical versus mental health, healthcare versus social services, and preventing human extinction versus preventing astronomical suffering.
Key takeaways from Part 1
Health-adjusted life-years (HALYs) combine duration of life and level of health in one metric. This is useful when evaluating health interventions and quantifying the amount of health (or disease) in a population.
The most widely-used HALYs are the quality-adjusted life-year (QALY) and disability-adjusted life-year (DALY).
On the QALY scale, 1 = perfect health, 0 = dead, and negative values represent states considered worse than dead. Health states are typically described using scores on a generic health state questionnaire such as the EQ-5D. Values (often called weights or utilities) are normally assigned to states using the preferences of the general public, as expressed in elicitation tasks such as the time tradeoff.
On the DALY scale, 0 = perfect health and 1 = dead; it does not currently allow states worse than dead. Disability weights are primarily based on pairwise comparisons in which members of the public decide which of two people are healthier. The aim is thus to measure health (rather than preferences or utilities), though in practice most QALY and DALY weights are roughly equivalent.
I argue that QALYs and DALYs, as typically constructed, have five major drawbacks:
Problem 1: They neglect non-health consequences of health interventions.
Problem 2: They rely on poorly-informed judgements of the general public.
Problem 3: They fail to acknowledge extreme suffering (and happiness).
Problem 4: They are difficult to interpret, capturing some but not all spillover effects.
Problem 5: They are of little use in prioritising across sectors or cause areas.
There are three general alternatives (also shown in the table below):
The HALY+: a tweaked version of the original QALY or DALY that captures some non-health outcomes and/or relies on more informed judgements.
The sHALY: a “subjective wellbeing-based HALY” that retains the health-focused descriptive system but assigns weights to health states using experienced wellbeing rather than preferences.
The WELBY: a wellbeing-adjusted life-year that can, in principle, capture the benefits of all kinds of intervention. A version of this, the pWELBY, uses preferences to assign weights to each level of wellbeing.
Each of these has various advantages, disadvantages, use cases, and measurement challenges, which are addressed in more detail in subsequent posts.
Introduction to Part 1
Health-adjusted life-years (HALYs) are widely used for trading off health and longevity, but they are often misunderstood in the effective altruism community. In this post, I describe quality-adjusted life-years (QALYs) and disability-adjusted life-years (DALYs)[4] with respect to their overall structure (upper bound, “dead point,” and lower bound), system for describing health states, methods for assigning values or “weights” to those states, practical applications, and interpretation. I then introduce five (of many) potential problems and limitations of these HALYs from a wellbeing perspective, and outline three alternatives: the HALY+, sHALY, and WELBY.
The aim of this post is to give readers enough background information on QALYs and DALYs to grasp their major similarities and differences, appreciate the need for improvement, and understand the posts that follow. It provides a more thorough and up-to-date introduction than you’ll find on, say, Wikipedia or in most journal articles,[5] so I expect even those who are somewhat familiar with HALYs will learn something new.[6] That said, readers who are pressed for time and already have a solid grasp of health metrics may want to skip to the section on core problems.
What are QALYs?
Structure
A QALY is a year lived in full health—or more precisely, at maximum health-related quality of life (HRQoL; the distinction is discussed below). Zero on the QALY scale represents being dead, or in a state as bad as being dead, so values below zero are states worse than dead. In principle the lower bound can be anything, but academics developing the QALY normally set an arbitrary bound of −1 or even higher; I’ll return to this issue later.
The scale has ratio (and therefore interval and cardinal) properties:[7] 0.4 is twice as healthy as 0.2, and a move from −0.5 to −0.3 represents the same change in HRQoL as a move from 0.1 to 0.3, or 0.8 to 1. Movements along the scale represent equivalent proportional changes in life expectancy: increasing your HRQoL by 0.5 for a year is exactly as beneficial as gaining an extra year of life at 0.5, two years at 0.25, and so on.
The QALY value assigned to a health state is known as a weight, utility, or simply value, with lower numbers indicating greater severity. For instance, if a year lived with back pain has 80% of the value of a year with no health problems, its weight is 0.8. The process for obtaining these weights typically has two components: a system for describing health states, and a method for assigning values to them.
Descriptive system
Health economists have used four main methods to describe health (Brazier, Ratcliffe, et al., 2017, ch. 7–8):
Generic multi-attribute utility instruments (MAUIs) classify health states using several dimensions of health (pain, mobility, depression, etc.), giving a score to each dimension to indicate the level of severity.[8] MAUIs have been popular since the 1980s because they make it easier to compare outcomes across different conditions, are usually easy to administer, and are recommended by most agencies in charge of approving new health technologies (Zhao et al., 2018; Rowen et al., 2017). However, in some conditions they can lack content validity (they don’t cover some important symptoms or consequences), responsiveness (they don’t measure significant changes in the condition), or face validity (patients and/or clinicians see them as irrelevant). It’s also important to note there are limits to their comparability (e.g., many different MAUIs are used around the world, and they’re not always valid in children), and they may not cover the aspects of life that matter most to patients.
Condition-specific measures only include dimensions relevant to the particular disease, e.g., cancer (Rowen et al., 2011) or dementia (Mulhern et al., 2020). They are sometimes used when generic MAUI data are unavailable, are not accepted by the relevant decision maker (e.g., the US Federal Drug Administration’s approval process requires condition-specific outcome measures), or lack validity in that condition. The obvious disadvantage is the loss of comparability across conditions or interventions, in part because naming and drawing attention to the condition can distort preferences at the valuation stage (see the discussion of “focusing effects” later in this post). Their narrow focus can also cause important comorbidities and side-effects to be ignored.
Bolt-ons are dimensions, e.g., sleep (Yang et al., 2014) or vision (Longworth et al., 2014), that are added to generic MAUIs to improve validity in a particular condition. These can avoid some focussing effects, but their presence still influences values for the other dimensions, thereby hampering comparability.
Vignettes are accounts of what it’s like to live with a health condition, sometimes including the treatment process. These are typically in the form of a written narrative (e.g., Salkeld et al., 2000)—though bullet points are also common (e.g., Bass, 1994), and studies have experimented with audio, video (e.g., Lenert, 2004), and spectacles that simulate vision problems (Aballéa & Tsuchiya, 2007). They were popular until the 1980s, and are still occasionally used to generate QALYs when generic measures are deemed inappropriate, such as when the treatment itself is very unpleasant, unusual symptoms are salient, or there is a small risk of a serious adverse event. While cheaper than developing condition-specific measures and bolt-ons, the main drawback is again the lack of comparability among studies. In addition, they rely on the experience of a “typical” patient (whereas effects of the condition may vary widely), are easy to manipulate to get the desired results, and have a generally weak evidence base.
This post focuses on generic MAUIs as they are currently the most popular instruments.[9] In particular, I describe the three-level version of the EuroQol Five Dimension (EQ-5D-3L) because it’s been used in far more relevant studies than the others, is comparatively simple to use and explain, and is still recommended by the UK’s National Institute of Health & Care Excellence (NICE) despite the development of the EQ-5D-5L.[10]
An example[11] of the EQ-5D-3L questionnaire is shown below. Its dimensions are:
mobility (ability to walk about)
self-care (ability to wash and dress yourself)
usual activities (ability to work, study, do housework, engage in leisure activities, etc.)
pain/discomfort
anxiety/depression
Each level is scored 1 (no problems), 2 (moderate problems), or 3 (extreme problems). These scores are combined into a five-digit health state profile, e.g., 21232 means some problems walking about, no problems with self-care, some problems performing usual activities, extreme pain or discomfort, and moderate anxiety or depression. However, this number has no mathematical properties: 31111 is not necessarily better than 11112, as problems in one dimension may have a greater impact on quality of life than problems in another. Obtaining the weights for each health state, then, requires a valuation exercise.[12]
Valuation methods
There are many ways of generating a value set (set of weights or utilities) for the health states described by a health utility instrument. (For reviews, see e.g., Brazier, Ratcliffe, et al., 2017 or Green, Brazier, & Deverill, 2000; they are also discussed further in Part 2.) The following five are the most common:
Time tradeoff: Respondents directly trade off duration and quality of life, by stating how much time in perfect health is equivalent to a fixed period in the target health state. For example, if they are indifferent between living 10 years with moderate pain or 8 years in perfect health, the weight for moderate pain (state 11121 in the EQ-5D-3L) is 0.8.
Standard gamble: Respondents trade off quality of life and risk of death, by choosing between a fixed period (e.g., 10 years) in the target health state and a “gamble” with two possible outcomes: the same period in perfect health, or immediate death. If they would be indifferent between the options when the gamble has a 20% probability of death, the weight is 0.8.
Discrete choice experiments: Respondents choose the “best” health state out of two (or sometimes three) options. Drawing on random utility theory, the location of the utilities on an interval scale is determined by the frequency each is chosen, e.g., if 55% of respondents say the first person is healthier than the second (and 45% the reverse), they are close together, whereas if the split is 80:20 they are far apart. This ordinal data then has to be anchored to 0 and 1; some ways of doing so are presented in Part 2. Less common ordinal methods include:
Ranking: Placing several health states in order of preference.
Best-worst scaling: Choosing the best and worst out of a selection of options.
Visual analog scale: Respondents mark the point on a thermometer-like scale, usually running from 0 (e.g., “the worst health you can imagine”) to 100 (e.g., “the best health you can imagine”), that they feel best represents the target health state. If they are also asked to place “dead” on the scale, a QALY value can be easily calculated. For example, with a score of 90⁄100 and a dead point of 20⁄100, the weight is (90-20)/(100-20) = 70⁄80 = 0.875.
Person tradeoff (previously called equivalence studies): Respondents trade off health (and/or life) across populations. For example, if they think an intervention that moves 500 people from the target state to perfect health for one year is as valuable as extending the life of 100 perfectly healthy people for a year, the QALY weight is 1 – (100/500) = 0.8.[13]
There are many variations of each general approach, and some valuation studies combine two methods (e.g., Devlin et al., 2018). It is also common for one health utility instrument to have multiple value sets for different populations, e.g., there are EQ-5D-3L value sets for at least 16 countries. Here, I focus on the Measurement and Valuation of Health (MVH) protocol for the time tradeoff (TTO; Williams, 1995), as that was used to obtain the UK value set for the EQ-5D-3L (Dolan, 1997).[14] For the purposes of this explanation, we will assume the respondent’s name is Jack and the state being valued is moderate pain and anxiety (11122).
The MVH protocol has three main steps. First, Jack is asked to choose between ten years in perfect health (11111; Life A) and ten years in the target health state (Life B; 11122). This is to establish that he considers the target health state to be worse than being in full health; if not, the exercise is stopped and a value of 1 is recorded. Second, Jack is asked to choose between immediate death and ten years in Life B. This is to determine whether he thinks the state is better than dead or worse than dead. For better-than-dead states, Jack is presented with the following “time board” in the third step:
He is then asked to choose between five years in Life A (11111) or ten years in Life B (11122). Time is added to or subtracted from Life A until Jack is indifferent between the options.[15] The value of the state on the QALY scale is calculated as the duration in Life A divided by the duration in Life B (which is always ten years). For example, if Jack is indifferent between 7.5 years in perfect health and ten years with moderate pain and anxiety, the value is 7.5/10 = 0.75. This can be formally illustrated as follows:
If Jack would rather die immediately than live for ten years in Life B, he is presented with the time board for states worse than dead:
Here, Life A is a composite of time in the target health state followed by time in full health (totalling ten years), and Life B is immediate death. If Jack prefers five years in 11122 then five years in 11111 over death, he is offered a Life A consisting of six years plus four years respectively. If instead he prefers Life B, he is offered four plus six. As with the better-than-dead version, the time is varied until he is indifferent between the options. If x is the number of years in full health the value of the health state is -x/(10 – x). For example, if Jack’s Life A is eight years in 11122 followed by two years in 11111, his value for moderate pain with moderate anxiety is −2/(10 – 2) = −2/8 = −0.25. This can be shown schematically as follows:
The EQ-5D-3L can describe 243 unique health states. For the UK valuation study, 42 of these were chosen, representing a wide range of levels across all dimensions (but excluding implausible states, such as being confined to bed yet having no problems with self-care). Each respondent, from a representative sample of the UK population (n = 3,395), valued 12 states: 33333 (the worst possible), unconscious, two “very mild” states, three “mild,” three “moderate,” and three “severe.” Regression techniques were used to obtain coefficients for levels 2 and 3 of each dimension (see table below); these are subtracted from 1 to obtain the QALY value. In addition:
0.081 is subtracted for all states other than 11111.
0.269 is subtracted once if any dimension is at level 3.
So, for example, 11122 has a value of 1 – (0.123 + 0.071 + 0.081) = 0.725.
There were particular challenges in modelling states worse than dead. Whereas better-than-dead states were valued on an interval scale, with time in full health being linearly related to the utility of the state, the worse-than-dead task involves changing both the time in full health and time in the target state. This produces data on a ratio scale with a (very) non-linear relationship to utility. The scale also has a theoretical lower bound of minus infinity (when the respondent would prefer death to anything less than 10 years in full health), though in this particular exercise three months in the target state was stipulated to be the minimum, giving a lower bound of −9.75/(10 – 9.75) = −39. Dolan (1997) considered this problematic:
The asymmetry between positive and negative values posed problems for individual-level analysis because those respondents rating a state as worse than death would have a much greater impact on the model predictions than those respondents rating it as better than death. Patrick et al. (1994) transformed their negative values so that scores for states rated as worse than dead were bounded by −1, ie, symmetrical to the upper bound of +1 for states that are rated as better than dead. This transformation was justified on statistical grounds, but there is possibly a psychometric justification as well: that respondents may treat the scale for states worse than dead in the same way as they are assumed to treat the scale for states better than dead, ie, as an interval (not a ratio) scale. For these reasons, then, valuations for states worse than dead were transformed using the formula (x/10) − 1, where again x represented the number of years spent in full health.[17]
Thus, the minimum individual score became 0.25/10 – 1 = −0.975, and the lowest utility in the final value set (for state 33333) was −0.594. Issues with measuring states worse than dead are discussed further below and in later posts.
Application
The QALY is used in the economic evaluation of healthcare programmes, and less commonly for impact evaluation, monitoring patients over time, and summarizing the overall health of a population.
Evaluating interventions
The QALY is primarily used for measuring the outcome of health programmes. This can be done in the context of assessing impact alone, or even monitoring an individual patient (or group of patients) over time (Drummond et al., 2009; Kind et al., 2009). However, QALYs are most frequently used for cost-effectiveness analysis (CEA),[18] which assesses the amount of (health) gain for a given level of input (or the input required to gain a unit of health).
In high- and middle-income countries, the QALY is the most popular outcome measure in CEAs. In a review of 40 pharmacoeconomic guidelines, the QALY was the recommended measure of benefit in nearly all of them (Zhao et al., 2018); most famously, the UK’s National Institute of Health and Care Excellence (NICE) recommends QALYs derived from the EQ-5D-3L (NICE, 2013). Tufts Medical Center maintains the CEA Registry, a database of QALY-based cost-effectiveness studies, which now number over 8,000.
A highly simplified illustrative example of QALY-based CEA is provided below and in this spreadsheet. For a proper exposition, see Paulden (2020a) or Drummond et al. (2015).
Suppose you want to compare the cost-effectiveness of Drug A ($15,000 per patient), Drug B ($50,000), and doing nothing ($0) for the treatment of a particular disease. You gather data (e.g., from clinical trials or disease modelling) on the outcomes for each group of patients, in terms of life expectancy and EQ-5D-3L profiles. Total QALYs for each patient are the average utility weight (calculated from the EQ-5D numbers) multiplied by the duration in that state. This is equivalent to the “area under the curve” in a graph like this:
In this case, total QALYs remaining in the patient’s life are as follows:
The cost-effectiveness of each option is normally represented by an incremental[19] cost-effectiveness ratio (ICER) and/or net benefit. The ICER compares each treatment option to the next most effective alternative:
Incremental analysis of hypothetical health interventions using QALYs as the measure of benefit. ICER = incremental cost-effectiveness ratio.
To determine whether the intervention is cost-effective, the ICER can be compared to a willingness-to-pay (WTP) threshold, which should be based on the opportunity cost of health spending (i.e., how much health is lost by spending money on a different treatment). For instance, if it currently costs $20,000 to gain a QALY,[20] we generally should not buy a new drug that costs $30,000 per QALY because from a fixed budget that would cause a net loss of 0.5 QALYs. In the example above, Drug A would be cost-effective (i.e., cause net health gain) at a threshold of $20,000, but Drug B would not.
This threshold also allows the calculation of net benefit. The net monetary benefit (NMB) compared to No Treatment is the dollar value of the total (not incremental) QALYs (as determined by the WTP threshold) minus the costs. For instance, if a QALY is valued at $20,000:
In this case, Drug B has the same overall benefit as doing nothing, but Drug A causes $9,000 of additional benefit per patient, making it the most cost-effective option.[21]
Equivalently, the benefit can be stated in terms of net health benefit (NHB): the QALYs gained minus the QALYs lost by diverting resources to that intervention:
So Drug A causes 0.45 QALYs more benefit per patient than the other two options.
The net benefit approach is (rightly, in my view) gaining popularity in health economics, and some have even suggested abandoning the ICER entirely (Paulden, 2020b). However, the ICER has some advantages (O’Mahoney, 2020) and the two measures may be considered complementary.
Population health summaries
Summary measures of population health combine morbidity and mortality into one metric in order to quantify the overall health of a population (Murray, Salomon, & Mathers, 2000). The QALY has been used in this way to measure the “stock of health”—the amount of health in a population in a given period of time. The theoretical maximum stock in one year is equal to the population, as each person represents one (theoretical) QALY. The “lost stock of health”—a concept similar to the “burden of disease” for which DALYs are normally used—indicates the difference between the maximum and the actual levels of health, as measured by instruments such as the EQ-5D. The loss attributable to particular causes can be estimated using statistical methods that relate scores on HRQoL measures to health conditions, such as depression, or types of condition, such as chronic illness. However, this seems to be a fairly uncommon use of such metrics; for an example, see Sánchez-Iriso et al. (2019).
Interpretation
There is considerable disagreement over what the QALY represents, and what it ought to represent.
To begin with, it’s worth considering what is meant by health-related quality of life. Health itself is a heavily contested concept: it was famously defined by the World Health Organization (WHO) as “a state of complete physical, mental, and social well-being, and not merely the absence of disease and infirmity,” but others restrict it to “optimal” or “typical” physical and mental functioning, defined with reference to societal and/or biological norms (Salomon et al., 2003; Hausman, 2012a, 2012b, 2014). Quality of life (QoL) is variously understood in subjective and/or objective terms: wellbeing, opportunities, needs, wants, social status, self-actualization, and so on (Bowling, 2005).
Unsurprisingly, then, definitions of HRQoL also vary widely. After reviewing the options,[22] Karimi and Brazier (2016) suggested the term be used to mean two things:
“the utility associated with health (as measured by valuing health status questionnaires, e.g. using the EQ-5D with an attached value set)”
“the way health (as measured by health status questionnaires) affects QoL (as measured by QoL questionnaires) as empirically estimated using statistical techniques”
I will adopt these definitions going forward.
While terminological nuances are not always important, the distinctions between health, HRQoL, and wellbeing reflect critical theoretical differences between the QALY and its alternatives. The QALY originally emerged from welfare economics, grounded in expected utility theory (EUT), which defined welfare in terms of the satisfaction of individual preferences. QALYs were intended to reflect, at least approximately, the preferences of a rational individual decision-maker (as described by the von Neumann-Morgenstern (vNM) axioms) concerning their own health, and could therefore properly be called utilities.
Others have argued that QALYs should not represent utility in this sense. These “non-welfarists” or “extra-welfarists” typically believe things like equity, capability, or health itself are of intrinsic value (Brouwer et al., 2008; Coast, Smith, & Lorgelly, 2008; Birch & Donaldson, 2003; Buchanan & Wordsworth, 2015). If such considerations are included in the QALY, the (welfarist) utility of patients may not change proportionally with the size of QALY gains.
Descriptively, it seems the extra-welfarists are winning. Although QALYs, and CEA as a whole, do not generally include overt consideration of distributional factors, they do depart from traditional welfare economics in a number of ways (see e.g., Brazier, Ratcliffe, et al., 2017, chs. 3 & 11; Drummond et al., 2015, chs. 5 & 6):
People do not in practice follow the principles of EUT. For example, respondents in health state valuation tasks are not good at thinking about very large or very small probabilities, and generally express a positive time preference (i.e., they prefer a unit of health sooner rather than later).
EUT only applies to individual decision-making; it is arguably irrelevant once preferences have been aggregated across a population.
The individuals relevant to EUT are the patients themselves, as they are the “consumers” of healthcare, whereas most value sets have been obtained from the general public, whose preferences are often different.
Due in part to equity concerns, CEAs do not normally consider how willingness to pay for a QALY varies across individuals, or include non-health effects of treatment, such as on productivity. From the perspective of welfare economics, this contributes to inefficiency, because willingness to pay reflects strength of preference (i.e., utility), and because productivity losses raise the total cost of losing a QALY.
Decision-makers do sometimes give additional weight to certain populations. Most famously, NICE is willing to pay much more for a QALY at the end of life and for very rare diseases, and has “special arrangements” for cancer drugs (although none of these are part of the CEA itself) (Paulden, 2017).
Interestingly, all of these approaches seem to assume that QALY weights currently reflect self-regarding preferences; that is, what the respondent thinks is best for them.[23] In fact, they may also capture some effects of a health state or treatment on others, which I’ll call spillovers. This can happen because respondents in valuation tasks are influenced to some extent by altruism, such as the impact of a disease on family members (e.g., Krol et al., 2016). Some conditions also have broader societal consequences than others—through productivity losses, social care needs, criminal behaviour, and so on—but such effects will not necessarily scale proportionally to the QALY weight, which further complicates their interpretation. These other-regarding factors appear to be relatively neglected in the literature, and are discussed along with other criticisms below and in Parts 2 and 6 of this sequence.
What are DALYs?
The disability-adjusted life-year has changed considerably since it was developed for the World Bank in 1990 and subsequently adopted by the World Health Organization (Chen et al., 2015). Most notably, it has dropped age weighting and time discounting, and derives disability weights from pairwise comparisons (similar to discrete choice experiments) in population-based surveys rather than person tradeoff exercises in panels of medical experts.[24] However, unlike the QALY, only one formulation is typically used in any given year. This section describes the version used in the 2019 Global Burden of Diseases, Injuries, and Risk Factors Study (GBD 2019) by the Institute for Health Metrics and Evaluation (IHME), which now leads the development of the DALY—though the methods have not changed greatly since a major revision for GBD 2010 (Salomon et al., 2012; Salomon et al., 2015). For a comprehensive explanation, you can read all 1,813 pages of Appendix 1 in Vos et al. (2020).
Structure
Roughly speaking, the DALY scale is the inverse of the QALY scale, with 0 representing full health and 1 representing death, or a state as bad as being dead. So whereas a QALY represents one year in full health, a DALY represents one lost year of healthy life. The aim, therefore, is to gain QALYs but avert DALYs.
Aside from the direction of the scale, the main structural difference is that it is currently capped at 1, so it does not admit states worse than dead. The scale could, in principle, be changed to allow them, but there is little prospect of this happening soon.[25]
As with QALYs, numbers are attached to health states representing their severity, but in this case a higher value is worse, e.g., a year lived at 0.8 contains half as much healthy life as a year at 0.4. The methods for deriving these “disability weights” are also quite different from those typically used for the QALY, as described in the following sections.
Descriptive system
The latest version of the DALY system contains 440 health states (including combined states) for non-fatal health outcomes. These are designed to be collectively exhaustive, i.e., to cover all possible states that don’t lead to immediate death. Each unique state is given a non-technical description (a kind of short vignette),[26] developed in consultation with experts, that focuses on its “functional consequences and symptoms” (Salomon et al., 2012, Appendix 1). For example, an acute episode of a mild infectious disease is described with:
has a low fever and mild discomfort, but no difficulty with daily activities
While most descriptions, like that one, are fairly generic, others name the particular cause, e.g., a person with cannabis dependence
uses marijuana daily and has difficulty controlling the habit. The person sometimes has mood swings, anxiety and hallucinations, and has some difficulty in daily activities
For the purposes of the GBD, these health states are assigned to over 2,000 unique sequelae, defined as “distinct, mutually exclusive categories of health consequences that can be directly attributed to a cause” (Vos et al., 2020, Appendix 1, p. 17). For example, the infectious disease, acute episode, mild health state described above is used for mild early syphilis infection, mild malaria, and a number of other disease sequelae. The table below contains further examples, selected to illustrate various types of condition and features of the DALY system, alongside their disability weights; the full list can be downloaded here.
Valuation methods
[27]The primary method for obtaining disability weights is pairwise comparisons, a form of discrete choice experiment.[28] In brief, the respondent is presented with descriptions of two people, each of whom had a different health state, and asked: Who do you think is healthier overall, the first person or the second person?[29]
The relative severity of the health states is determined using probit regression analyses that infer the amount of health loss from the frequency of each response. As described above for discrete choice experiments, the basic intuition is that states causing similar levels of disability would have a roughly even split, while worse conditions would be chosen less often in proportion to their severity.[30]
To enable the results to be anchored on the 0–1 scale, “population health equivalence” questions were also included in the surveys. These are similar to person tradeoff exercises, but framed as retrospective population health improvements (rather than prospective individual preferences):
The last questions will ask you to compare the overall health benefits produced by two different programs. Imagine there were two different health programs.
The first program prevented 1000 people from getting an illness that causes rapid death.
The second program prevented [Number selected randomly from {1500, 2000, 3000, 5000, 10 000}] people from getting an illness that is not fatal but causes the following lifelong health problems: [Lay description for randomly selected health state inserted here, for example, “Some difficulty in moving around, and in using the hands for lifting and holding things, dressing and grooming.”].
Which program would you say produced the greater overall population health benefit?
These enabled inferences to be made about the badness of death versus living with an illness.[31]
These data were collected in 2009–10 from over 30,000 respondents using household surveys in four countries (Bangladesh, Indonesia, Peru, and Tanzania), telephone interviews in the USA, and an open-access web survey. Responses to the paired comparisons were remarkably similar across diverse populations (r ≥ 0.9, except in Bangladesh [r = 0.75]), so data from all sources were analysed together, leading to a single set of disability weights (Salomon et al., 2012). A similar survey was subsequently carried out with another 30,000 respondents in four European countries (Hungary, Italy, the Netherlands, and Sweden), and the data have been pooled with the earlier surveys when calculating disability weights since GBD 2013 (Salomon et al., 2015).
Application
The DALY is used for economic and impact evaluation, and to quantify the burden of disease in a population.
Evaluating interventions
The DALY is widely used to evaluate health interventions in low- and middle-income countries (LMICs), and less frequently in high-income countries (Neumann et al., 2018). It has been used to assess the overall impact of large programmes, such as Population Service International’s diverse set of global health projects (David, 2013; Yang et al., 2013; Montagu et al., 2013; Longfield et al., 2013), but, like the QALY, is more commonly employed in cost-effectiveness analyses.[32]
For CEAs, the DALY does not seem to be recommended by any government agencies (ISPOR, 2020; Zhao et al., 2018) but is the primary measure of benefit for some large international organizations, most notably WHO-CHOICE (Edejer et al., 2003; Hutubessy, Chisholm, & Edejer et al., 2003) and the Bill & Melinda Gates Foundation (BMGF). The “reference case” (set of guidelines) created by BMGF and NICE International (2014) recommends the DALY in order to
provide continuity with current practice and familiarity to decision-makers in LMICs, and to complement large-scale LMICs analyses funded by the BMGF. Unlike the QALY, the DALY does not require context-relevant health state valuation estimates.
It is also the main metric for the Disease Control Priorities Network (funded by BMGF), which reviews evidence on health interventions for low-resource settings (see especially Horton, 2018). The Global Health CEA Registry at Tufts Medical Center maintains a list of DALY-based analyses, now numbering 779 (about ten times fewer than with the QALY).
The methods are essentially the same as for QALY-based CEAs. The main difference is that the area being summed when calculating DALYs is the “gap” between the level of healthy life achieved and a theoretical life in full health. This requires an assumption about how long the patient would (or should) have lived, which is now taken from a “reference standard life table”[33] based on “the lowest observed age-specific mortality rates by location and sex across all estimation years from all locations with populations over 5 million in 2016” (Vos et al., 2020, Appendix 1, p. 56). Roughly speaking, it is the life expectancy in ideal circumstances—currently nearly 88 years at birth, 39 years at 50, and six years at 90.
Thus, total DALYs incurred = years of life lost (YLL) + years lived with disability (YLD), where
YLL = Number of deaths × standard life expectancy at age of death
YLD = Number of cases × disability weight × duration lived with disease
To mirror our hypothetical QALY example, the total DALYs incurred in the graph below (with the y axis running from 1 to 0) are represented by the area “over the curve” (spreadsheet):
No Treatment DALYs = Blue + Green + Yellow
Drug A DALYs = Blue + Green
Drug B DALYs = Blue
The total DALYs averted are under the curve, the same as QALYs gained. This can be calculated by subtracting the DALYs incurred from the standard life expectancy (six years in this case), or by summing the relevant areas:
No Treatment DALYs averted = Gray
Drug A DALYs averted = Yellow + Gray
Drug B DALYs averted = Green + Yellow + Gray
The incremental DALYs averted are therefore also the same as the QALYs gained: Yellow (Drug A), and Green (Drug B).
Consequently, the ICERs and net benefit for these example programmes are identical to the QALY-based analyses (assuming, of course, that the DALY weights exactly mirror the QALY values, e.g., 0.2 = 0.8, and that the willingness-to-pay threshold is the same):
So it’s perhaps unsurprising that, in the handful of comparisons available in the literature, differences between QALY- and DALY-based cost-effectiveness ratios are generally modest, and attributable to the weights rather than something more fundamental (Feng et al., 2020).[34]
Population health summaries
However, the DALY has perhaps been most influential through its use in the GBD studies, for which it was originally designed. GBD 2019 quantifies DALYs attributable to 369 causes in 204 countries and territories around the world. 78 of these causes lead to disability but not death (e.g., headache disorders), and five cause death but not disability (e.g., sudden infant death syndrome). The cause hierarchy (downloadable here) contains four levels of increasing specificity. Level 1 has three broad categories (communicable, maternal, neonatal, and nutritional causes; non-communicable diseases; and injuries); Level 2 has 22; Level 3 has 174; and Level 4 has 301. The first three levels each contain a mutually exclusive and collectively exhaustive list of causes of health loss, while Level 4 is only used to disaggregate some Level 3 causes. For example:
Below these are 2,063 cause sequelae (Level 5), e.g., moderate major depressive disorder, plus 1,410 injuries sequelae. Each of those is attached to one of 440 health states (Level 6), e.g., major depressive disorder, moderate episode, as shown in the Descriptive system section above. (Vos et al., 2020, Appendix 1, pp. 16–17)
To get the YLD for each sequela, the disability weights associated with the relevant health states are multiplied by the prevalence in the population (with adjustment for comorbidities). To get the YLL, the number of deaths caused by the disease is multiplied by the “standard” life expectancy at age of death. The YLL and YLD are summed to obtain the DALYs. (For a concise step-by-step account of DALY calculation, including disease modeling and data collection, see Devleesschauwer et al., 2014.)
DALYs (alongside YLL, YLD, and deaths) were also used to measure the burden attributable to 87 behavioral, environmental and occupational, and metabolic risk factors (Murray et al., 2020). This analysis used a separate four-level hierarchy (downloadable here); for example:
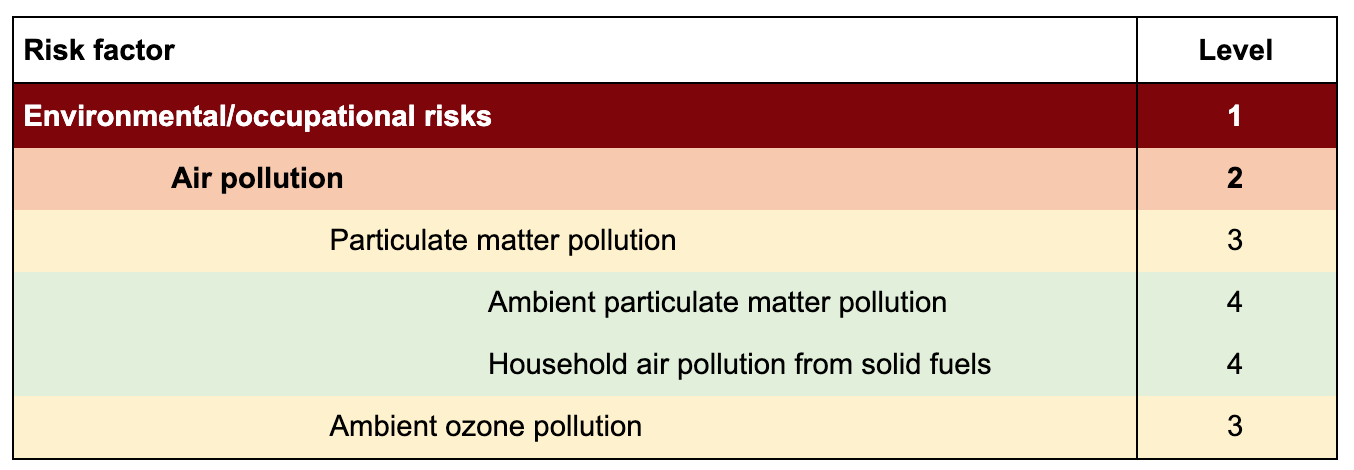
A multi-step process then compared the health loss attributable to the risk factor with the loss that would have occurred had the risk factor exposure been at its theoretical minimum. (See Murray et al., 2020 for details.)
Further GBD 2019 analyses (not all using DALYs) include:
Historical trends in fertility, mortality, healthy life expectancy, and population (1950–2019) (Wang et al., 2020)
Fertility, mortality, migration, and population forecasts (2017–2100) (Vollset et al., 2020)
Measuring universal health coverage (Lozano et al., 2020)
Lots of additional resources are available on the IHME website, including peer-reviewed publications and policy reports, infographics, country profiles, raw data, the research protocol, FAQs, and five visualisation tools—most notably GBD Compare, which produces graphics like this:
Interpretation
The key conceptual distinction between the QALY and the DALY, aside from the direction of the scale, is that the DALY aims to measure (lost) health—not HRQoL, wellbeing, welfare, or utility. Moreover, its developers understand health somewhat narrowly as an individual’s capacity in a uniform environment (or set of environments)—“for example, the ability to walk 100 metres on a level, well-lit, non-slippery surface.” This contrasts not only with the all-encompassing WHO-style accounts of health, but with health as performance in the individual’s current environment, such as the ability to walk up their own stairs.
If a person cannot climb stairs in her usual environment because the stairs are too steep, most people would not say that her health state had changed if the stairs were modified to be less steep. Likewise, we would not want to characterize the same cognitive impairment differently in two individuals simply because they have different vocations that call upon different types of cognitive tasks, and would not say that an individual with a hearing impairment is healthier simply because he avoids noisy gatherings. These examples point to a common-sense understanding of health that does not correspond to performance because it excludes the idiosyncrasies of an individual’s environment. This is consistent with the notion of health as an attribute of individuals rather than environments (though environments may have causal influence on a person’s health state). Note that here we clearly part company with those who would equate health with well-being or overall quality of life, since these latter constructs clearly do depend on local environmental barriers and facilitators. (Salomon et al., 2003)
The disability to be reflected in the disability weights is thus defined as the degree to which this capacity is absent. Salomon et al. (2003) recognise that the distinction between full health and disability is a normative and perhaps fuzzy one—having “full” mobility lies somewhere between hobbling 100 metres in an hour and running it in 10 seconds—so they leave it to intuition:
the threshold for a particular domain is the level of capacity below which people generally recognize decrements as departures from excellent health.
The developers further stress that DALY weights are not intended to reflect preferences. Recall that states were described in terms of “functional consequences and symptoms,” and that respondents were asked not which person’s life they would rather have, but which person was healthier. Salomon et al. (2003) point out that
the preferences that we may infer from techniques such as the time trade-off are likely to depend, at least in part, on assessments of health levels, but they may also reflect a range of other values and considerations that are distinct from the measurement of health levels.
This may help explain some seemingly bizarre features of the current DALY system; for example, terminal illness with constant, untreated pain has a disability weight of 0.569, compared to 0.540 for the same condition with pain medication—a statistically insignificant difference of just 2.9 percentage points.[35] Perhaps respondents felt they were similar in a functional sense.[36]
However, some have challenged the claim that disability weights measure health loss without evaluating it:
When people rank people with different kinds of health problems, they cannot avoid applying subjective value judgments of the importance of different dimensions of health. Disability weights should therefore be understood as valuations of health losses—ie, judgments of their undesirability—rather than quantifications. Quantification is simply without empirically verifiable meaning. (Nord, 2015)
Even Daniel Hausman, who has defended attempts to focus on health rather than wellbeing or quality of life, argues that health itself cannot be measured, and that disability weights must reflect assessments of the value of health states (Hausman, 2012).
Empirically, the jury seems to still be out on whether aiming to quantify health rather than HRQoL/preferences/utility really matters. As noted above, cost-effectiveness estimates appear to be broadly comparable when using DALYs and QALYs, but there have only been a handful of such studies. To my knowledge there has been no systematic comparison of DALY weights with, say, EQ-5D values for the same states.[37]
In terms of spillover effects, it seems plausible that, given the wording of the tasks, respondents focus even more on the individual patient than in QALY valuation. I’m not aware of any research on the role of other-regarding considerations in disability weight estimation, or the correlation between such weights and spillovers, though I haven’t looked extensively.
What’s wrong with QALYs and DALYs?
Most criticism of HALYs (and the HALY-maximizing principle implicit in most cost-effectiveness analysis), has come from three broad and overlapping camps:
Welfare economists, who aim to maximize the satisfaction of individual preferences that follow a specific set of axioms.
Extra-welfarists, who generally adopt a different unit of value (e.g. health or capability) and/or want to factor in distributional concerns.
Proponents of a wellbeing approach, who generally aim to maximize (or at least focus on) how well patients’ lives are going overall.
In this section, I briefly summarise each critique, then outline five problems that will be the focus of the rest of this series.
The welfarist critique
In a nutshell, welfarists (in the economic sense described above) complain that QALYs, and CEAs based on them, do not reflect the preferences of rational, self-interested utility-maximizers.
To understand this critique, it’s worth reminding ourselves that every component of the QALY (and analogous DALY) algorithm, Q × T × p × N (quality × time × probability × number of people), is on an interval scale:[38]
Q: An improvement in health from 0.2 to 0.4 is valued the same as 0.8 to 1.0.
T: An increase of 10 years at 0.5 is valued the same as an increase of 5 years in full health.
p: An increase in the probability of a gain of 10 years in full health from 0.1 to 0.2 is valued the same as from 0.8 to 0.9.
N: 100 people getting 2 QALYs is valued the same as 10 people getting 20 QALYs.
This is what allows straightforward comparison within and across individuals and populations.
For QALYs to represent individual preferences over health states, therefore, a number of assumptions are required:[39]
Utility independence: The value of Q does not affect the value of T, or vice versa, e.g., 1 year at 0.8 = 2 years at 0.4 = 8 years at 0.1.
Risk neutrality: Preferences are linear in probability, e.g., 10% chance of death + 90% chance of 1 QALY = 90% chance of death + 10% chance of 9 QALYs.
Additive separability: The value of a state is independent of the states that precede or follow it, e.g., 1 year at 0.5 then 2 years at 0.8 = 2 years at 0.8 then 1 year at 0.5.
“Principle Q”: A QALY has equal value regardless of who gets it, e.g., adding an extra year of life at 0.8 to the end of an 80-year life is the same as adding it to the end of a 20-year life.
Preferences do not not reliably meet these conditions at an individual level, and the extent to which they hold on aggregate is not entirely clear. For example, in some studies people were generally willing to trade off a greater proportion of life expectancy in the TTO (or accept a disproportionately higher risk of death in the standard gamble) to avoid longer periods in poor health (violating utility independence); or preferred a bad state followed by a good state over the reverse, even after accounting for discount rates (violating additive separability).[40] However, findings are not consistent across (the small number of) studies, and aggregate values perform better than each individual’s preferences, leading some to claim that QALYs are an adequate approximation of utility for the purposes of public decision-making (e.g., Tsuchiya & Dolan, 2005).[41]
For the welfarist, there are broader efficiency-related issues with using cost-per-HALY CEAs for resource allocation (Brazier, Ratcliffe, et al., 2017, ch. 3; Palmer & Torgerson, 1999). First, QALYs and DALYs do not normally capture all non-health benefits of healthcare, such as the productivity of the patient or family members, or even hard-to-quantify things we care about such as its effects on hobbies and relationships. This issue is discussed further below from a wellbeing perspective. Second, they cannot be used to attain allocative efficiency—the optimal distribution of resources across society. With reference to an opportunity-cost-based WTP threshold, it can, at most, help achieve technical efficiency—the best (health) outcomes given a fixed set of resources—but it tells us nothing about how big the budget should be for the various sectors. Third, some people are willing to pay more than others for a QALY, due to differences in income and/or preferences. Therefore, counting everyone’s health the same does not maximise utility in the welfarist sense, even within the health sector.[42]
The extra-welfarist critique
Extra-welfarists, on the other hand, generally think the QALY (and CEA more broadly) is currently too welfarist. Though extra-welfarism is ill-defined and encompasses a broad range of views, the uniting belief is that there is inherent value in things other than the satisfaction of individuals’ preferences (Brouwer et al., 2008). In practice, the most influential extra-welfarists have been rooted in the capabilities approach, and have generally advocated a focus on improving health or HRQoL (rather than utility) from the perspective of society as a whole (rather than individuals). Such ideas have certainly influenced the development of the QALY and agencies like NICE, for example, in the use of public (rather than patient) preferences and the exclusion of most non-health outcomes. (Coast, Smith, & Lorgelly, 2008)
However, most forms of the QALY are a long way from the metrics envisioned by extra-welfarists. For instance, studies have found relatively low correlation between QALYs and measures of capability (Mitchell et al., 2017). With one or two exceptions, NICE and other relevant decision-makers also endorse “Principle Q,” the idea that the social value of a unit of health is the same for all people in all contexts. This “QALY egalitarianism” is often challenged by welfarists on the grounds that WTP varies among individuals, but many extra-welfarists reject it for other reasons. For example, some have argued that more value should be attached to health gained by the young—those who have not yet had their “fair innings”—than by the elderly (Williams, 1997); by those in a worse initial state of health, or for larger individual health gains[43] (e.g., Nord, 2005); by those who were not responsible for their illness (e.g., Dworkin, 1981a, 1981b); by those at the end of life, as currently implemented by NICE; or by people of low socioeconomic status.[44] Thus, while the QALY is certainly not fully welfarist, nor does it fit any but the thinnest extra-welfarist theories.
The DALY is perhaps a little closer to some extra-welfarist ideas of what the unit of value should be: it does not attempt to measure utility, and adopts a definition of health with echoes of the capabilities literature. However, DALYs are generally given equal weight in both CEAs and GBD studies, and disability weights are mostly similar to the QALY equivalents, so in practice they may not bring us much closer to the extra-welfarist ideal.
The wellbeing critique
The third strand of criticism comes from those who prioritize wellbeing, understood broadly as how well one’s life is going. Theories of wellbeing are typically[45] divided into three camps:
Hedonism: Wellbeing consists in the balance of pleasure over pain, where pleasure is any positive mental state—anything that feels good, roughly speaking (excitement, joy, satisfaction, a sense of meaning, etc)—and pain is any negative mental state (physical pain, hopelessness, shame, sadness, anxiety, etc.). This is associated with the classical utilitarianism of Jeremy Bentham and John Stuart Mill, classical economics (mid-18th to late 19th century), Daniel Kahneman’s (1997) concept of “experienced utility,” and the measurement of affect (feelings, loosely speaking) in psychology. Example measures include the Positive and Negative Affect Schedule (PANAS) and some single-item questions like “Overall, how happy did you feel yesterday?” (from the ONS-4).
Desire theories: Wellbeing consists in the satisfaction of preferences or desires. This is linked with neoclassical (welfare) economics, which began defining utility/welfare in terms of preferences around 1900 (largely because they were easier to measure than hedonic states), preference utilitarianism, Kahneman’s (1997) “decision utility,” and the preference-based valuation methods described in this post.
Objective list theories: Wellbeing consists in the attainment of goods that do not consist in merely pleasurable experience nor in desire-satisfaction (though those can be on the list). According to some Aristotelean “perfectionist” accounts, people “flourish” to the extent they realize certain “virtues” (justice, courage, rationality, friendship, honor, pleasure, etc.). These have influenced some conceptions of psychological wellbeing,[46] and many extra-welfarist ideas. The capabilities approach also falls under this heading, though it stresses the importance of having the opportunity to do, be, or have certain things, rather than their attainment (e.g., Sen, 1985; Anand et al., 2009). For example, the ICECAP-A attempts to measure an ability to have attachment, stability, achievement, enjoyment, and autonomy (Al-Janabi, Flynn, & Coast, 2012).
The concept of subjective wellbeing (SWB) is perhaps even harder to pin down, but has been defined by the OECD (2013) as “how people think about and experience their lives.”[47] It is generally considered to have two components:[48]
Hedonic states, or affect. Sometimes positive and negative affect are treated separately, given evidence that these are independent (i.e., more positive affect may not imply less negative affect). This component maps conveniently onto the hedonic theory of wellbeing.
Cognitive evaluations, typically life satisfaction, which tries to capture an individual’s assessment of their life as a whole. This is agnostic about what makes life go well—respondents may consider happiness and misery, a sense of purpose, the opportunities available to them, and so on—which makes it hard to place theoretically. (Michael Plant has argued that it’s best interpreted as a form of desire theory, reflecting preferences about one’s life as a whole.)
In addition to the measures of affect noted above, SWB metrics include Cantril’s Ladder, as used in the World Happiness Reports; the Satisfaction with Life Scale; and the Warwick and Edinburgh Mental Wellbeing Scale. (For further examples, see OECD, 2013, Annex A. For a review of 99 wellbeing measures, not all of them for SWB, see Linton, Dieppe, and Medina-Lara, 2016.)
Clearly, there are many possible “wellbeing approaches” to economic evaluation and population health summary, defined both by the unit of value (hedonic states, preferences, objective lists, SWB) and by how they aggregate those units when calculating total value. Indeed, welfarism can be understood as a specific form of desire theory combined with a maximising principle (i.e., simple additive aggregation); and extra-welfarism, in some forms, is just an objective list theory plus equity (i.e., non-additive aggregation).
However, it seems that most advocates for the use of wellbeing in healthcare reject the narrow welfarist conception of utility, while retaining fairly standard, utility-maximising CEA methods—perhaps with some post-hoc adjustments to address particularly pressing distributional issues. So it seems reasonable to consider it a distinct (albeit heterogenous) perspective.
Core problems
The remainder of this section presents what I see as five interconnected problems with the versions of QALYs and DALYs most commonly employed in the last few years:
They neglect non-health consequences of health interventions.
They rely on poorly-informed judgements of the general public.
They fail to acknowledge extreme suffering (and happiness).
They capture some but not all spillover effects.
They are of little use in prioritising across sectors or cause areas.
For the purpose of exposition, I will assume that the objective is to maximise total SWB (remaining agnostic between affect, evaluations, or some combination). This is not because I am confident it’s the right goal; in fact, I think healthcare decision-making should probably, at least in public institutions, give some weight to other conceptions of wellbeing, and perhaps to distributional concerns such as fairness. One reason to do so is normative uncertainty—we can’t be sure that the quasi-utilitarianism implied by that approach is correct—but it’s also a pragmatic response to the diversity of opinions among stakeholders and the challenges of obtaining good SWB measurements, as discussed in later posts.
However, I am fairly confident that SWB-maximization—or indeed any sensible wellbeing-focused strategy—would be an improvement over current practice, so it seems like a reasonable foundation on which to build. Moreover, most of these criticisms should hold considerable force from a welfarist, extra-welfarist, or simply “common sense” perspective. One certainly does not have to be a die-hard utilitarian to appreciate that reform is needed.
Problem 1: Neglect of non-health consequences
As Tessa Peasgood once said, “When we die, we don’t only lose our EQ-5D score.” QALYs and DALYs are used to make life and death decisions, but we can be healthy and miserable at the same time, or have a lot of health problems yet still have a good life, so they are not a very good proxy for what ultimately matters. For illustration, the EQ-5D explains about 25% of the variance on SWB scales (Richardson et al., 2015), and a QALY (i.e., a move from 0 to 1 on the scale) is only equivalent to about 2.3 points on a 0–10 life satisfaction scale (Huang et al., 2018).
That HALYs only measure health (or health-related quality of life) may not sound like much of a criticism, as they were only intended to be used for evaluating healthcare. But health interventions also have important non-health consequences. For instance, chemotherapy can do quite well in terms of the EQ-5D, but can seriously harm other things we care about, like family life and a sense of self-worth (Lemieux, Maunsell, & Provencher, 2008). When such effects are not taken into account, the cost-effectiveness of interventions will be misestimated, leading to inefficient use of resources.
In theory, people could take these non-health effects into account when valuing states, in which case HALY weights would capture something close to the total (predicted) effect of a health state on wellbeing. However, the limited available evidence suggests people valuing health states do not generally put a lot of weight on non-health factors, perhaps because the choice of dimensions draws attention to health effects. This relates to the second problem:
Problem 2: Ill-informed preferences
Preferences in time tradeoff and similar tasks, especially preferences of the general public who do not have experience of the condition being evaluated, do not closely match the experiences of people with the condition. This is partly because when people are answering these questions they tend to focus on the health state being valued, rather than other aspects of life that may be unaffected or even enhanced, like relationships or work. In particular, they focus on the most vivid, easily-imagined aspects of the condition, such as having reduced mobility, and neglect potentially more important domains of health like anxiety. (Dolan, 2008; Dolan & Kahneman, 2007)
They also tend to focus on the transition to that state, such as first losing mobility, rather than their life some months or years down the line. People who lose SWB due to a health problem often feel better over time, either by overcoming the practical limitations (such as learning to use a walking stick or wheelchair) or by simply getting used to it such that it no longer bothers them so much, a process known as hedonic adaptation (Dolan, 2008; Dolan & Kahneman, 2007). To be clear, studies have found widely varying degrees of adaptation to disability (Cubí-Mollá, Jofre-Bonet, & Serra-Sastre, 2017; Howley & O’Neill, 2018; Lucas, 2007; Luhmann & Intelisano, 2018; Oswald & Powdthavee, 2008; Powdthavee, 2009), so it should not be assumed that such problems are not important from a SWB perspective. However, the literature on affective forecasting—our ability to predict our future hedonic states—suggests that people tend to overestimate the loss of SWB due to many events, especially loss of mobility (e.g., Gilbert & Wilson, 2000; Karimi et al., 2017; De Wit, Busschbach, & De Charro, 2000).
In contrast, people tend to underestimate the SWB loss from at least some mental disorders. While mental health and SWB are separate concepts, conditions such as anxiety and depression cause unhappiness almost by definition, making them inherently resistant to hedonic adaptation. Plausibly, respondents without experience of mental health issues also struggle to imagine what it’s like to experience these states, perhaps equating depression with “feeling low,” for example.[49] So it’s unsurprising that, in contrast to physical health problems, people with direct experience of such conditions tend to report more severe values than the general public (e.g., Pyne et al., 2009; Schaffer et al., 2002; Papageorgiou et al., 2015).
While DALY valuations do not ask for preferences as such, it’s reasonable to suppose that disability weights based on hypothetical judgements of which person is healthier suffer from similar problems. This assumption is supported by the similarity of QALY and DALY values for most states, and the existence of implausible pairs of weights, such as the remarkably similar values for treated and untreated cancer presented above.
Problem 3: Neglect of extreme suffering (and happiness)
Due in part to Problems 1 and 2, I think current metrics do a bad job of capturing the most severe suffering. As mentioned above, the DALY does not even admit states worse than dead. This might make sense if you’re trying to measure health in a functional sense, as you can’t function any worse than when you’re dead, but it doesn’t make sense if you’re trying to measure wellbeing or even preferences. The QALY isn’t much better in this regard, with minimum values between −0.59 (for the EQ-5D-3L) and +0.29 (for the first version of the SF-6D).[50] As discussed in Parts 2 and 4, respondents often indicate that they’d give lower weights, but either they are prevented from doing so by the structure of the valuation task (e.g., limits on the amount of time they can trade) or extreme values are arbitrarily transformed at the analysis stage. The difficulty of imagining extremely poor states is likely to be another reason why general population values tend to be too high in some cases.
To me, this seems like a major problem—perhaps the greatest flaw in HALYs at the moment. Reasons for thinking the scale should go down far below −1 will be discussed in more depth in Part 4, but I find simple thought experiments quite compelling. For instance, suppose you are confined to bed with constant, extreme physical pain—say, due to untreated cancer, which is common in some parts of the world (Knaul et al., 2017)—and you are experiencing severe depression, described in the DALY system as follows:
has overwhelming, constant sadness and cannot function in daily life. The person sometimes loses touch with reality and wants to harm or kill himself or herself
How many days of ordinary life in full health—which, let’s remember, may not even be happy life—would you give up to avoid one day of this? For me, it would be somewhere between several days and several weeks, which implies a QALY weight between about −5 and −50. Experiences unrelated to healthcare, such as severe torture, can be even worse.
On the other hand, current health-focused value sets seem to wrongly categorise some states as worse than dead. In a Swedish study, 46% of people in a state worse than dead, as judged using the UK EQ-5D-3L value set, reported themselves to be “quite satisfied,” “satisfied,” or even “very satisfied” with their lives overall (Bernfort et al., 2018). As noted in Problem 2, this disparity between QALY score and SWB may arise because the respondents to valuation tasks tend to imagine physical limitations will cause more suffering than in fact they do.
Note that, by focusing on health (Problems 1 and 2), QALYs and DALYs also fail to capture positive experiences. Two people in perfect health can have very different overall SWB—say, 5⁄10 versus 10/10—and current metrics generally give no additional weight to interventions that bring pleasure, joy, or satisfaction beyond relief of illness or disability. I suspect this is less of a problem than their neglect of extreme suffering (e.g., because the worst experiences are probably much more intense, longer-lasting, and more amenable to intervention than the best ones), but it’s worth bearing in mind.
So, relative to SWB, it seems that some states are greatly overvalued and others significantly undervalued. This is likely to cause major errors in priority setting, and therefore an inefficient allocation of resources.
Problem 4: Neglect of spillover effects
Some difficulties with interpreting QALYs and DALYs have already been mentioned, such as the extent to which they reflect individual preferences, own-state (e.g., patient) versus public preferences, various conceptions of equity, and non-health outcomes for the patient. One area that seems to be relatively neglected is effects beyond the individual whose health is being assessed. Health problems, and therefore interventions, can greatly affect family members, carers, and wider society through various mechanisms—psychological burden, productivity, crime, and so on—and it’s important to measure these spillovers if the aim is to do as much good as possible with the available resources.
It seems to be generally assumed that HALYs only capture self-regarding preferences. However, there is some evidence that people valuing health states take into account other factors, especially impact on relatives (e.g., Baker & Robinson, 2004; Karimi, Brazier, & Paisley, 2017). These may be especially salient when choosing between “immediate death” and living in a very poor state: in qualitative studies alongside valuation tasks, respondents often say things like “I wouldn’t want immediate death as I’d want time to say goodbye to my family,” or “I’d want to stick around for the sake of my kids.” (This may help explain the high values for some terrible states.) On the other hand, it seems reasonable to assume health state values do not fully reflect the consequences for the rest of society—something that would be impossible for most respondents to predict, even if they were wholly altruistic.
The appropriate response is unclear. As discussed in Parts 2 and 6, ignoring benefits beyond the patient will often skew priorities, but adjusting for them separately, such as by putting a monetary value on carer time, risks “double counting.” This further limits the usefulness of the current metrics.
Problem 5: Limited to health applications
Problems 1–4 greatly hinder priority setting within the health sector. In economic terms, they prevent the achievement of technical efficiency—the most good possible within a fixed budget.
But perhaps more importantly, decisions need to be made about how to distribute resources across sectors and cause areas, including the size of each budget. Recall that NICE’s full name is the National Institute of Health and Care Excellence, as its remit includes social care as well. The current QALY is almost useless for allocating resources across even these two putatively similar domains (except when the main impact of the social intervention being considered is improved health or life expectancy), let alone in education, transport, and other sectors of government. Within effective altruism, HALYs are not very useful when choosing between, say, cash transfers and malaria prevention, and still less between broad cause areas like global poverty and existential risk. In other words, achieving allocative efficiency (the optimal distribution of all resources), or even making some much more modest steps towards technical efficiency, cannot be done with such a limited metric (Brazier & Tsuchiya, 2015).
This is largely because of their exclusive focus on health outcomes—the same primary cause as Problem 1. However, it also relates to Problems 2–4; for example, interventions in some sectors are likely to have broader spillover effects, in general, than in other sectors, making like-for-like comparisons difficult until we have a better grasp of what the metrics capture, and how to account for things they don’t.
What are the alternatives?
The table below summarizes three alternative kinds of QALY/DALY in terms of structure, descriptive system, valuation method, application, and interpretation. The red text represents departures from the current forms. To be clear, all of the names except WELBY are my own, and they do not represent “natural kinds”: the QALY+ is “just” a QALY with a different health utility instrument and/or valuation method, the sQALY is “just” a QALY with that uses SWB to value the health instrument, the WELBY is “just” a QALY that uses a wellbeing measure in place of a health measure, and so on. I find these labels useful for thinking about the various options, but other typologies are possible.
The rest of the posts in this series will examine these options in more depth, so here I just provide a brief description of each.
1. The HALY+
The QALY+ (“QALY plus”) and DALY+ are basically the same as the current metrics but with a few incremental improvements. They have the potential to capture more of what matters within healthcare, without requiring radical reforms that would be unpopular among stakeholders such as NICE, clinicians, and patients.
Structure: The scale is most likely below −1 (or >2 for the DALY) to reflect the severity of the worst states. The ultimate lower bound will depend on various factors, such as which instrument is chosen, what assumptions are made about the (a)symmetry of positive and negative experiences, and the valuation methods and respondents.
Description: Its classification system covers domains beyond health, and in particular concepts related to SWB. The E-QALY (“extending the QALY”) is perhaps the most promising MAUI of all as it includes dimensions of wellbeing, but this is still under development. Almost anything is better than the EQ-5D, including the second most popular MAUI, the SF-6D. Another option is to create a new measure, or create a preference-based value set for an existing non-preference-based questionnaire that covers elements of health and wellbeing, but this would be a major undertaking.
Valuation: The use of own-state preferences should be considered, as these may capture the severity of a state better than preferences of the general public, though some combination of the two may be optimal or necessary. The choice of methodology—standard gamble, TTO, visual analog scale, discrete choices, etc.—can also affect the resulting weights, though this seems less important than other decisions.
Application: The E-QALY is explicitly designed for use in social care as well as health, allowing us to compare, for example, the cost-effectiveness of treating cancer and preventing domestic abuse. Some other measures, notably the Assessment of Quality of Life, contain enough psychosocial dimensions to be usable for some non-healthcare purposes as well. But it’s perhaps unlikely to be useful for higher-level prioritization across all sectors or cause areas.
Interpretation: There may be ways of modifying the valuation and/or descriptions to ensure preferences are entirely self-regarding, or alternatively to capture as many spillovers as possible. At any rate, research can be done to pin down what in fact the chosen measure measures, so that appropriate adjustments can be made.
Research priorities for developing the HALY+ are discussed further in Part 2.
2. The sHALY
The sQALY (“subjective wellbeing-based QALY”) or sDALY keeps a health-focused descriptive system but assigns values to health states using (proxies for) the SWB of people currently experiencing the condition.[51]
Structure: The scale is probably extended below −1 (or above >2), though the actual lower bound will depend on various factors.
Description: A “QALY+” MAUI like the E-QALY would perhaps be ideal, but this could be done with an existing instrument like the EQ-5D, or within the current DALY structure.
Valuation: Health states are valued using SWB (life satisfaction, affect, or some combination) rather than preferences. Ideally, a large longitudinal survey would ask participants to describe their health (e.g., 11121 on the EQ-5D), and also to report their SWB. The change in wellbeing associated with a given change in health state becomes the utility weight for that health state. For instance, if going from full health to moderate depression causes a drop from 10 to 6 on a happiness scale (where 0 is dead and 10 is maximum happiness) then the weight for moderate depression is 0.4. For the QALY, preliminary work along these lines has already been done based on the SF-6D and EQ-5D-3L, but little progress has been made towards a sDALY.
Application: Like current metrics, this could be used to measure the effectiveness of healthcare and burden of illness, but in terms of their consequences for SWB. Depending on the descriptive system chosen, it may also work for some non-health domains such as social care. But there is strong resistance from key stakeholders to the use of subjective wellbeing, as well as some significant technical and financial challenges.
Interpretation: This should tell us how bad a health state is for “experienced utility.” As with the other options, more research is needed to establish what influences people’s responses to the SWB questions (e.g., the extent to which responses are affected by the SWB of people around the respondent), the extent to which it is possible to ensure only the desired construct is measured (e.g., self-regarding individual SWB), and the best methods for capturing spillover effects (e.g., surveying family/community members).
Possible methods for attaching SWB scores to health states are discussed further in Part 3. Parts Parts 4–7 are relevant to the choice of SWB scale, which influences the structure.
3. The WELBY
The wellbeing-adjusted life-year (WELBY) dispenses with anything specific to a particular domain (e.g., health, social care), instead taking its values more or less directly from wellbeing scales (subjective or otherwise).[52]
Structure: As with the other approaches, the bottom of the range will depend on some methodological choices and on the judgements of survey respondents, but ideally will be far lower than −1 on a QALY-type scale. Establishing the point on a wellbeing scale that is equivalent to being dead (the zero point on a QALY/WELBY scale) is a significant challenge. Also, while the WELBY itself is interval-scaled by stipulation, wellbeing scores may need to be adjusted for non-linearity when converting to WELBYs (e.g., a change from 0⁄10 to 1⁄10 life satisfaction may represent a bigger or smaller change in wellbeing than 9⁄10 to 10⁄10).
Description/valuation: A “pure” WELBY does not distinguish between description and valuation; the thing being valued is whatever makes life valuable. Though “objective” measures like cortisol levels, patterns of movement, heart rate and even brain waves are slowly emerging, for the time being we may have to rely on self-reports of life satisfaction and/or affect. The choice of measure is likely to be important.
Application: In principle this can be used for evaluating projects in almost any domain—healthcare, education, catastrophic risk mitigation, and so on—but its suitability for some purposes has been questioned, e.g., it may not be sensitive to small changes in health. Like HALYs, it could also be used to summarise the amount of (lost) wellbeing in a population by comparing with a hypothetical maximum, and potentially attribute losses to particular causes.
Interpretation: In theory, a WELBY would represent how well someone’s life is going for them, i.e., individual wellbeing. However, it faces similar interpretation challenges as the other option, e.g., regarding spillovers.
A “preference-based WELBY” (pWELBY) differs only in that it uses a method like TTO to assign weights to points on a wellbeing scale. By defining an improvement in wellbeing (as measured by the wellbeing scale) in terms of time, this can establish the dead point (in the same way as the regular QALY) and overcome any non-linearity; for instance, people may be willing to trade more life expectancy for a unit of improvement near the bottom (more severe end) of the scale. Of course, this also introduces many of the biases and interpretation difficulties of the existing preference-based measures.
Challenges in creating or optimising the WELBY metric are presented in Parts 4–7, though to some extent these are relevant to the HALY+ and sHALY as well.
Conclusions
Health-adjusted life-years have—rightly, in my view—come to dominate health economic evaluation and population health summaries. By employing a generic health state classification system, QALYs and DALYs can be used to compare across a wide variety of health conditions, and by anchoring to “full health” and “dead” they can capture both life-extending and life-improving outcomes.
However, they’ve been criticised from a number of angles. Proponents of modern welfare economics complain that they do not fully reflect the preferences of rational, self-interested utility maximizers, while “extra-welfarists” think they should embody values such as equity and capability. From a wellbeing perspective, which I tentatively endorse, it’s also clear that they are a poor guide to “experienced utility.” In particular, I’ve argued that they have five important flaws:
They only capture health outcomes, whereas health problems (and healthcare) affect many other aspects of life that we care about. This is due primarily to the narrow health-focused descriptive system, but also to “focusing effects” during the valuation process, which draws attention to functional aspects of health rather than dimensions that may matter more.
The weights do not reflect the actual severity of health states, generally overestimating the badness (in terms of subjective wellbeing) of physical health problems, while underestimating the importance of mental health. Again, this is due to both the emphasis on physical functioning in the descriptions and the difficulty of predicting the impact of hypothetical health states on long-term wellbeing.
They fail to capture extreme suffering. In the case of the DALY, this is partly because of a conscious effort to measure disability in a functional sense (which cannot be worse than when you’re dead). For the QALY, weights are arbitrarily bounded not far below “dead,” largely for analytical convenience and the (clearly mistaken) belief that lower values are implausible. There are also problems at the top of the scale, as HALYs do not acknowledge positive experiences beyond the absence of health problems.
They capture some but not all spillover effects. Health problems and treatments have consequences far beyond the individual patient, and it isn’t clear to what extent these are captured by HALYs, making them hard to interpret.
They are only applicable to a narrow range of scenarios. Due to problems 1–4, they are sub-optimal for evaluating health interventions that have significant non-health effects (either on the patient or others), or in cases of severe suffering; but they are even less useful for prioritising across sectors or cause areas, which is arguably more important.
To address some of these problems, I’ve presented three general alternatives to existing measures:
The HALY+, which makes incremental improvements to the current health-focused descriptive systems and/or valuation methods, while retaining preference-based weights.
The sHALY, which replaces preference-based weights with the “experienced utility” associated with health states, using measures of subjective wellbeing.
The WELBY, which uses “pure” wellbeing measures that are theoretically applicable in all domains.
The remaining posts in this series highlight some key challenges in developing those metrics, work that has been done on them so far, potential applications to major real-world problems, and specific topics that could be the focus of additional research. Progress in this area could lead to more efficient allocation of resources by public institutions, and perhaps also by the effective altruism community.
Credits
This post is a project of Rethink Priorities. It was written by Derek Foster. Thanks to Julian Jamison, David Rhys Bernard, Jason Schukraft, Paul Frijters, Michael Aird, Janique Behman, Peter Hurford, Neil Dullaghan, Joel McGuire, David Moss, and Michael Plant for helpful feedback on previous drafts. If you like our work, please consider subscribing to our newsletter. You can see all our work to date here.
References
Aballéa, S., & Tsuchiya, A. (2007). Seeing for yourself: Feasibility study towards valuing visual impairment using simulation spectacles. Health Economics, 16(5), 537–543. https://ideas.repec.org/a/wly/hlthec/v16y2007i5p537-543.html
Airoldi, M., & Morton, A. (2009). Adjusting life for quality or disability: Stylistic difference or substantial dispute? Health Economics, 18(11), 1237–1247. https://doi.org/10.1002/hec.1424
Al-Janabi, H., N Flynn, T., & Coast, J. (2012). Development of a self-report measure of capability wellbeing for adults: The ICECAP-A. Quality of Life Research, 21(1), 167–176. https://doi.org/10.1007/s11136-011-9927-2
Anand, P., Hunter, G., Carter, I., Dowding, K., Guala, F., & Hees, M. V. (2009). The development of capability indicators. Journal of Human Development and Capabilities, 10(1), 125–152. https://doi.org/10.1080/14649880802675366
Anand, S., & Hanson, K. (1997). Disability-adjusted life years: A critical review. Journal of Health Economics, 16(6), 685–702. https://doi.org/10.1016/S0167-6296(97)00005-2
Anand, S., & Hanson, K. (1998). DALYs: Efficiency versus equity. World Development, 26(2), 307–310. https://doi.org/10.1016/S0305-750X(97)10019-5
Anand, S., & Reddy, S. G. (2019). The construction of the DALY: Implications and anomalies (SSRN Scholarly Paper ID 3451311). Social Science Research Network. https://doi.org/10.2139/ssrn.3451311
Augustovski, F., Colantonio, L. D., Galante, J., Bardach, A., Caporale, J. E., Zárate, V., Hsiang Chuang, L., Pichon-Riviere, A., & Kind, P. (2018). Measuring the benefits of healthcare: Dalys and qalys – does the choice of measure matter? A case study of two preventive interventions. International Journal of Health Policy and Management, 7(2), 120–136. https://doi.org/10.15171/ijhpm.2017.47
Baker, R., & Robinson, A. (2004). Responses to standard gambles: Are preferences ‘well constructed’? Health Economics, 13(1), 37–48. https://doi.org/10.1002/hec.795
Bass, E. B., Steinberg, E. P., Pitt, H. A., Griffiths, R. I., Lillemoe, K. D., Saba, G. P., & Johns, C. (2016). Comparison of the rating scale and the standard gamble in measuring patient preferences for outcomes of gallstone disease. Medical Decision Making. https://doi.org/10.1177/0272989X9401400401
Bernfort, L., Gerdle, B., Husberg, M., & Levin, L.-Å. (2018). People in states worse than dead according to the EQ-5D UK value set: Would they rather be dead? Quality of Life Research, 27(7), 1827–1833. https://doi.org/10.1007/s11136-018-1848-x
Birch, S., & Donaldson, C. (2003). Valuing the benefits and costs of health care programmes: Where’s the ‘extra’ in extra-welfarism? Social Science & Medicine, 56(5), 1121–1133. https://doi.org/10.1016/S0277-9536(02)00101-6
Bowling, A. (2005). Measuring health: A review of quality of life measurement scales. Open University Press.
Bravo Vergel, Y., & Sculpher, M. (2008). Quality-adjusted life years. Practical Neurology, 8(3), 175–182. https://doi.org/10.1136/pn.2007.140186
Brazier, J., Ara, R., Rowen, D., & Chevrou-Severac, H. (2017). A review of generic preference-based measures for use in cost-effectiveness models. PharmacoEconomics, 35(1), 21–31. https://doi.org/10.1007/s40273-017-0545-x
Brazier, J., Ratcliffe, J., Salomon, J. A., & Tsuchiya, A. (2017). Measuring and valuing health benefits for economic evaluation. https://doi.org/10.1093/med/9780198725923.001.0001
Brazier, J., Roberts, J., & Deverill, M. (2002). The estimation of a preference-based measure of health from the SF-36. Journal of Health Economics, 21(2), 271–292. https://doi.org/10.1016/S0167-6296(01)00130-8
Brazier, J., & Tsuchiya, A. (2015). Improving cross-sector comparisons: Going beyond the health-related QALY. Applied Health Economics and Health Policy, 13(6), 557–565. https://doi.org/10.1007/s40258-015-0194-1
Brouwer, W. B. F., Culyer, A. J., van Exel, N. J. A., & Rutten, F. F. H. (2008). Welfarism vs. Extra-welfarism. Journal of Health Economics, 27(2), 325–338. https://doi.org/10.1016/j.jhealeco.2007.07.003
Buchanan, J., & Wordsworth, S. (2015). Welfarism versus extra-welfarism: Can the choice of economic evaluation approach impact on the adoption decisions recommended by economic evaluation studies? PharmacoEconomics, 33(6), 571–579. https://doi.org/10.1007/s40273-015-0261-3
Burstein, R., Fleming, T., Haagsma, J., Salomon, J. A., Vos, T., & Murray, C. JL. (2015). Estimating distributions of health state severity for the global burden of disease study. Population Health Metrics, 13. https://doi.org/10.1186/s12963-015-0064-y
Campbell, S. M. (2015). When the shape of a life matters. Ethical Theory and Moral Practice, 18(3), 565–575. https://doi.org/10.1007/s10677-014-9540-x
Chen, A., Jacobsen, K. H., Deshmukh, A. A., & Cantor, S. B. (2015). The evolution of the disability-adjusted life year (DALY). Socio-Economic Planning Sciences, 49, 10–15. https://doi.org/10.1016/j.seps.2014.12.002
Claxton, K., Martin, S., Soares, M., Rice, N., Spackman, E., Hinde, S., Devlin, N., Smith, P. C., & Sculpher, M. (2015). Methods for the estimation of the National Institute for Health and Care Excellence cost-effectiveness threshold. Health Technology Assessment, 19(14), 1–503, v–vi. https://doi.org/10.3310/hta19140
Claxton, K. P., Revill, P., Sculpher, M., Wilkinson, T., Cairns, J., & Briggs, A. (2014). The Gates reference case for economic evaluation. The Bill and Melinda Gates Foundation.
Coast, J., Smith, R. D., & Lorgelly, P. (2008). Welfarism, extra-welfarism and capability: The spread of ideas in health economics. Social Science & Medicine, 67(7), 1190–1198. https://doi.org/10.1016/j.socscimed.2008.06.027
Cubí‐Mollá, P., Jofre‐Bonet, M., & Serra‐Sastre, V. (2017). Adaptation to health states: Sick yet better off? Health Economics, 26(12), 1826–1843. https://doi.org/10.1002/hec.3509
Culyer, A. J., & Chalkidou, K. (2019). Economic evaluation for health investments en route to universal health coverage: Cost-benefit analysis or cost-effectiveness analysis? Value in Health, 22(1), 99–103. https://doi.org/10.1016/j.jval.2018.06.005
David, P. H. (2013). Introduction to use of health impact metrics for programmatic decision making in global health. BMC Public Health, 13(2), S1. https://doi.org/10.1186/1471-2458-13-S2-S1
Devleesschauwer, B., Havelaar, A. H., Maertens de Noordhout, C., Haagsma, J. A., Praet, N., Dorny, P., Duchateau, L., Torgerson, P. R., Van Oyen, H., & Speybroeck, N. (2014). DALY calculation in practice: A stepwise approach. International Journal of Public Health, 59(3), 571–574. https://doi.org/10.1007/s00038-014-0553-y
Devlin, N. J., Shah, K. K., Feng, Y., Mulhern, B., & Hout, B. van. (2018). Valuing health-related quality of life: An EQ-5D-5L value set for England. Health Economics, 27(1), 7–22. https://doi.org/10.1002/hec.3564
Diener, E., Oishi, S., & Lucas, R. E. (2009). Subjective well-being: The science of happiness and life satisfaction. In Oxford handbook of positive psychology, 2nd ed (pp. 187–194). Oxford University Press.
Dolan, P. (1997). Modeling valuations for EuroQol health states. Medical Care, 35(11), 1095–1108. https://doi.org/10.1097/00005650-199711000-00002
Dolan, Paul. (2008). Developing methods that really do value the ‘Q’ in the QALY. Health Economics, Policy and Law, 3(1), 69–77. https://doi.org/10.1017/S1744133107004355
Dolan, Paul, & Kahneman, D. (2008). Interpretations of utility and their implications for the valuation of health. The Economic Journal, 118(525), 215–234. https://doi.org/10.1111/j.1468-0297.2007.02110.x
Drummond, M., Brixner, D., Gold, M., Kind, P., McGuire, A., & Nord, E. (2009). Toward a consensus on the QALY. Value in Health, 12, S31–S35. https://doi.org/10.1111/j.1524-4733.2009.00522.x
Drummond, M. F., Sculpher, M. J., Claxton, K., Stoddart, G. L., & Torrance, G. W. (2015). Methods for the economic evaluation of health care programmes (Fourth Edition). Oxford University Press.
Dworkin, R. (1981a). What is equality? Part 1: equality of welfare. Philosophy & Public Affairs, 10(3), 185–246. https://www.jstor.org/stable/2264894
Dworkin, R. (1981b). What is equality? Part 2: equality of resources. Philosophy & Public Affairs, 10(4), 283–345. https://www.jstor.org/stable/2265047
Edejer, T. T.-T. (Ed.). (2003). Making choices in health: WHO guide to cost-effectiveness analysis. World Health Organization.
Feng, X., Kim, D. D., Cohen, J. T., Neumann, P. J., & Ollendorf, D. A. (2020). Using QALYs versus DALYs to measure cost-effectiveness: How much does it matter? International Journal of Technology Assessment in Health Care, 36(2), 96–103. https://doi.org/10.1017/S0266462320000124
Gilbert, D. T., & Wilson, T. D. (2000). Miswanting: Some problems in the forecasting of future affective states. Cambridge University Press. https://dash.harvard.edu/handle/1/14549983
Glassman, A., Chalkidou, K., Giedion, U., Teerawattananon, Y., Tunis, S., Bump, J. B., & Pichon-Riviere, A. (2012). Priority-setting institutions in health: Recommendations from a center for global development working group. Global Heart, 7(1), 13–34. https://doi.org/10.1016/j.gheart.2012.01.007
Green, C., Brazier, J., & Deverill, M. (2000). Valuing health-related quality of life. PharmacoEconomics, 17(2), 151–165. https://doi.org/10.2165/00019053-200017020-00004
Gu, Y., Lancsar, E., Ghijben, P., Butler, J. R., & Donaldson, C. (2015). Attributes and weights in health care priority setting: A systematic review of what counts and to what extent. Social Science & Medicine, 146, 41–52. https://doi.org/10.1016/j.socscimed.2015.10.005
Harvey, C. M., & Østerdal, L. P. (2010). Cardinal scales for health evaluation. Decision Analysis, 7(3), 256–281. https://doi.org/10.1287/deca.1100.0181
Hausman, D. M. (2012a). Health, well-being, and measuring the burden of disease. Population Health Metrics, 10(1), 13. https://doi.org/10.1186/1478-7954-10-13
Hausman, D. M. (2012b). Health, naturalism, and functional efficiency. Philosophy of Science, 79(4), 519–541. https://doi.org/10.1086/668005
Hausman, D. M. (2014). Health and functional efficiency. The Journal of Medicine and Philosophy, 39(6), 634–647. https://doi.org/10.1093/jmp/jhu036
Hernandez Alava, M., Pudney, S., & Wailoo, A. (2020). The EQ-5D-5L value set for England: Findings of a quality assurance program. Value in Health: The Journal of the International Society for Pharmacoeconomics and Outcomes Research, 23(5), 642–648. https://doi.org/10.1016/j.jval.2019.10.017
Hernandez Alava, M., Wailoo, A., Grimm, S., Pudney, S., Gomes, M., Sadique, Z., Meads, D., O’Dwyer, J., Barton, G., & Irvine, L. (2018). EQ-5D-5L versus EQ-5D-3L: The impact on cost effectiveness in the United Kingdom. Value in Health, 21(1), 49–56. https://doi.org/10.1016/j.jval.2017.09.004
Horton, S. (2017). Cost-effectiveness analysis in Disease Control Priorities, third edition. In D. T. Jamison, H. Gelband, S. Horton, P. Jha, R. Laxminarayan, C. N. Mock, & R. Nugent (Eds.), Disease Control Priorities: Improving Health and Reducing Poverty (3rd ed.). The International Bank for Reconstruction and Development / The World Bank. http://www.ncbi.nlm.nih.gov/books/NBK525287/
Howley, P., & O’Neill, S. (2018). Prevention is better than cure: The legacy effects of ill-health on psychological well-being (SSRN Scholarly Paper ID 3184842). Social Science Research Network. https://doi.org/10.2139/ssrn.3184842
Huang, L., Frijters, P., Dalziel, K., & Clarke, P. (2018). Life satisfaction, QALYs, and the monetary value of health. Social Science & Medicine, 211, 131–136. https://doi.org/10.1016/j.socscimed.2018.06.009
Hutubessy, R., Chisholm, D., & Edejer, T. T.-T. (2003). Generalized cost-effectiveness analysis for national-level priority-setting in the health sector. Cost Effectiveness and Resource Allocation, 1(1), 8. https://doi.org/10.1186/1478-7547-1-8
Kahneman, D., Wakker, P. P., & Sarin, R. (1997). Back to Bentham? Explorations of experienced utility. The Quarterly Journal of Economics, 112(2), 375–406. https://doi.org/10.1162/003355397555235
Karimi, M., Brazier, J., & Paisley, S. (2017a). How do individuals value health states? A qualitative investigation. Social Science & Medicine (1982), 172, 80–88. https://doi.org/10.1016/j.socscimed.2016.11.027
Karimi, M., Brazier, J., & Paisley, S. (2017b). Are preferences over health states informed? Health and Quality of Life Outcomes, 15(1), 105. https://doi.org/10.1186/s12955-017-0678-9
Karimi, Milad, & Brazier, J. (2016). Health, health-related quality of life, and quality of life: What is the difference? PharmacoEconomics, 34(7), 645–649. https://doi.org/10.1007/s40273-016-0389-9
Kind, P., Lafata, J. E., Matuszewski, K., & Raisch, D. (2009). The use of QALYs in clinical and patient decision-making: Issues and prospects. Value in Health, 12, S27–S30. https://doi.org/10.1111/j.1524-4733.2009.00519.x
Knaul, F. M., Farmer, P. E., Krakauer, E. L., Lima, L. D., Bhadelia, A., Kwete, X. J., Arreola-Ornelas, H., Gómez-Dantés, O., Rodriguez, N. M., Alleyne, G. A. O., Connor, S. R., Hunter, D. J., Lohman, D., Radbruch, L., Madrigal, M. del R. S., Atun, R., Foley, K. M., Frenk, J., Jamison, D. T., … Zimmerman, C. (2018). Alleviating the access abyss in palliative care and pain relief—an imperative of universal health coverage: The Lancet Commission report. The Lancet, 391(10128), 1391–1454. https://doi.org/10.1016/S0140-6736(17)32513-8
Krol, M., Attema, A. E., Exel, J. van, & Brouwer, W. (2015). Altruistic preferences in time tradeoff: Consideration of effects on others in health state valuations. Medical Decision Making. https://doi.org/10.1177/0272989X15615870
Lemieux, J., Maunsell, E., & Provencher, L. (2008). Chemotherapy-induced alopecia and effects on quality of life among women with breast cancer: A literature review. Psycho-Oncology, 17(4), 317–328. https://doi.org/10.1002/pon.1245
Lenert, L. A., Sturley, A. P., Rapaport, M. H., Chavez, S., Mohr, P. E., & Rupnow, M. (2004). Public preferences for health states with schizophrenia and a mapping function to estimate utilities from positive and negative symptom scale scores. Schizophrenia Research, 71(1), 155–165. https://doi.org/10.1016/j.schres.2003.10.010
Linton, M.-J., Dieppe, P., & Medina-Lara, A. (2016). Review of 99 self-report measures for assessing well-being in adults: Exploring dimensions of well-being and developments over time. BMJ Open, 6(7), e010641. https://doi.org/10.1136/bmjopen-2015-010641
Longfield, K., Smith, B., Gray, R., Ngamkitpaiboon, L., & Vielot, N. (2013). Putting health metrics into practice: Using the disability-adjusted life year for strategic decision making. BMC Public Health, 13(2), S2. https://doi.org/10.1186/1471-2458-13-S2-S2
Longworth, L., Yang, Y., Young, T., Mulhern, B., Alava, M. H., Mukuria, C., Rowen, D., Tosh, J., Tsuchiya, A., Evans, P., Keetharuth, A. D., Brazier, J., Longworth, L., Yang, Y., Young, T., Mulhern, B., Alava, M. H., Mukuria, C., Rowen, D., … Brazier, J. (2014). Use of generic and condition-specific measures of health-related quality of life in NICE decision-making: A systematic review, statistical modelling and survey. NIHR Journals Library. https://njl-admin.nihr.ac.uk/document/download/2002508
Lovett, R., & Cooper, S. (2019, October 24). NICE to support new valuation study for England for EQ-5D-5L questionnaire. National Institute for Health & Care Excellence. https://www.nice.org.uk/news/blog/nice-to-support-new-valuation-study-for-england-for-eq-5d-5l-questionnaire
Lozano, R., Fullman, N., Mumford, J. E., Knight, M., Barthelemy, C. M., Abbafati, C., Abbastabar, H., Abd-Allah, F., Abdollahi, M., Abedi, A., Abolhassani, H., Abosetugn, A. E., Abreu, L. G., Abrigo, M. R. M., Abu Haimed, A. K., Abushouk, A. I., Adabi, M., Adebayo, O. M., Adekanmbi, V., … Murray, C. J. L. (2020). Measuring universal health coverage based on an index of effective coverage of health services in 204 countries and territories, 1990–2019: A systematic analysis for the Global Burden of Disease Study 2019. The Lancet, 396(10258), 1250–1284. https://doi.org/10.1016/S0140-6736(20)30750-9
Lucas, R. E. (2016). Adaptation and the set-point model of subjective well-being: Does happiness change after major life events? Current Directions in Psychological Science. https://journals.sagepub.com/doi/10.1111/j.1467-8721.2007.00479.x
Luhmann, M., & Intelisano, S. (2018). Hedonic adaptation and the set point for subjective well-being. In Handbook of wellbeing. DEF Publishers. https://www.nobascholar.com/books/1
Maertens de Noordhout, C., Devleesschauwer, B., Gielens, L., Plasmans, M. H. D., Haagsma, J. A., & Speybroeck, N. (2017). Mapping EQ-5D utilities to GBD 2010 and GBD 2013 disability weights: Results of two pilot studies in Belgium. Archives of Public Health, 75(1), 6. https://doi.org/10.1186/s13690-017-0174-z
Mehrez, A., & Gafni, A. (1989). Quality-adjusted life years, utility theory, and healthy-years equivalents. Medical Decision Making: An International Journal of the Society for Medical Decision Making, 9(2), 142–149. https://doi.org/10.1177/0272989X8900900209
Mehrez, Abraham, & Gafni, A. (1991). The healthy-years equivalents: How to measure them using the standard gamble approach. Medical Decision Making. https://doi.org/10.1177/0272989X9101100212
Mitchell, P. M., Venkatapuram, S., Richardson, J., Iezzi, A., & Coast, J. (2017). Are quality-adjusted life years a good proxy measure of individual capabilities? PharmacoEconomics, 35(6), 637–646. https://doi.org/10.1007/s40273-017-0495-3
Montagu, D., Ngamkitpaiboon, L., Duvall, S., & Ratcliffe, A. (2013). Applying the disability-adjusted life year to track health impact of social franchise programs in low- and middle-income countries. BMC Public Health, 13(2), S4. https://doi.org/10.1186/1471-2458-13-S2-S4
Mulhern, B., Feng, Y., Shah, K., Janssen, M. F., Herdman, M., van Hout, B., & Devlin, N. (2018). Comparing the UK EQ-5D-3L and English EQ-5D-5L value sets. PharmacoEconomics, 36(6), 699–713. https://doi.org/10.1007/s40273-018-0628-3
Mulhern, B. J., Bansback, N., Norman, R., Brazier, J., & Group, on behalf of the S.-6Dv2 I. P. (2020). Valuing the SF-6Dv2 classification system in the United Kingdom using a discrete-choice experiment with duration. Medical Care, 58(6), 566–573. https://doi.org/10.1097/MLR.0000000000001324
Mulhern, B., Smith, S. C., Rowen, D., Brazier, J. E., Knapp, M., Lamping, D. L., Loftus, V., Young, T. A., Howard, R. J., & Banerjee, S. (2012). Improving the measurement of QALYs in dementia: Developing patient- and carer-reported health state classification systems using rasch analysis. Value in Health, 15(2), 323–333. https://doi.org/10.1016/j.jval.2011.09.006
Murray, C. J. (1994). Quantifying the burden of disease: The technical basis for disability-adjusted life years. Bulletin of the World Health Organization, 72(3), 429–445. https://www.ncbi.nlm.nih.gov/pmc/articles/PMC2486718/
Murray, C. J. L. (Ed.). (1996). The global burden of disease: A comprehensive assessment of mortality and disability from diseases, injuries, and risk factors in 1990 and projected to 2020: summary. Harvard School of Public Health [u.a.].
Murray, C. J. L., & Acharya, A. K. (1997). Understanding DALYs. Journal of Health Economics, 16(6), 703–730. https://doi.org/10.1016/S0167-6296(97)00004-0
Murray, C. J. L., Aravkin, A. Y., Zheng, P., Abbafati, C., Abbas, K. M., Abbasi-Kangevari, M., Abd-Allah, F., Abdelalim, A., Abdollahi, M., Abdollahpour, I., Abegaz, K. H., Abolhassani, H., Aboyans, V., Abreu, L. G., Abrigo, M. R. M., Abualhasan, A., Abu-Raddad, L. J., Abushouk, A. I., Adabi, M., … Lim, S. S. (2020). Global burden of 87 risk factors in 204 countries and territories, 1990–2019: A systematic analysis for the Global Burden of Disease Study 2019. The Lancet, 396(10258), 1223–1249. https://doi.org/10.1016/S0140-6736(20)30752-2
Murray, C. J. L., & Evans, D. B. (Eds.). (2003). Health systems performance assessment: Debates, methods and empiricism (1st edition). World Health Organization.
Murray, C. J., Salomon, J. A., & Mathers, C. (2000). A critical examination of summary measures of population health. Bulletin of the World Health Organization, 78(8), 981–994.
Neumann, P. J., Goldie, S. J., & Weinstein, M. C. (2000). Preference-based measures in economic evaluation in health care. Annual Review of Public Health, 21(1), 587–611. https://doi.org/10.1146/annurev.publhealth.21.1.587
NICE. (2013). Guide to the methods of technology appraisal. National Institute of Health & Care Excellence. https://www.nice.org.uk/process/pmg9/chapter/the-reference-case#measuring-and-valuing-health-effects
NICE. (2019). Position statement on use of the EQ-5D-5L value set for England. National Institute of Health & Care Excellence. https://www.nice.org.uk/about/what-we-do/our-programmes/nice-guidance/technology-appraisal-guidance/eq-5d-5l
Nord, E. (1992). An alternative to QALYs: The saved young life equivalent (SAVE). BMJ (Clinical Research Ed.), 305(6858), 875–877. https://doi.org/10.1136/bmj.305.6858.875
Nord, Erik. (2005). Concerns for the worse off: Fair innings versus severity. Social Science & Medicine, 60(2), 257–263. https://doi.org/10.1016/j.socscimed.2004.05.003
Nord, Erik. (2015). Uncertainties about disability weights for the Global Burden of Disease study. The Lancet Global Health, 3(11), e661–e662. https://doi.org/10.1016/S2214-109X(15)00189-8
O’Mahony, J. F. (2020). Does cost-effectiveness analysis really need to abandon the incremental cost-effectiveness ratio to embrace net benefit? PharmacoEconomics, 38(8), 777–779. https://doi.org/10.1007/s40273-020-00931-5
Oppe, M., Rand-Hendriksen, K., Shah, K., Ramos‐Goñi, J. M., & Luo, N. (2016). EuroQol protocols for time trade-off valuation of health outcomes. Pharmacoeconomics, 34(10), 993–1004. https://doi.org/10.1007/s40273-016-0404-1
Organisation for Economic Co-operation and Development. (2013). OECD guidelines on measuring subjective well-being. OECD Publishing. http://www.ncbi.nlm.nih.gov/books/NBK189560/
Oswald, A. J., & Powdthavee, N. (2008). Does happiness adapt? A longitudinal study of disability with implications for economists and judges. Journal of Public Economics, 92(5), 1061–1077. https://doi.org/10.1016/j.jpubeco.2008.01.002
Palmer, S., & Torgerson, D. J. (1999). Definitions of efficiency. BMJ, 318(7191), 1136. https://doi.org/10.1136/bmj.318.7191.1136
Papageorgiou, K., Vermeulen, K. M., Schroevers, M. J., Stiggelbout, A. M., Buskens, E., Krabbe, P. F. M., van den Heuvel, E., & Ranchor, A. V. (2015). Do individuals with and without depression value depression differently? And if so, why? Quality of Life Research, 24(11), 2565–2575. https://doi.org/10.1007/s11136-015-1018-3
Patrick, D. L., Starks, H. E., Cain, K. C., Uhlmann, R. F., & Pearlman, R. A. (2016). Measuring preferences for health states worse than death. Medical Decision Making. https://doi.org/10.1177/0272989X9401400102
Paulden, M. (2017). Recent amendments to NICE’s value-based assessment of health technologies: Implicitly inequitable? Expert Review of Pharmacoeconomics & Outcomes Research, 17(3), 239–242. https://doi.org/10.1080/14737167.2017.1330152
Paulden, M. (2020a). Calculating and interpreting ICERs and net benefit. PharmacoEconomics, 38(8), 785–807. https://doi.org/10.1007/s40273-020-00914-6
Paulden, M. (2020b). Why it’s time to abandon the ICER. PharmacoEconomics, 38(8), 781–784. https://doi.org/10.1007/s40273-020-00915-5
Powdthavee, N. (2009). What happens to people before and after disability? Focusing effects, lead effects, and adaptation in different areas of life. Social Science & Medicine, 69(12), 1834–1844. https://doi.org/10.1016/j.socscimed.2009.09.023
Pyne, J. M., Fortney, J. C., Tripathi, S., Feeny, D., Ubel, P., & Brazier, J. (2009). How bad is depression? Preference score estimates from depressed patients and the general population. Health Services Research, 44(4), 1406–1423. https://doi.org/10.1111/j.1475-6773.2009.00974.x
Revicki, D. A., Shakespeare, A., & Kind, P. (1996). Preferences for schizophrenia-related health states: A comparison of patients, caregivers and psychiatrists. International Clinical Psychopharmacology, 11(2), 101–108.
Richardson, J., Chen, G., Khan, M. A., & Iezzi, A. (2015). Can multi-attribute utility instruments adequately account for subjective well-being?: Medical Decision Making. https://doi.org/10.1177/0272989X14567354
Richardson, J. R. J., & Hawthorne, G. (2001). Negative utility scores and evaluating the AQoL all worst health state. Centre for Health Program Evaluation.
Rowen, D., Azzabi Zouraq, I., Chevrou-Severac, H., & van Hout, B. (2017). International regulations and recommendations for utility data for health technology assessment. PharmacoEconomics, 35(1), 11–19. https://doi.org/10.1007/s40273-017-0544-y
Rowen, D., Brazier, J., Young, T., Gaugris, S., Craig, B. M., King, M. T., & Velikova, G. (2011). Deriving a preference-based measure for cancer using the eortc QLQ-C30. Value in Health, 14(5), 721–731. https://doi.org/10.1016/j.jval.2011.01.004
Ryff, C. D. (1989). Happiness is everything, or is it? Explorations on the meaning of psychological well-being. Journal of Personality and Social Psychology, 57(6), 1069–1081. https://doi.org/10.1037/0022-3514.57.6.1069
Salkeld, G., Ameratunga, S. N., Cameron, I. D., Cumming, R. G., Easter, S., Seymour, J., Kurrle, S. E., Quine, S., & Brown, P. M. (2000). Quality of life related to fear of falling and hip fracture in older women: A time trade off study. BMJ, 320(7231), 341–346. https://doi.org/10.1136/bmj.320.7231.341
Salomon, J. A., Haagsma, J. A., Davis, A., de Noordhout, C. M., Polinder, S., Havelaar, A. H., Cassini, A., Devleesschauwer, B., Kretzschmar, M., Speybroeck, N., Murray, C. J. L., & Vos, T. (2015). Disability weights for the Global Burden of Disease 2013 study. The Lancet Global Health, 3(11), e712–e723. https://doi.org/10.1016/S2214-109X(15)00069-8
Salomon, J. A., Vos, T., Hogan, D. R., Gagnon, M., Naghavi, M., Mokdad, A., Begum, N., Shah, R., Karyana, M., Kosen, S., Farje, M. R., Moncada, G., Dutta, A., Sazawal, S., Dyer, A., Seiler, J., Aboyans, V., Baker, L., Baxter, A., … Murray, C. J. (2012). Common values in assessing health outcomes from disease and injury: Disability weights measurement study for the Global Burden of Disease Study 2010. The Lancet, 380(9859), 2129–2143. https://doi.org/10.1016/S0140-6736(12)61680-8
Sánchez‐Iriso, E., Rodríguez, M. E., & Hita, J. M. C. (2019). Valuing health using EQ-5D: The impact of chronic diseases on the stock of health. Health Economics, 28(12), 1402–1417. https://doi.org/10.1002/hec.3952
Sassi, F. (2006). Calculating QALYs, comparing QALY and DALY calculations. Health Policy and Planning, 21(5), 402–408. https://doi.org/10.1093/heapol/czl018
Schaffer, A., Levitt, A. J., Hershkop, S. K., Oh, P., MacDonald, C., & Lanctot, K. (2002). Utility scores of symptom profiles in major depression. Psychiatry Research, 110(2), 189–197. https://doi.org/10.1016/S0165-1781(02)00097-5
Sen, A. (1985). Commodities and capabilities. North-Holland.
Tsuchiya, A., & Dolan, P. (2005). The QALY model and individual preferences for health states and health profiles over time: A systematic review of the literature. Medical Decision Making, 25(4), 460–467. https://doi.org/10.1177/0272989X05276854
van Hout, B., Mulhern, B., Feng, Y., Shah, K., & Devlin, N. (2020). The EQ-5D-5L value set for england: Response to the “quality assurance.” Value in Health: The Journal of the International Society for Pharmacoeconomics and Outcomes Research, 23(5), 649–655. https://doi.org/10.1016/j.jval.2019.10.013
Vollset, S. E., Goren, E., Yuan, C.-W., Cao, J., Smith, A. E., Hsiao, T., Bisignano, C., Azhar, G. S., Castro, E., Chalek, J., Dolgert, A. J., Frank, T., Fukutaki, K., Hay, S. I., Lozano, R., Mokdad, A. H., Nandakumar, V., Pierce, M., Pletcher, M., … Murray, C. J. L. (2020). Fertility, mortality, migration, and population scenarios for 195 countries and territories from 2017 to 2100: A forecasting analysis for the Global Burden of Disease Study. The Lancet, 396(10258), 1285–1306. https://doi.org/10.1016/S0140-6736(20)30677-2
Vos, T., Lim, S. S., Abbafati, C., Abbas, K. M., Abbasi, M., Abbasifard, M., Abbasi-Kangevari, M., Abbastabar, H., Abd-Allah, F., Abdelalim, A., Abdollahi, M., Abdollahpour, I., Abolhassani, H., Aboyans, V., Abrams, E. M., Abreu, L. G., Abrigo, M. R. M., Abu-Raddad, L. J., Abushouk, A. I., … Murray, C. J. L. (2020). Global burden of 369 diseases and injuries in 204 countries and territories, 1990–2019: A systematic analysis for the Global Burden of Disease Study 2019. The Lancet, 396(10258), 1204–1222. https://doi.org/10.1016/S0140-6736(20)30925-9
Wang, H., Abbas, K. M., Abbasifard, M., Abbasi-Kangevari, M., Abbastabar, H., Abd-Allah, F., Abdelalim, A., Abolhassani, H., Abreu, L. G., Abrigo, M. R. M., Abushouk, A. I., Adabi, M., Adair, T., Adebayo, O. M., Adedeji, I. A., Adekanmbi, V., Adeoye, A. M., Adetokunboh, O. O., Advani, S. M., … Murray, C. J. L. (2020). Global age-sex-specific fertility, mortality, healthy life expectancy (HALE), and population estimates in 204 countries and territories, 1950–2019: A comprehensive demographic analysis for the Global Burden of Disease Study 2019. The Lancet, 396(10258), 1160–1203. https://doi.org/10.1016/S0140-6736(20)30977-6
Whitehead, S. J., & Ali, S. (2010). Health outcomes in economic evaluation: The QALY and utilities. British Medical Bulletin, 96(1), 5–21. https://doi.org/10.1093/bmb/ldq033
Williams, A. (1995). A measurement and validation of health: A chronicle. In Working Papers (No. 136chedp; Working Papers). Centre for Health Economics, University of York. https://ideas.repec.org/p/chy/respap/136chedp.html
Williams, A. (1997). Intergenerational equity: An exploration of the “fair innings” argument. Health Economics, 6(2), 117–132. https://doi.org/10.1002/(SICI)1099-1050(199703)6:2<117::AID-HEC256>3.0.CO;2-B
Wit, G. A. D., Busschbach, J. J. V., & Charro, F. T. D. (2000). Sensitivity and perspective in the valuation of health status: Whose values count? Health Economics, 9(2), 109–126. https://doi.org/10.1002/(SICI)1099-1050(200003)9:2<109::AID-HEC503>3.0.CO;2-L
Woodard, C. (2013). Classifying theories of welfare. Philosophical Studies, 165(3), 787–803. https://doi.org/10.1007/s11098-012-9978-4
Yang, H., Duvall, S., Ratcliffe, A., Jeffries, D., & Stevens, W. (2013). Modeling health impact of global health programs implemented by Population Services International. BMC Public Health, 13(2), S3. https://doi.org/10.1186/1471-2458-13-S2-S3
Yang, Y., Brazier, J., & Tsuchiya, A. (2013). Effect of adding a sleep dimension to the EQ-5D descriptive system: A “bolt-on” experiment. Medical Decision Making. https://doi.org/10.1177/0272989X13480428
Zhao, Y., Feng, H., Qu, J., Luo, X., Ma, W., & Tian, J. (2018). A systematic review of pharmacoeconomic guidelines. Journal of Medical Economics, 21(1), 85–96. https://doi.org/10.1080/13696998.2017.1387118
Notes
- ↩︎
Note that this series is not intended to constitute a comprehensive research agenda, but rather to highlight a selection of topics that do not seem to be getting as much attention as they deserve. I’ve excluded some related topics that were on my original list but that have been raised elsewhere; these mostly relate to methods for cost-effectiveness analysis (e.g., issues around discounting, value of information, spillover effects, moral uncertainty, and eliciting probability distributions) and practical issues in resource allocation (e.g., evaluating mental health charities). Before embarking on any of the projects in this series, I strongly suggest having a look at the research agendas of the Global Priorities Institute and Happier Lives Institute, Michael Plant’s DPhil thesis, and relevant academic literature. I’ve nevertheless decided to include a few topics similar to ones in the above documents when they seemed too important to leave out, or when I had a slightly different angle. My hope is that this sequence of posts will help clarify research priorities, potentially leading to a more concrete list of “next steps.”
- ↩︎
The terms HALY+ and sHALY are my own inventions, and reflect a very subjective typology of possible metrics. Ideas for catchier names and better typologies are welcome.
- ↩︎
I have not tried to give numerical scores to the topics or fully establish their relative priorities, for several reasons:
Many topics are logically dependent on solutions to other topics, so it would be misleading to rank them in order of priority. Where this is the case, the topics are provided in roughly sequential order.
I am highly uncertain about the importance, tractability, and/or neglectedness (ITN) of many topics, so any numerical scores may be so uncertain as to be essentially worthless.
Many topics have several sub-problems and/or more than one potential solution, the I, T and/or N of which varies.
There are potential conceptual issues with the ITN approach, especially when applied to solutions rather than problems (see this recent post for a summary).
Scoring or fully prioritising these topics would have considerably increased the time investment in these posts, which were only supposed to be a small side-project alongside my main work.
Instead, I’ve used the ITN framework primarily as an opportunity to highlight caveats with my suggestions, lest these posts be read as excessively bullish.
- ↩︎
Several other HALYs have been suggested, including the healthy-years equivalent (HYE; Mehraz & Gafni, 1989) and the saved-young-life equivalent (SAVE; Nord, 1992), but only QALYs and DALYs are in common use.
- ↩︎
Journal articles covering the basics of QALYs and DALYs include Neumann, Goldie, & Weinstein (2000), Sassi (2006), Vergel and Sculpher (2008), Whitehead and Ali (2010), and Chen et al. (2015). However, much of their content is somewhat out of date, e.g., they mostly refer to a pre-2010 version of the DALY with age weighting, and do not discuss recent developments in QALY valuation, such as discrete choice experiments. Perhaps more importantly, they don’t walk the reader through the process for estimating weights, which must be understood in order to fully grasp the source of the problems. For an up-to-date guide to calculating and interpreting incremental cost-effectiveness ratios and net benefit, see Paulden (2020a)—but that is more about methods for cost-effectiveness analysis than outcome metrics themselves.
- ↩︎
For a more comprehensive understanding of these issues, albeit with a strong QALY focus, two books are indispensable:
Brazier, J., Ratcliffe, J., Salomon, J., & Tsuchiya, A. (2017). Measuring and Valuing Health Benefits for Economic Evaluation (2nd edition). Oxford University Press.
Drummond, M. F. (2015). Methods for the Economic Evaluation of Health Care Programmes (4th edition). Oxford University Press.
This post (and the next) relies heavily on the first of these in particular. I’m not aware of anything comparable for DALYs and health technology assessment in low- and middle-income countries, but these papers are good background reading:
Chen, A., Jacobsen, K. H., Deshmukh, A. A., & Cantor, S. B. (2015). The evolution of the disability-adjusted life year (DALY). Socio-Economic Planning Sciences, 49, 10–15.https://doi.org/10.1016/j.seps.2014.12.002
Glassman, A., Chalkidou, K., Giedion, U., Teerawattananon, Y., Tunis, S., Bump, J. B., & Pichon-Riviere, A. (2012). Priority-setting institutions in health: Recommendations from a center for global development working group. Global Heart, 7(1), 13–34. https://doi.org/10.1016/j.gheart.2012.01.007
- ↩︎
An interval scale has equal increments, e.g., there is the same “distance” between 1 and 2 as between 7 and 8. My understanding is that, when discussing utility, cardinal just means “on an interval scale.” However, it’s surprisingly hard to find a precise yet non-technical definition of that term, and usage seems to vary (Harvey & Østerdal, 2010), so I will generally stick to standard psychometric terminology to describe scales (nominal, ordinal, interval, ratio).
A ratio scale is an interval scale with a non-arbitrary zero point, e.g., mass is ratio (it’s meaningful to say something has no mass) but temperature in Celsius or Fahrenheit isn’t. The QALY is generally considered to be on a ratio scale, despite negative values being possible, because at zero (dead) there is no HRQoL—although interpretations differ and I’ve seen it argued that it’s merely interval.
- ↩︎
When combined with a preference-based valuation method (discussed below), MAUIs are known as generic preference-based measures (for a review see Brazier, Ara, et al., 2017).
- ↩︎
In approximate order of popularity, the most common ones are:
EuroQol Five-Dimension (EQ-5D). The first, three-level version (EQ-5D-3L) is slowly being supplanted by the EQ-5D-5L.
Short-Form Six-Dimension (SF-6D). A substantially revised Version 2 was released in 2020 (Brazier, Mulhern, et al., 2020; Mulhern et al., 2020).
Health Utility Index (HUI), in three versions: HUI1, HUI2, HUI3.
Assessment of Quality of Life (AQoL), with varying numbers of dimensions: AQoL-4D, −6D, −7D, and −8D.
Quality of Well-Being scale (QWB).
Some of these are discussed further in Part 2.
- ↩︎
The EQ-5D-5L was introduced in 2009 to overcome the EQ-5D-3L’s relatively poor sensitivity (inability to detect small changes) and “ceiling” effects (inability to detect minor health problems). The five-level version generally produces higher (healthier) values (Mulhern et al., 2018), has a higher minimum value (-0.285 versus −0.594), determines that fewer states (5.1% versus 34.6%) are “worse than dead” (Devlin et al., 2018), and generally records smaller improvements from interventions, making them seem less cost-effective (Alava et al., 2017). NICE continues to recommend the EQ-5D-3L due to concerns about the quality of the EQ-5D-5L value set for England (NICE, 2019a; Alava, Pudney, & Wailoo, 2020; van Hout et al., 2020). A new valuation study is due to be completed in mid-2021, after which NICE may switch to the EQ-5D-5L (NICE2019b).
- ↩︎
This is the self-complete paper version. It is also available for smartphones, tablets, laptops/desktops, administration by an interviewer, and completion by a proxy (e.g., the carer of someone with severe mental or physical disabilities).
- ↩︎
The EQ-5D questionnaire also includes a visual analog scale (EQ-VAS), on which patients can record their own overall health on a scale from 0 (“The worse health you can imagine”) to 100 (“The best health you can imagine”). This part is not normally used to obtain QALY weights so I don’t discuss it here, though the VAS is explained further in Part 2.
- ↩︎
The person tradeoff is rarely used in QALY estimation, in part because it is heavily influenced by framing effects (e.g., Nord, 1995; Doctor, Miyamoto, & Bleichrodt, 2009). I include it on this list because a similar kind of question is used to anchor DALY weights to 0 and 1 (as described in the next section), and because some effective altruists have used a similar approach for other purposes (e.g., Althaus, 2018). It is discussed further in Part 2.
- ↩︎
See Oppe et al. (2016) for a comparison of three TTO protocols produced by the EuroQol Group: the MVH, Paris, and EQ-VT protocols.
- ↩︎
This is initially done in one-year increments, and sometimes the point of indifference lies on a one-year interval. But if the preference is reversed (i.e., Jack changes from preferring Life A to Life B, or vice versa, after adding or subtracting a year), six months is added or subtracted to get the mid-point between the durations, and he is asked again. If he is still not indifferent, the point of indifference is assumed to lie mid-way between the relevant time points (i.e., three months is added or subtracted). For further details of the iteration scheme, see Oppe et al. (2016), Figure 5 (appendix).
- ↩︎
The utility of the best state would normally be estimated as one minus the constant, but on the QALY scale 11111 (no health problems) by definition takes the value 1, so the constant is only subtracted from states other than full health. The N3 term is used because of discontinuity in the data: when any dimension is at level 3, the utility is much lower.
- ↩︎
I think there is a simple error in this formula. Using (x/10) – 1 would mean that the severity order for states worse than dead would be reversed: states originally furthest from zero (most severe) become the closest, e.g. (9.75/10) – 1 = −0.025, but (1/10) – 1 = −0.9. I think it’s supposed to be (t/10) – 1, where t is the time in the target state; or equivalently ([10 – x]/10) – 1.
- ↩︎
CEAs using HALYs are sometimes called cost-utility analyses (CUAs). However, CEA is more common and avoids the controversy over whether HALYs reflect utility in some technical sense, as discussed below. Note that CEA is different from cost-benefit analysis (CBA), which expresses both costs and outcomes in monetary terms, usually based on assessments of willingness to pay per unit of health.
- ↩︎
Incremental here just means “additional” or “compared to the next best alternative.” The ICER is often contrasted with the average cost-effectiveness ratio (ACER), which is just the absolute costs divided by the absolute benefits. This implicitly assumes a counterfactual of no intervention (or current practice), and is therefore often misleading.
- ↩︎
Note that the current NICE threshold is £20–30,000 (with some exceptions, mentioned later), but the actual opportunity cost has been estimated at more like £13,000 in 2008 expenditure (Claxton et al., 2015), suggesting some NICE-approved interventions do more harm than good.
- ↩︎
Often the “do nothing” or “usual care” option is the implicit comparator, with other treatments using figures for the additional costs and QALYs, e.g., the QALYs gained relative to no treatment. In that case, net benefit greater than zero indicates cost-effectiveness.
- ↩︎
Karimi and Brazier (2016) identified four uses of HRQoL in the literature:
Functioning (the ability to do certain activities) and wellbeing as it relates to physical, mental, and social domains of health
The health aspects of QoL
The aspects of QoL affected by health or healthcare
The value of health states
They argue that (1) and (2) add little to common definitions of health, most notably the WHO’s. (3) is hard to distinguish from QoL, as health (and healthcare) can affect all aspects of life. (4) is helpfully distinct from both health and QoL, but the authors note that in practice the term HRQoL is used for health state descriptions (such as “11122” on the EQ-5D), not only for the “utilities” attached to them. Since classification systems like the EQ-5D roughly fit WHO-style definitions of health, it may be more accurate to say the questionnaires (as distinct from the values assigned to the results) capture self-perceived health status, rather than HRQoL.
- ↩︎
I’m actually a bit uncertain about this, e.g., the person tradeoff (which is rarely used for the QALY) is sometimes advocated because it (often) requires respondents to take the perspective of an objective decision maker. In principle, an MAUI or other descriptive system could also include other-regarding effects, such as being a burden on others, though I don’t think I’ve seen one that does. So the assumptions or intentions may vary somewhat depending on particular methodological choices, but the most common methods seem to focus on the individual patient.
- ↩︎
- ↩︎
It is also unclear that states worse than dead would make sense without changing the conceptual basis of the DALY. As discussed below, it currently aims to measure health, defined (roughly) as the capacity to perform normal activities. Whereas one can plausibly have negative welfare, it is hard to see how one can have less capacity than when dead.
- ↩︎
Again, the DALY developers don’t seem to use this term, perhaps because they are much shorter than most vignettes.
- ↩︎
Developers of the DALY claim that disability weights measure health loss, without valuing it in the sense of representing its degree of undesirability. This is discussed in the Interpretation section below.
- ↩︎
These are not described as discrete choice experiments in the DALY literature. I’m not sure why; perhaps it’s to avoid jargon, or perhaps because discrete choice experiments usually seek to place options on a latent utility scale, i.e., assign a value, whereas the DALY aims to measure health (rather than assign a value to it). Related issues are discussed in the Interpretation section below.
- ↩︎
A complete example (for distance vision blindness versus severe neck pain) is shown below:
Now, we want to learn how people compare different health problems.
A person’s health may limit how well parts of his body or his mind works. As a result, some people are not able to do all of the things in life that others may do, and some people are more severely limited than others.
I am going to ask you a series of questions about different health problems. In each question I will describe two different people to you. You should imagine that these two people have the same number of years left to live, and that they will experience the health problems that I describe for the rest of their lives. I will ask you to tell me which person you think is healthier overall, in terms of having fewer physical or mental limitations on what they can do in life.
Some of the questions may be easy to answer, while others may be harder. There are no right or wrong answers to these questions. Instead we are interested in finding out your personal views.
The first person is completely blind, which causes great difficulty in some daily activities, worry and anxiety, and great difficulty going outside the home without assistance.
The second person has constant neck pain and arm pain, and difficulty turning the head, holding arms up, and lifting things. The person gets headaches, sleeps poorly, and feels tired and worried.
Who do you think is healthier overall, the first person or the second person?
- ↩︎
From Salomon et al. (2012):
Responses to paired comparisons of health states were summarised with heat maps that provided a visual display of the choice probabilities over each possible pair of states—ie, the probability that the first state in the pair was chosen by the respondent as being the healthier of the two outcomes. To examine differences between health states on a quantitative scale, we ran probit regression analyses on the choice responses, including indicator variables for each state that took the value 1 if the state was chosen as the healthier option in a paired comparison, −1 if the state was the non-chosen alternative, and 0 for all health states other than the pair being considered. This model is equivalent to standard approaches to analysis of paired comparison data, by which the probability of a particular choice response is expressed as a function of the difference between the scale values for the two options.
See the appendix of that paper for more detail.
- ↩︎
From Salomon et al. (2012):
Responses to population health equivalence questions were modelled with censored regression. To anchor the results from the probit regression analysis on the disability weight scale ranging from zero to one, we first ran a linear regression of the probit coefficients from the pooled analysis on disability weight estimates derived from the population health equivalence responses. On the basis of previous empirical evidence indicating that disability weights are well characterised by a logit-normal distribution, we undertook the rescaling in logit-transformed space. We then used numerical integration to obtain mean estimates of disability weights on the natural zero-to-one scale. First, we simulated normal random variates on the logit scale with means defined by the rescaled probit coefficients and variance by the standard deviation across survey-specific estimates. Then we transformed each of these simulated values through an inverse-logit function. Finally, we computed the mean across the resulting values for each health state. To estimate uncertainty intervals around the mean disability weights, we drew 1000 bootstrap samples from the pooled dataset and repeated the estimation steps for each sample.
See the appendix of that paper for more detail.
- ↩︎
As with DALY-based CEAs, these are sometimes called cost-utility analyses, but the use of “utility” is even more questionable in this case, as discussed later in this section.
- ↩︎
This link is to the 2017 version. I can’t find a 2019 version, but I would expect life expectancy to have only increased slightly. The relevant paper (Vos et al., 2020, Appendix 1, p. 56) uses the exact same text to describe the table as the 2017 version, so they may not have updated this in the calculations: “the lowest observed age-specific mortality rates by location and sex across all estimation years from all locations with populations over 5 million in 2016” (note the ambiguity of “in 2016″—it’s unclear whether it refers only to the population figures or also the mortality rates).
- ↩︎
As noted previously, early versions of the DALY/GBD typically applied age weighting that assigned more value to averting disability among young adults, and time discounting that gave greater weight to sooner benefits. This naturally affected the comparability of QALY and DALY cost-effectiveness estimates (e.g., Augustovsky, 2018; Sassi, 2006). However, age weighting and discounting were dropped in GBD 2010 in response to equity-based criticisms (e.g., Anand & Hanson, 1997, 1998). The choice of reference age (which determines life expectancy at death) can also affect calculations (Airoldi & Morton, 2008); but again, the current version of the DALY/GBD, with a constant reference age regardless of context-specific life expectancy, avoids this alleged problem (though see Anand & Reddy, 2019 for a critique of this approach).
- ↩︎
This was first brought to my attention by Clare Donaldson.
- ↩︎
It is also possible that even the mention of “constant pain” in the treated state, and the ambiguity over the effectiveness of the “strong medication,” raised the weight. See Problem 1 and Problem 2 later in the post for discussion of focussing effects and related phenomena.
- ↩︎
Maertens de Noordhout et al. (2017) did run two small pilot studies to explore the possibility of mapping from EQ-5D-5L utilities to DALY disability weights. The one with face-to-face administration of the EQ-5D-5L to public health students, in the presence of a study leader, performed quite well, but online administration in a general population sample did not. Overall, EQ-5D responses gave more severe weights to musculoskeletal disorders such as leg amputation, but less to conditions with more subjective symptoms, such as migraine. Burnstein et al. (2015) also mapped from scores on the SF-12 health questionnaire to DALY weights. Since the SF-12 can also be used to obtain SF-6D utilities, this seems to open up the possibility of mapping between QALYs and DALYs. This will be discussed in more detail in Part 3, in the context of creating a wellbeing-weighted DALY.
- ↩︎
This list is copied almost verbatim from a lecture slide by John Brazier.
- ↩︎
The exact assumptions required are in dispute. See Tsuchiya & Dolan (2005) for a review.
- ↩︎
This ties in with philosophical literature on the “shape of life” (e.g., Campbell, 2015), i.e., whether it’s better to have a life that starts poorly and gets better or starts well and gets worse.
- ↩︎
Others have argued they should be replaced by healthy years equivalents (HYE), in which entire health profiles (sequences of states) are valued, rather than individual states (Mehraz & Gafni, 1989, 1991). For instance, the utility of
(a) six years of depression, followed by three years of full health, followed by 10 years of reduced mobility
can be compared with
(b) 10 years of reduced mobility, then three years of depression, then three years of full health.
HYEs thus allow for a utility function that accounts for interactions between quality, time, and order, but have the obvious disadvantage that only a small proportion of the infinite number of possible profiles could ever be valued. (For a discussion, see Brazier, Ratcliffe, et al., 2017, pp. 40–43.)
- ↩︎
One possible response is to revert to cost-benefit analysis (CBA), which puts both costs and outcomes in monetary terms. This can value benefits, including HALYs, using a human capital approach (lost future earnings), revealed preferences (how much people in fact pay for the benefit in the market), or contingent valuation (how much they are hypothetically willing to pay to avoid a problem, or willing to accept to experience it). It is considered the theoretically preferable approach by welfarists, because it can in principle be used across all sectors to achieve allocative efficiency. However, it’s difficult to operationalize in healthcare for several reasons, e.g.:
Lost earnings do not account for all harms from ill health (which rules out the human capital approach).
There is no market in many health “goods,” especially in countries with a national health service (which poses challenges for revealed preferences).
Like other stated preference methods, WTP studies are difficult to frame in a way that captures both health and non-health effects without creating focusing effects (drawing attention to certain aspects of life) or double counting (e.g., valuing income changes as both costs and benefits).
Using all three approaches, the value of benefits vary widely according to income/wealth, which has major equity implications (e.g., treatment for conditions that disproportionately affect poor people are likely to seem less cost-effective), although there are ways of adjusting for this.
They are unpopular amongst important stakeholders, such as clinicians and the general public, who are instinctively resistant to putting a monetary value on life and health—particularly when it varies according to ability to pay.
Interest in CBA in healthcare has risen in recent years, including for use in LMICs (Culyer & Chalkidou, 2019). But for now it does not seem to be a viable path to truly welfarist economic evaluation. (See Drummond et al., 2015, ch. 6, for a discussion.)
- ↩︎
In other words, it’s better to give one person five QALYs than 50 people 0.1 QALY.
- ↩︎
A systematic review (Gu et al.,2015) suggests that some but not all of these are at least weakly supported by public opinion:
While there is heterogeneity, results suggest the young are favoured over the old, the more severely ill are favoured over the less severely ill, and people with self-induced illness or high socioeconomic status tend to receive lower priority. In those studies that considered health gain, larger gain is universally preferred, but at a diminishing rate. Evidence from the small number of studies that explored preferences over different components of health gain suggests life extension is favoured over quality of life enhancement; however this may be reversed at the end of life. The majority of studies that investigated end of life care found weak/no support for providing a premium for such care. The review highlights considerable heterogeneity in both methods and results. Further methodological work is needed to achieve the goal of deriving robust distributional weights for use in health care priority setting.
- ↩︎
Note that this traditional typology has been criticised, and alternatives proposed (e.g., Woodard, 2012).
- ↩︎
E.g., Ryff (1989): autonomy, personal growth, self-acceptance, purpose in life, environmental mastery, and positive relations.
- ↩︎
Note that some define it in terms of the methods used to obtain measurements, e.g., “people’s cognitive and affective evaluations of their lives” (Diener, Lucas, & Oshi, 2002, p. 63). I prefer the OECD’s definition as it focuses on the subjective states themselves, remaining agnostic about the means by which they are measured. While it currently seems that self-reports are the best way to capture SWB, they are prone to error, and it is quite possible that one day more “objective” methods, such as brain scans, will be a better guide to people’s inner lives.
- ↩︎
Of course, it’s possible to endorse one component and not the other, e.g., classical utilitarians tend to prefer a hedonic approach, while people working in public policy often favour evaluative measures, at least partly because they allow the respondent to decide what matters in life. Some studies take a weighted average of multiple measures.
Note also that some consider (a sense of) meaning or purpose to be a third component of SWB. However, for SWB it seems best to consider this an element of hedonic states—it’s the sense of meaning that is important, not the meaning itself—and/or cognitive evaluations—the belief that what you’re doing is meaningful, which may make you more satisfied with your life. This contrasts with objective list theories, which may claim that “meaningful” or “virtuous” activities (such as raising children or volunteering in the community) increase your wellbeing even if they make you feel bad and don’t bring you satisfaction. Nevertheless, it can still be a good idea to measure sense of meaning separately—people may not consider these “deeper” thoughts and feelings when responding to more general questions. That’s why “Overall, to what extent do you feel that the things you do in your life are worthwhile?” was included in the ONS-4, alongside items on life satisfaction, happiness, and anxiety.
- ↩︎
That said, weights for schizophrenia, which can include unusual symptoms such as psychosis, are among the highest (most severe) of any condition in the DALY system. My guess is that those very symptoms, e.g., “sometimes loses touch with reality,” contribute to rather than detract from respondents’ low valuations. One study also found very similar ratings for caregivers, clinicians, and patients themselves using a rating scale similar to the visual analog scale (Revicki, Shakespeare, & Kind, 1996). So it’s possible that not all mental disorders are valued inappropriately, and the bias could go the other way in some cases.
- ↩︎
Below is a list of all the major generic preference-based measures and their minimum values, with some explanation. Further discussion of methods for eliciting values for states worse than dead is in Parts 2 and 4.
The UK EQ-5D-3L value set bottoms out at −0.59. As noted above, this is because the analysis rescaled all negative values (some as low as −39) to fit between −1 and 0, on the grounds that it was easier to model and that some respondents may have misunderstood the scale (Dolan, 1997).
One value set for the newer EQ-5D-5L (Devlin et al., 2018) used a different version of the TTO called a “lead time TTO” (explained in Part 2) in combination with discrete choice experiments. The task for states worse than dead mirrored the task for states better than dead, allowing respondents to require up to 10 years in full health as compensation for living 10 years in the target health state. While the form of task is doubtless better, as it is on the same linear scale as for states better than dead, the lowest possible value was still −1, and the aggregate value for the worst state (55555) was just −0.208.
The first version of the SF-6D had a minimum value of +0.29 (Brazier, Roberts, & Deverill, 2002), based on valuation with the standard gamble. As with the EQ-5D-3L, this was due in part to rescaling responses to −1, with the authors acknowledging this has no theoretical support. A newer version, with a tweaked descriptive system and valued using discrete choice experiments (with duration included, to allow anchoring to 0 and 1), produced a minimum value of −0.574 (Mulhern et al., 2020).
HUI-3 has a minimum of −0.36, based on the visual analog scale (VAS) transformed into standard gamble.
The Australian value set for AQoL-8D, based on a visual analog scale transformed into TTO, has a minimum of −0.04. The authors considered any value below −0.25 to be very implausible (Richardson & Hawthorne, 2001). This is particularly disappointing given that it otherwise correlates strongly with SWB (Richardson et al.,2015).
- ↩︎
This could also be done with non-subjective wellbeing, or a weighted average of various kinds of wellbeing, but for now I will assume SWB would be used. (Aside from normative considerations, and the fact that most existing research on this topic has used SWB, wHALY is an even more awkward acronym than sHALY.)
- ↩︎
A DALY-style WELBY would presumably have to take a different name, e.g. “suffering-adjusted life-year.”
- What I thought about child marriage as a cause area, and how I’ve changed my mind by (31 Jan 2023 19:50 UTC; 218 points)
- A Model Estimating the Value of Research Influencing Funders by (29 Sep 2023 11:00 UTC; 86 points)
- Improving Institutional Decision-Making: Which Institutions? (A Framework) by (23 Aug 2021 2:26 UTC; 86 points)
- Rethink Priorities’ Special Projects Team is hiring by (1 Nov 2022 16:09 UTC; 63 points)
- Health and happiness research topics—Part 2: The HALY+: Improving preference-based health metrics by (3 Jan 2021 15:08 UTC; 56 points)
- Where can I learn about how DALYs are calculated? by (10 Jun 2022 22:03 UTC; 45 points)
- What questions relevant to EA could be answered by surveying the public? by (13 Jan 2022 17:06 UTC; 45 points)
- Health and happiness research topics—Part 3: The sHALY: Developing subjective wellbeing-based health metrics by (30 Dec 2020 15:27 UTC; 38 points)
- EA Organization Updates: November 2020 by (21 Dec 2020 12:01 UTC; 30 points)
- EA Forum Prize: Winners for December 2020 by (16 Feb 2021 8:46 UTC; 26 points)
- EA Updates for January 2021 by (4 Jan 2021 17:09 UTC; 19 points)
- A Patient’s Perspective of Measuring Health Outcomes by (28 Nov 2024 20:46 UTC; 18 points)
- Looking for Resources/Video on Well-being Metric from Happiness Research Institute by (23 Jan 2022 18:15 UTC; 2 points)
Hi Derek.
Fantastic work. very excited to see Rethink Priorities branch out into more meta questions on how to measure what value is and so on. Excited to read the next few posts when I have time
A few thoughts:
1. Have you done much stakeholder engagement? One thing that was not here (although maybe I have to wait for post 9 on this) that I would love to see is some idea of how this work feeds through to change. Have you met with staff at NICE or Gates or DCP other policy professionals and talked to them about why they are not improving these metrics and how excited they would be to have someone work on improving these metrics. (This feels like the kind of step that should be taken before the project goes too far).
2. Problem 4 - neglect of spillover affects – probably cannot be solved by changing the metric. It feels more like an issue with the way the metric is used. You sort of cover this when you say “The appropriate response is unclear.” I expect making the metric include all spillover affects is the wrong approach as the spillover effects are often quite uncertain and quantifying the high uncertainty effects and within the main metric seems problematic. That said I am not sure about this so just chipping in my two cents.
(For example when I worked at Treasury we refused to consider spillover effects at all, I think because there was a view that any policy could be justified by someone claiming it had spillover effects. Then again the National Audit Office did say our own spending measures were not leading to long-term value for money so maybe that was the wrong approach.)
3. Who would you recommend to fund if I want to see more work like this? Who do you recommend funding if I want to see more work like this or a project to improve and change these metrics. You personally? Rethink Priorities? Happier Lives Institute? Someone else? Nobody at present?
4. How is the E-QALY project going? I clicked the link for the E-QALY project (https://scharr.dept.shef.ac.uk/e-qaly/about-the-project/) It says it finishes in 2019. Any idea what happened to it?
Best of luck with the rest of the project.
Hi Sam,
Thanks for the comments.
1. Have you done much stakeholder engagement? No. I discuss this a little bit in this section of Part 2, but I basically just suggest that people look into this and come up with a strategy before spending a huge amount of time on the research. I do know of academics who would may be able to advise on this, e.g. people who have developed previous metrics in consultation with NICE etc, but they’re busy and I suspect they wouldn’t want to invest a lot of time into efforts outside academia.
I think they’d reject the assumption that they are “not improving these metrics” and would point to considerable quantities of research in this area. The main issue, I think, is that they want a different kind of metric that what I’m proposing, e.g. they think it’s important that they are based on public preferences and are focused on health rather than wellbeing. A lot of resources are going into what I see (perhaps unfairly) as “tinkering around the edges,” e.g. testing variations of the time tradeoff/DCE and different versions of the EQ-5D, rather than addressing the fundamental problems.
As I say in Part 3 with respect to the sHALY (SWB-based HALY):
That said, there is increasing increasing interest in hybrid health/wellbeing measures like the E-QALY, and scope for incremental improvement of current HALYs (see Part 2), and in the use of wellbeing for cross-sector prioritisation. In at least the latter case, you are likely to know more than me about how to effect policy change within governments.
2. Problem 4 - neglect of spillover affects – probably cannot be solved by changing the metric. I discuss spillovers a little in Part 2 and plan to have a separate post on it in Part 6 (but it might be a while before that’s out, and it’s likely to focus on raising questions rather than providing solutions). I’m still unsure what to do about them and would like to see more research on this. I agree changing the metric alone won’t solve the issue, but it may help—knowing the extent to which the metric captures spillovers seems like an important starting point.
3. Who would you recommend to fund if I want to see more work like this? It probably depends what your aims are. If it’s to influence NICE, IHME, etc, it probably has to go via academia or those institutions. If you want to develop a metric for use in EA, funding individual EAs or EA orgs may work—but even then, it’s probably wise to work closely with relevant academics to avoid reinventing the wheel. So I guess if you have a lot of money to throw at this, funding academics or PhD students may be a good bet; there is already some funding available (I’m applying for PhD scholarships in this area at the moment), but it may be hard to get funding for ideas that depart radically from existing approaches. I list some relevant institutions and individuals in Part 2.
4. How is the E-QALY project going? It got very delayed due to COVID-19. I’m not sure what the new timeline is.
FYI the E-QALY work has been progressing quite well since you asked that question; I’ve just come out of a webinar on it. Let me know if you want me to send you notes/slides.
A few key points:
The measure has been named the EuroQol Health and Wellbeing (EQ-HWB); E-QALY seems to be what they are calling the broader project of extending the scope of the QALY.
Psychometric work and stakeholder consultation resulting in a 25-item ‘long’ measure, then further consultation resulted in a 9-item EQ-HWB-S (Short Form) covering 9 domains: Mobility, Daily activitie, Pain, Fatigue, Loneliness, Concentration & thinking clearly, Depression, Anxiety, Control.
A feasibility valuation study in 521 members of the UK public uses the time tradeoff (TTO, EQ-VT protocol) and discrete choice experiments (DCE). Due to covid this was done using video conferencing.
There was also a deliberative exercise with a 12-member panel of experts at NICE which reviewed the valuation results.
Based on the size of the utility decrement associated with the most severe level of each dimension, the order of importance is: Pain (by a long way); Mobility; Daily activities; Depression; Loneliness; Anxiety; Fatigue; Control; Concentration. (To me, the weight given to Mobility in particular might indicate that this measure does not overcome some of the biggest problems with earlier measures like the EQ-5D, though it seems to be much better overall.)
Other valuation studies, using different methodologies, are underway or planned. As far as I know, these don’t include ones that obtain weights based on SWB, but I think they will be looking at own-state utilities (i.e. weights derived from preferences of people with the relevant conditions).
Several papers are being published on it this year in a special edition of the journal Value in Health.
It started with a grant of 850,000 GBP; more has been spent since, but I’m not sure how much.
NICE still seems wedded to the EQ-5D for the foreseeable future, at least in standard health technology assessments, but they may use/accept the EQ-HWB in cases where broader effects are particularly important, e.g. impacts on carers.
[Recording of the talk and related papers]
You can now view the recording of the talk from Professor John Brazier—Extending the QALY beyond health—the EQ HWB (Health and Wellbeing)
Kaltura
https://digitalmedia.sheffield.ac.uk/media/t/1_8k5slrc4
YouTube
https://www.youtube.com/watch?v=KTlsIvqyhNI
Papers associated with this talk
Special issue of Value in Health Development papers:
Brazier, J et al. ‘The EQ-HWB: overview of the development of a measure of health and well-being and key results’. Value in Health. https://www.sciencedirect.com/science/article/pii/S1098301522000833
Mukuria, C et al. “Qualitative Review on Domains of Quality of Life Important for Patients, Social Care Users, and Informal Carers to Inform the Development of the EQ Health and Wellbeing.” Value in Health (2022).
https://www.sciencedirect.com/science/article/pii/S1098301521032277
Carlton, J et al. “Generation, Selection, and Face Validation of Items for a New Generic Measure of Quality of Life: The EQ Health and Wellbeing.” Value in Health (2022). https://www.sciencedirect.com/science/article/pii/S1098301522000109
Peasgood, T et al. “Developing a New Generic Health and Wellbeing Measure: Psychometric Survey Results for the EQ Health and Wellbeing.” Value in Health (2022). https://www.sciencedirect.com/science/article/pii/S1098301521031922
International papers:
Monteiro AL, et al. A Comparison of a Preliminary Version of the EQ Health and Wellbeing Short and the 5-Level Version EQ-5D. Value Health. 2022 Mar 8:S1098-3015(22)00051-1. doi: 10.1016/j.jval.2022.01.003. Epub ahead of print. PMID: 35279371.
Augustovski F, Argento F, Rocío R, Luz G, Mukuria C, Belizán M. The Development of a New International Generic Measure (EQ Health and Wellbeing): Face Validity And Psychometric Stages In Argentina. https://www.sciencedirect.com/science/article/abs/pii/S1098301522000134
Hello Derek. Thanks for this.
I don’t have major comments on this—you and I have discussed basically all of this before. I’ll just set out a few minor clarificatory things.
In philosophy, welfarism is the view that well-being is the only thing of intrinsic value. There’s then a further discussion to be had about what the right theory of well-being is. You say you have three critiques - welfarist, extra-welfarist, and wellbeing—but those labels are confusing because, on the face of it, the “welfarist” and “wellbeing” critiques should just be the same thing.
One objection to health measures is that they are not a measure of intrinsic value. There are then two further versions of that: the welfarist version (HALYs don’t measure well-being, which is the only thing of value) and the non-welfarist version (HALYs don’t measure value, which consists in well-being + some other stuff).
A further objection, which I don’t think you explicitly state (but maybe you did—if so, sorry) is about distributions, which can be had entirely separately from whatever you think value consists in. Classic answers here are utilitarianism (value of an outcome is the unweighted sum of whatever is valuable), prioritarianism (value of an outcome is the weighted sum where more weight is given to the worse off), and egalitaranism (value of an outcome is improved in some way if value is more evenly distributed).
What you call “the welfarist critique” seems to be objections from a desire satisfaction theory of well-being. What you call the “extra-welfarist critique” is a combinaton of non-welfarist and distributional concerns. If your “wellbeing critique” you don’t flag an objective list objections to HALYs.
Resultantly, and futhermore, I’d reconceptualise your critique of what the issues are.
I agree issue 1 is health =/= value
What you call problem 2 I’d reframe as expectations =/= reality. Both the hedonism and desire satisfaction theories allow people can made mistake about what would increase their well-being. What you think will make you happy isn’t what will make you happy, etc.
problem 3 is possibly better described as an issue of inadequate scaling (you could press this concern even if you weren’t a hedonist)
One problem you’re missing from your list is a concern about distributions
Re problem 4, you raise the issue that HALYs don’t include spillovers. But then, neither do your alternatives. Hence, that’s not really a problem for the question “what unit do we measure impact in?” so much as a further question of “how widely, in practice, do we count those impacts?”
Problem 5 seems just to be a restatement of problem 1, rather than a separate concern, no?
Anyway, keep the good work!
Hi Michael. Thanks for the feedback.
A few general points to begin with:
I think it’s generally fine to use terminology any way you like as long as you’re clear about what you mean.
In this piece I was summarising debates in health economics, and my framing reflects that literature.
The main objective of these posts is to highlight particular issues that may deserve further attention from researchers, and sometimes that has to come at the expense of conceptual rigour (or at least I couldn’t think of a way to avoid that tradeoff). Like you, my natural inclination is to put everything in mutually exclusive and collectively exhaustive categories, but that doesn’t always result in the most action-relevant information being front and centre.
To address your specific points:
I try to make it very clear what I mean by “welfarism” and its alternatives:
So it should be clear that welfarism, as the term is used in modern (health) economics, offers a very specific theory of value (satisfaction of rational, self-regarding preferences that adhere to the axioms of expected utility theory) that is much more narrow than most desire theories. That said, I agree welfarism, extra-welfarism, and wellbeing-oriented ideas are not entirely distinct categories, and note overlaps between them:
I mention distributional issues in the context of extra-welfarism:
They are addressed further in Part 2 when I discussed how HALYs should be aggregated.
I do think I could perhaps have been clearer about the distinction between HALYs and economic evaluation (the latter is typically HALY-maximising, but doesn’t have to be), and analogously between the unit of value (e.g. wellbeing, health) and moral theory (utilitarianism, egalitarianism, etc). I may edit the post later if I have time.
“Preferences =/= value” was intended as shorthand for something like “the preferences on which current HALY weights are based do not accurately reflect the value of the states to people experiencing them”. Or as I put it elsewhere: “They are based on ill-informed judgements of the general public”. It wasn’t a philosophical comment on desire theories. Still, I can see how it might be misleading (plus it doesn’t strictly apply to DALYs, which arguably aren’t preference-based), so I may change it to your suggestion...though “expectations” doesn’t really fit DALYs either, so I’d welcome alternative ideas.
I agree problem 3 (suffering/happiness) is about inadequate scaling and doesn’t presuppose hedonism, but I don’t think I imply otherwise. I decided to include it as a separate problem, even though it’s applicable to more than one type of scale/theory, because it’s an issue that is very neglected—in health economics and elsewhere. As noted above, the aim of this series is to draw attention to issues that I think more people should be working on, not make a conceptually/philosophically rigorous analysis.
That’s also why I didn’t have distributional issues as a separate “problem”. I note at the the start of the list that “The criticisms assume the objective is to maximize aggregate SWB” (while also noting that they “should also hold some force from a welfarist, extra-welfarist, or simply ‘common sense’ perspective”) and from that standpoint the current default (in most HALY-based analyses/guidelines) of HALY maximisation is not a “problem,” so long as they better reflect SWB. That said, as noted above, I do mention distributional issues earlier in the post and in Part 2, in case someone does want to work on those.
Problem 4 is not that HALYs don’t include spillovers; it’s that “They are difficult to interpret, capturing some but not all spillover effects.” (When I say “Neglect of spillover effects,” I mean that the issue of spillovers is problematically neglected in the literature, not that HALYs don’t measure them at all.) This should be clear from the text:
I agree this is likely to be an issue with other metrics too (Part 6 is all about this, and it’s mentioned in Part 2), and I suspect it will mostly have to be dealt with at the aggregation stage, but it’s not the case that the content of the metrics is irrelevant. For example, the questionnaires (and therefore the descriptive system) could include items like “To what extent do you feel you’re a burden on others?” (a very common concern expressed in qualitative studies); and/or the valuation exercise could ask people to take into account the impact of their (e.g.) health condition on others (or alternatively to consider only their own health/wellbeing). If this makes a difference to the values produced, it would make HALYs/WELBYs easier to interpret, which would also inform broader evaluation methodology, like whether to administer health/wellbeing measures to relatives separately and add them to the total.
Problem 5 is not merely a restatement Problem 1, though of course they’re closely connected. Problem 1 focuses on why HALYs aren’t that good at prioritising within healthcare (i.e. achieving technical efficiency, from a fixed budget). Problem 5 is that are useless at cross-sector prioritisation (i.e. allocative efficiency). The cause is similar (health focus), and I think I combined them in an early draft; but as with states worse than dead, I wanted to have 5 as a separate issue in order to draw particular attention to it. The difference becomes especially relevant when comparing, for example, the sHALY (which assigns weight to health states based on SWB, thereby addressing Problem 1 but not 5) and the WELBY (which potentially addresses both, but probably at the expense of validity within specific domains such as healthcare, in which case it may be useful for high-level cross-sector prioritisation, e.g., setting budgets for different government departments [Problem 5], but not for priority-setting within, say, the NHS [Problem 1]). Following similar feedback from others, I did change 5 to “They are consequently of limited use in prioritising across sectors or cause areas” in my main list in order to highlight the relationship.
(Really, all of these problems are due to (a) the descriptive system, (b) the valuation method, and possibly (c) the aggregation method, so any further breakdown risks overlap and confusion—but those categories don’t really tell you why you should care about them, or what elements you should focus on, so it didn’t seem like a helpful typology for the “Problems” section.)
Still, I am not entirely happy with this way of dividing things up or framing things (e.g., some problems focus more “causes” and some on “effects”) and would welcome suggestions of alternatives that are both conceptually rigorous/consistent and draw attention to the practical implications.
I’ve made a few edits to address some of these issues, e.g.:
Changed the first two problem headings to avoid ambiguity and, in the first case, to focus on the result of the problem rather than the cause, which helps distinguish it from 5.
Hi Derek, just to note to say that my experience of reading the article was that I also found the welfare and wellbeing definitions confusing. Also doesn’t “welfare economics” look to maximise “wellbeing” by your definition, or maybe I am still confused? Might be worth clearly defining these at the start of future work.