Base Rates on United States Regime Collapse
This was originally written leading up to the 2020 Presidential Election, but has since been updated. Cross posted from https://applieddivinitystudies.com/2020/10/06/secession/
Here’s the scenario once painted by The Atlantic, NYT and others:
On election day, Trump appears to win
In the following days, mail-in ballots are counted, leading to a reversal
Trump does not accept the result
All hell breaks loose
Looking back, it might feel silly to have ever worried. Election night ended up being election week, there was a raid on the Capitol, but of course the US wasn’t going to collapse.
I argue that looking at the historical base rates paints a different picture. In our short history, we have already had a revolutionary war, followed shortly by a civil war. Looking across the globe, we see that regimes are much less stable than our lived experiences might indicate.
My overall guess is that the risk of regime-collapse is somewhere around 3% in every 4-year period. This does not feel like a salient risk, but it is reasonably high. A US-collapse would have serious implications for nuclear safety and AI arms races. It is not necessarily a highly tractable cause, but it may be a worthwhile risk to hedge against.
I consider technical forecasting issues in much more detail in the appendices, but first, here are the raw base rates to consider:
US Presidential Elections There have been 58 presidential elections in US history. Only the 1860 election led to secession. Rate: 1⁄58, 1.7%
Civil War in Any Country Stanford University Professor Stephen D. Krasner writes “There are some thirty ongoing civil wars”. Wikipedia lists 32 ongoing civil wars as of April 2020. There are 195 countries total, giving: Rate: 32⁄195, 16%
New Sovereign States since 2000
From Wikipedia, there have been 24 new sovereign states since 2000. Looking at a 4 year period, that’s 6 out of 195 countries.
Rate: 6⁄195, 3%
Independence Referendums since 1900 From Wikipedia, there have been 114 Independence Referendums since 1900. Notably, many of these were the former colonies of France breaking apart in the May 1958 Crisis and the breakup of the Soviet Union in 1991. In a 4 year period we have 114/195/(120/4): Rate: 1.9%
4 Year Time Span Since the Establishment of the 13 Colonies Including the American Revolution, and counting since the Georgia’s 1732 establishment: Rate: 2/(288/4), 2.8%
| Scenario | Rate |
|---|---|
| US Presidential Elections | 1.7% |
| Civil War in any Country | 16% |
| New Sovereign States since 2000 | 3% |
| Independence Referendums since 1900 | 1.9% |
| 4 Year Time Span Since the Establishment of the 13 Colonies | 2.8% |
| Simple Average | 5.08% |
Many of these rates beg for further qualification. I’ve provided a non-comprehensive list of corrections in the appendices addressing sensitivity analysis, the United States as a non-generic country, and so on.
I’m not going to rehash all the object-level arguments clearly detailed elsewhere. Yes, Trump has said he won’t step down. Yes, there are logistical concerns with mail-in ballots. Yes, there is currently an even number of supreme court justices.
But it’s hard to reason your way from “things seem very bad” to “shit will actually hit the fan”.
Intuitions on the question appear totally split. On one hand, it’s easy to say “there are already mass protests and this would tip the scales.” On the other hand, your uncle says he’s moving to Canada every time a republican is elected, Texas says it’s seceding every time a democrat is elected, neither ever happens. Why should this year be different?
In these scenarios, (high drama, limited information, bi-modal outcomes), it’s useful to turn to base rates.
Appendix A: Temporal Framing
I counted Independence Referendums since 1900, but there’s no good reason to pick this date over any other.
Here’s the rates we would get if we started counting at other dates. (Data and analysis at this Google Sheet)
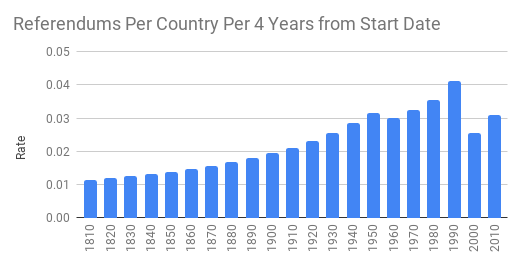
There’s a good bit of variance depending on when we start counting, ranging from 1.1% if we count every listed referendum, to 4.1% if we start counting right before the 1991 collapse of the Soviet Union.
There isn’t a clear advantage to any one start date. If we start counting from 1810, we’re capturing all the available data, but you might argue that the conditions allowing for civil war have changed, and it makes more sense to only count post-WWII, or post Soviet Collapse.
Working with parameterized models, you can pick a Schelling point to reduce the possibility of intentional manipulation, but when possible, it’s better to do the sensitivity analysis.
I’m lucky in that there’s really only one parameter here, so it’s easy to communicate these results as a simple bar graph and get a good intuitive feel for how much our start date matters. In more complex models, this might not be possible.
Appendix B: American Uniqueness
Since the future is always in some sense unprecedented, it’s not always clear which statistics to use. This is aggravated by American uniqueness. Whatever you think of American exceptionalism as a doctrine, there’s no denying that America is at least odd. Is it in the class of all countries? Democratic countries? Wealthy democratic countries? The reference class we choose will have huge implications for identifying relevant historical data.
But base rates are still good background information. Claims to uniqueness should take the form of a bayesian update, not a total disregard for priors.
Many of these base rates scream for further qualification. The 32 countries listed as engaged in civil war are generally much less wealthy and democratic than the US. But since the US is literally the world’s wealthiest country, it’s not clear where we should draw the line.
Appendix C: Fragile States Index
The 4.1% aggregate measure is heavily skewed by the 16% rate of Civil Wars in any country. An obvious objection to this point is that the US is not like those other countries. We’re richer, more democratic, or in some broader sense, more stable.
The Fragile States Index attempts to capture this idea, looking at corruption, political stability, economic inequality and more.
We can’t look at 2020 data since it will account for the existence of ongoing civil wars. Instead, we’ll take the oldest historical data from 2006, and join it with the list of countries with civil wars that started after 2006:
| Country (2006) | FSI Rating (lower is better) |
|---|---|
| Syria | 89 |
| Mali | 75 |
| Central African Republic | 98 |
| Egypt | 90 |
| Libya | 69 |
| Ukraine | 73 |
| Yemen | 97 |
| Cameroon | 88 |
| Mozambique | 75 |
| United States (2020) | 38 |
We should still take into account the dangers listed in Appendix A, but since FSI is actually a sensible leading indicator, it feels reasonable to suggest that coutries with low FSI actually are very unlikely to start a civil war, and the base rate for the population of countries relevant to the US is actually 0%.
Appendix D: Predictive Theories
It’s tempting to claim a different reference class by drawing up a broad theory, such as: “No western democratic country has had a civil war since WWI”. Except that isn’t actually true. Manuel Azaña was elected Prime Minister of Spain in 1931, leading up to the 1932 Coup, 1934 Revolution and 1936 Civil War.
So okay, maybe the real temptation is to claim a different reference class by drawing up a broad theory that backtests well. The broader danger is in finding a theory that backtests well, but isn’t actually predictive, and falling into a kind of Garden of Forking Paths. As usual, there’s a relevant XKCD.
If you go on Wikipedia and read about societal collapse, you’ll find a near-perfect description of America today:
factors such as environmental change, depletion of resources, unsustainable complexity, decay of social cohesion, rising inequality, secular decline of cognitive abilities, loss of creativity, and bad luck.
And if you read Joseph Tainter’s foundational work The Collapse of Complex Societies, you’ll find more of the same, with chapter headings ranging from resource depletion, to catastrophes and social dysfunction.
But note that Tainter is not trying to predict future collapse, merely explain past ones:
Societies do encounter resource shortages, class interests do conflict, catastrophes do happen, and not uncommonly the response does not resolve such problems. A general explanation of collapse should be able to take what is best in these themes and incorporate it. It should provide a framework under which these explanatory themes can be subsumed.
As a result, he doesn’t look at any civilizations which did not collapse in order to determine whether or not these factors are causal. Reading Tainter does not tell us anything about the relative proportion of civilizations who experienced resources shortages, class conflict, etc, and did not fall apart.
Appendix E: Asymmetric Returns
I intended all this as a remedy to otherwise alarmist rhetoric, but don’t take a low base rate of succession to mean that we shouldn’t worry about it. A game of Russian Roulette with a 50-chamber cylinder would still be terrifying.
At first approximation, you might think a ~2% chance of collapse gives you an expected value of 98% of your current life, however you may choose to measure it.
But the real harm isn’t in losing your existing health, property, net worth or other assets, it’s the damage to your long term wellbeing. In the Russian Roulette example, you should obviously be willing to pay much more than 2% of your current assets to avoid playing. Instead, it should be something closer to 2% of your expected assets over the rest of your life, subject to an appropriate temporal discount.
This is further aggravated by diminishing returns from assets to wellbeing. A 2% chance of death is much worse than a 2% tax levied on all future income.
I’m not saying you should rush out today and buy guns, or even canned beans. Just that as silly as it feels to prepare for unlikely events, it is sometimes better to pay for insurance than to pick up pennies in front of a steamroller.
Appendix F: Simple Averages
If the base rates are already hand wavy, taking the simple average is a frenetic shake. We can easily create semi-redundant rates to increase the weight given to some statistics. US Presidential Elections and 4 Year Span of US History turn up slightly different results, but essentially encode the same information.
You could do sensitivity analysis as before, or report two different averages, with and without the outlier. I’m not sure what the proper adjustment is other than to again, not take any of this at face value.
In the service of that aim, it’s worth noting that models are always garbage in, garbage out. Using overly sophisticated analytical tools can create the illusion of precision where it doesn’t exist. So yes, it might be worth doing the sensitivity analysis in this case, but it risks lending too much credibility while adding too little information.
Appendix G: Secession, Independence, Civil War, Revolution
I’ve conflated these forms of conflict throughout the post. Partially because it’s messy (the Civil War started out as mere secession), but also because I think this is what readers actually care about.
If I told you the odds of Civil War were x%, and then we got a revolution or military coup instead, you would probably feel cheated.
Appendix H: Metaculus Predictions
Metaculus is similar to a prediction market and weighs user predictions by their historical correctness. It has a Brier score of 0.095 and a Log score of 0.120, indications that it has been broadly reliable. Of course, this is partially a function of question popularity, with the most popular questions receiving thousands of predictions.
Will the USA enter a second civil war before July 2021?: 1%, 251 predictions
Will at least one US state secede from the Union before 31 December, 2030?: 5%, 51 predictions
I think that your probabilities are too high, because you are not processing enough data, or processing the data you have enough. For example, the new sovereign state prior (3%) would assume something like all countries having the same chance of popping out a state, which seems to clearly not be the case.
You might want to take a look at or contact the authors from the Rulers, Elections and Irregular Governance (REIGN) dataset/CoupCast, which has way more data behind it.
The post has been updated in what way?
Hey thanks for asking, it’s the paragraphs from “Looking back” to “raw base rates to consider”
In some ways this feels like a silly throwback, on the other hand I think it is actually more worth reading now that we’re not caught up in the heat of the moment. More selfishly, I didn’t post on EA Forum when I first wrote this, but have since been encouraged to share old posts that might not have been seen.