EA Survey: Cause Prioritization
Summary
In this post we report findings from the 2022 EA Survey (EAS 2022) and the 2023 Supplemental EA Survey (EAS Supplement 2023)[1], covering:
Ratings of different causes, as included in previous EA Surveys (EAS 2022)
New questions about ideas related to cause prioritization (EAS 2022)
A new question about what share of resources respondents believe should be allocated to each cause (EAS Supplement 2023)
New questions about whether people would have gotten involved in EA, had EA supported different causes (EAS Supplement 2023)
Overall cause prioritization
Global Poverty and AI Risk were the highest-rated causes, closely followed by Biosecurity
Ratings of AI Risk, Biosecurity, Nuclear Security, and Animal Welfare have all increased in recent years
Prioritizing longtermist over neartermist causes was predicted by higher levels of engagement, male gender, white ethnicity, and younger age (when accounting for the influence of these and several other variables in the same model).
63% of respondents gave their highest rating to a longtermist cause, while 47% gave a neartermist cause their highest rating (the total exceeds 100% because 26% of respondents gave their highest ratings to both a longtermist cause and a neartermist cause). Splitting these out, we see 38% gave only a longtermist cause their highest rating, 21% a neartermist cause only, 26% both, and 16% neither a near- nor longtermist cause (e.g., Animal Welfare). This suggests that although almost twice as many respondents prioritize a longtermist cause as prioritize a neartermist cause, there is considerable overlap.
Philosophical ideas related to cause prioritization
“I’m comfortable supporting low-probability, high-impact interventions”: 66% of respondents agreed, 19% disagreed.
“It is more than 10% likely that ants have valenced experience (e.g., pain)”: 56% of respondents agreed, 17% disagreed
“The impact of our actions on the very long-term future is the most important consideration when it comes to doing good”: 46% of respondents agreed, 37% disagreed
“I endorse being roughly risk-neutral, even if it increases the odds that I have no impact at all.” 37% of respondents agreed, 41% disagreed
“Most expected value in the future comes from digital minds’ experiences, or the experiences of other nonbiological entities.” 27% of respondents agreed, 43% disagreed
“The EA community should defer to mainstream experts on most topics, rather than embrace contrarian views.” 23% of respondents agreed, 46% disagreed
The following statements were quite strongly associated with each other and predicted support for longtermist causes over neartermist ones quite well: “Long-term future”, “Low probability high impact”, “Risk neutral”, and “Digital minds”
Allocation of resources to causes
On average, respondents allocated the following shares to each cause: Global Health and Development (29.7%), AI Risks (23.2%), Farm Animal Welfare (FAW) (18.7%), Other x-risks (16.0%), Wild Animal Welfare (5.1%), and Other causes (7.3%). Results did not dramatically differ looking only at highly engaged respondents.
Compared to actual allocations estimed in 2019, the average of the survey allocations are lower for GHD, higher for AI / x-risk overall and higher for animal welfare, but compared to 2019 Leaders’ Forum allocations, the survey assigns larger shares to GHD and to FAW and less to AI and x-risk.
Causes and getting involved in EA
Respondents were strongly inclined to report that “the key philosophical ideas and principles of EA in the abstract” were more important than “Specific causes that EA focuses on”
However, results were much more mixed when asked whether they would still have gotten involved in EA if the community was not significantly engaged with the causes they were most interested in at the time. The most common single response was that this was “probable” (27.0%), and a majority (57.2%) of respondents rated it at least probable that they would have gotten involved, but almost a third (31.5%) rated it more likely that they would not have gotten involved.
Overall cause prioritization
As in previous survey years, respondents were asked to indicate the extent to which a range of different causes should be prioritized by EAs[2]. These results represent the responses of approximately 3000 respondents, with the exact number varying from 2964 and 3143, as not everyone provided ratings for all causes. The first two figures below show the prioritization ratings expressed as means, as well as the percentage of people selecting different levels of prioritization for each cause.
When looking at both the means and the overall distribution of ratings, Global poverty, AI risk, and Biosecurity tend to stand apart from other items as the most highly rated. This interpretation is supported by more formal comparisons among cause ratings presented in the appendix.
As in previous years, Biosecurity stands out as being a near-top priority for fully half of the respondents, despite being much less frequently selected as a top priority than Global Poverty or AI. Conversely, while Climate change scores relatively low on average, it has a high percentage of people picking it as the top priority relative to its average position.
Although there is considerable variability in precisely how much people think different causes should be prioritized, all causes had at least 50% of respondents indicating they should receive at least significant resources.
How many EAs prioritize longtermist, neartermist, and other causes
We also conducted some alternative analyses to assess whether more respondents support longtermist or neartermist causes[3]. For these analyses, we examined whether respondents gave their highest rating to a longtermist cause, a neartermist cause, both, or neither[4]. This new analysis provides a check on the earlier analyses, and offers a more intuitive sense of how many people most prioritize one or other type of cause.
Overall, 63.6% of respondents gave a longtermist cause their highest rating, while 46.8% of respondents gave a neartermist cause their highest rating, and 15.6% gave their highest rating to an Other cause. Notably, these percentages sum to more than 100% because some respondents assigned their highest rating to both a longtermist cause and a neartermist cause.
Splitting these respondents out separately, we see that 37.6% of respondents gave a longtermist cause their highest rating, compared to 21% giving a neartermist cause their highest rating.
In line with our other analyses, support for longtermist and neartermist causes diverged strongly between low engagement and high engagement respondents. Among the highly engaged, almost half of respondents (47%) most prioritized only a longtermist cause and only 13% most prioritized a neartermist cause. In contrast, the less engaged were more evenly split, but favored neartermist causes (31% neartermist vs 26% longtermist).
Trends in cause prioritization over time
Since the first time that questions about cause prioritization were asked in the EA Survey in 2015, the causes most highly-rated by respondents have changed. It can be seen that Global poverty and health used to be rated even more highly than it is at present, though it remains highly endorsed. The importance attributed to several longtermist/existential risk cause areas has tended to increase over time. It is interesting to note that both Biosecurity and Nuclear security see quite large inflections upwards from 2020 to 2022, which may be due to events such as the war in Ukraine and COVID-19 pandemic raising the visibility of these cause areas. However, several other cause areas also show increases from 2020 to 2022, and AI risk in particular shows a steady increase between 2019 and 2022, so we cannot be sure that the observed increases are specifically related to such events. It is possible these changes could also reflect broader shifts in the EA ecosystem to promote existential risks as a category more broadly.
Animal welfare has risen substantially as a priority since 2015. Relative to how much the prioritization of other cause areas has changed over time, Mental health and Climate change are rated similarly to how they were when initially introduced as cause areas in the 2018 survey.
The relative prioritization of different causes, and their changes over time, may also relate to shifts in the composition of EA Survey respondents over time. We therefore also assessed changes over time, broken down by level of engagement, which are shown in the appendix.
Engagement and cause prioritization
Cause prioritization for some causes differed substantially between high vs. low engagement respondents[5]. The most striking differences were in ratings of Global poverty, AI risk, Climate change, and EA movement building. Although they still gave high priority to Global poverty, high engagement respondents rated it lower than those with low engagement. Relative to highly engaged respondents, low engagement respondents gave much higher priority to Climate change. In contrast, highly engaged respondents gave higher ratings to AI risk—which was the top priority on average in this group—as well as higher ratings to EA movement building.
Factors linked with prioritization of different causes
To assess factors that might explain or relate to prioritization of different causes, we conducted multiple regression analyses using predictors of interest that have been included in previous years and often found to be associated with EA-related outcomes, or of broad interest for understanding the EA community, namely: respondent age, year involved in EA, identifying as of white ethnicity, identifying as a man, being a student, having high engagement, and residing in the USA[6].
We’ve selected a range of informative prioritization-related outcomes for these multiple regression models.[7]
Below, we highlight a number of findings:
High engagement tended to have the largest associations with the different cause prioritization ratings, being associated with substantially higher Longtermist (LT) versus Neartermist (NT) scores, higher ratings for meta-level priorities, and greater prioritization for Animal welfare. It was also strongly negatively associated with Global poverty / health.
Higher age was associated with greater concern for the two ‘neartermist’ causes, lower LT scores, and therefore substantially lower LT minus NT ratings.
Getting involved in EA in more recent years was associated with generally giving higher ratings across the cause areas/scores, with the exception of Animal welfare.
White ethnicity was associated with slightly lower preference for the ‘neartermist’ causes and a slightly higher LT versus NT preference.
Identifying as a man was also associated with a higher LT versus NT preference, lower prioritization for the two specific ‘neartermist’ causes, and lower prioritization for Animal welfare.
Being a student showed only minor effects across the different cause areas.
Finally, being based in the US seemed to have quite a strong negative association with concern over the Meta cause areas, and with Mental health, as well as smaller negative associations with Animal welfare and LT scores.
EA-related ideas and attitudes
Respondents to the 2022 EA Survey were, for the first time, also asked to express their agreement or disagreement with some different ideas and epistemic stances[8]. These items were:
The impact of our actions on the very long-term future is the most important consideration when it comes to doing good. [“Long-term future”]
I’m comfortable supporting low-probability, high-impact interventions. [“Low-probability high impact”]
I endorse being roughly risk-neutral, even if it increases the odds that I have no impact at all. [“Risk neutral”]
The EA community should defer to mainstream experts on most topics, rather than embrace contrarian views. [“Defer to experts”]
I have learned a lot from other EAs who prioritize different broad cause areas than I do. [“Learned from others”]
Most expected value in the future comes from digital minds’ experiences, or the experiences of other nonbiological entities. [“Digital minds”]
It is more than 10% likely that ants have valenced experience (e.g., pain). [Ants sentient (10%)]
It is more than 50% likely that ants have valenced experience (e.g., pain). [Ants sentient (50%)]
Response options were on a 5-point Likert scale, from Strongly Disagree to Strongly Agree.
Some particularly notable findings are:
Participants tend to disagree with being “roughly risk neutral”
Just under half of participants endorse an abstract statement of longtermism, but the distribution is bimodal[9]
Over half of participants assign 10% probability to ant sentience, while 32% assign more than 50% probability
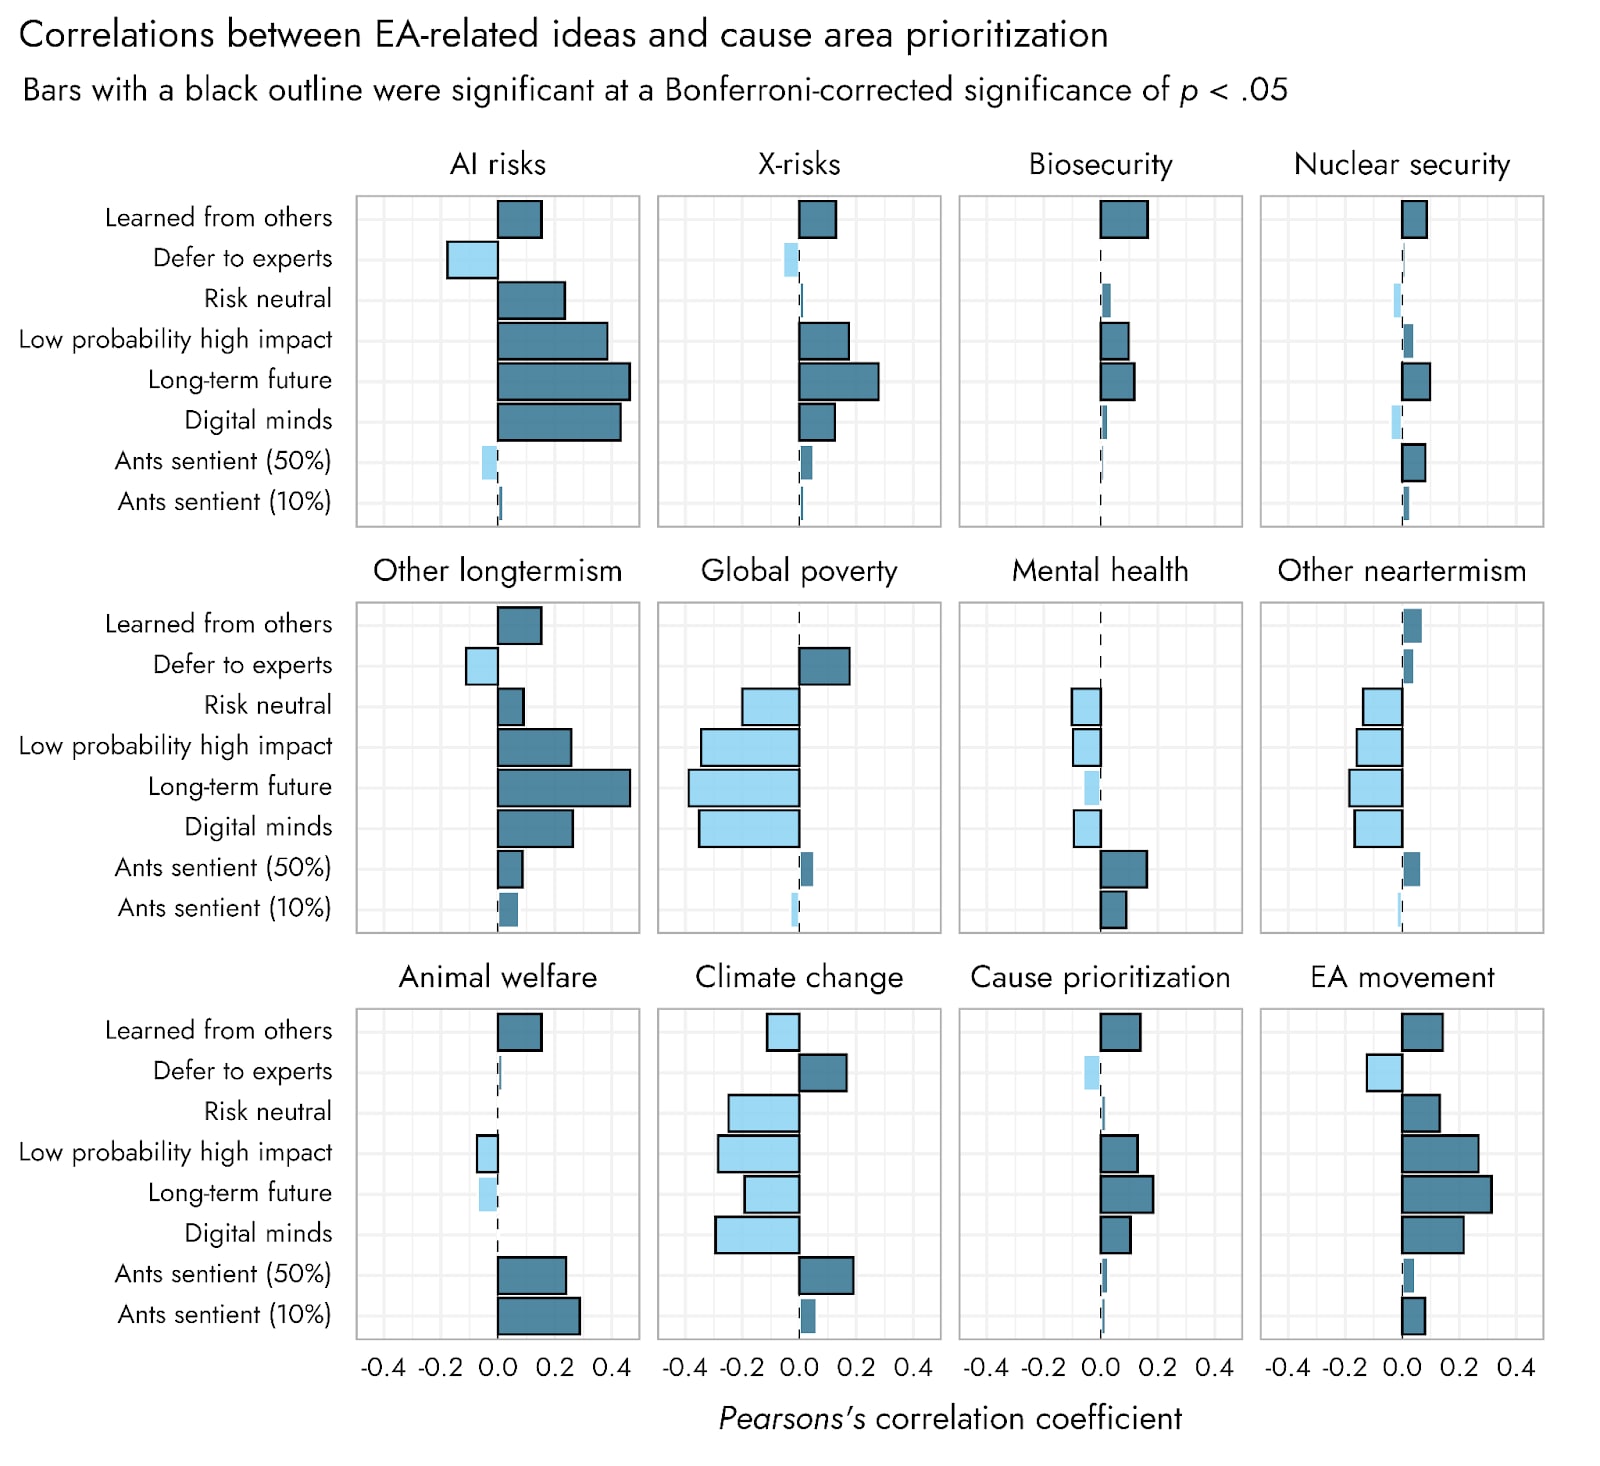
Relationships between ideas and causes
We examined relationships between these ideas (shown in the appendix) and found that four items—“Long-term future”, “Low probability high impact”, “Risk neutral”, and “Digital minds”—also showed quite strong positive relationships with one another.
These four items tended to have negative associations with Global poverty and Climate change, and positive associations with AI risk and Other longtermism. Notably, there was much less of an association between these ideas and support for Biosecurity and Nuclear security.
Animal welfare prioritization was most reliably linked with the two ant sentience items, which with it was positively correlated. Exact pairwise correlations are presented in the appendix.
We also examined predictors of agreement with these ideas, as we did for support for different causes. Full results are shown in the appendix. Some notable findings are that:
Being ‘risk neutral’, endorsing ‘low probability, high-impact interventions’, and believing the ‘long-term future’ was the most important consideration were positively associated with identifying as a man and with higher engagement
Agreement that ants were more than 10% likely (and more than 50% likely) to be sentient was associated negatively with identifying as a man and with more years spent in EA.
Allocation of resources across causes
In December 2023 through January 2024, a supplemental survey was fielded to members of the EA community. In this survey, some additional questions of relevance for cause prioritization were asked. Approximately 600 people responded to the survey, although the percentage who provided responses to different questions in the survey varied greatly.
Resource allocation to different causes
Respondents were asked to indicate the proportion of resources they would allocate to each of several cause areas: Global health/poverty/development (GHD), farmed animal welfare (FAW), wild animal welfare (WAW), AI risk, Existential risk other than AI, and ‘Other’ causes.
Overall, GHD received on average the greatest share of resource allocation, followed by AI risk, then FAW, then X-risk. WAW and ‘Other’ causes received substantially lower percentages of resource allocation.
This overall pattern was the same when breaking down respondents into high relative to low engagement, but higher engagement respondents tended to give proportionally greater shares of resources to AI risk and FAW than did lower engagement respondents, with corresponding lower shares then given to GHD.
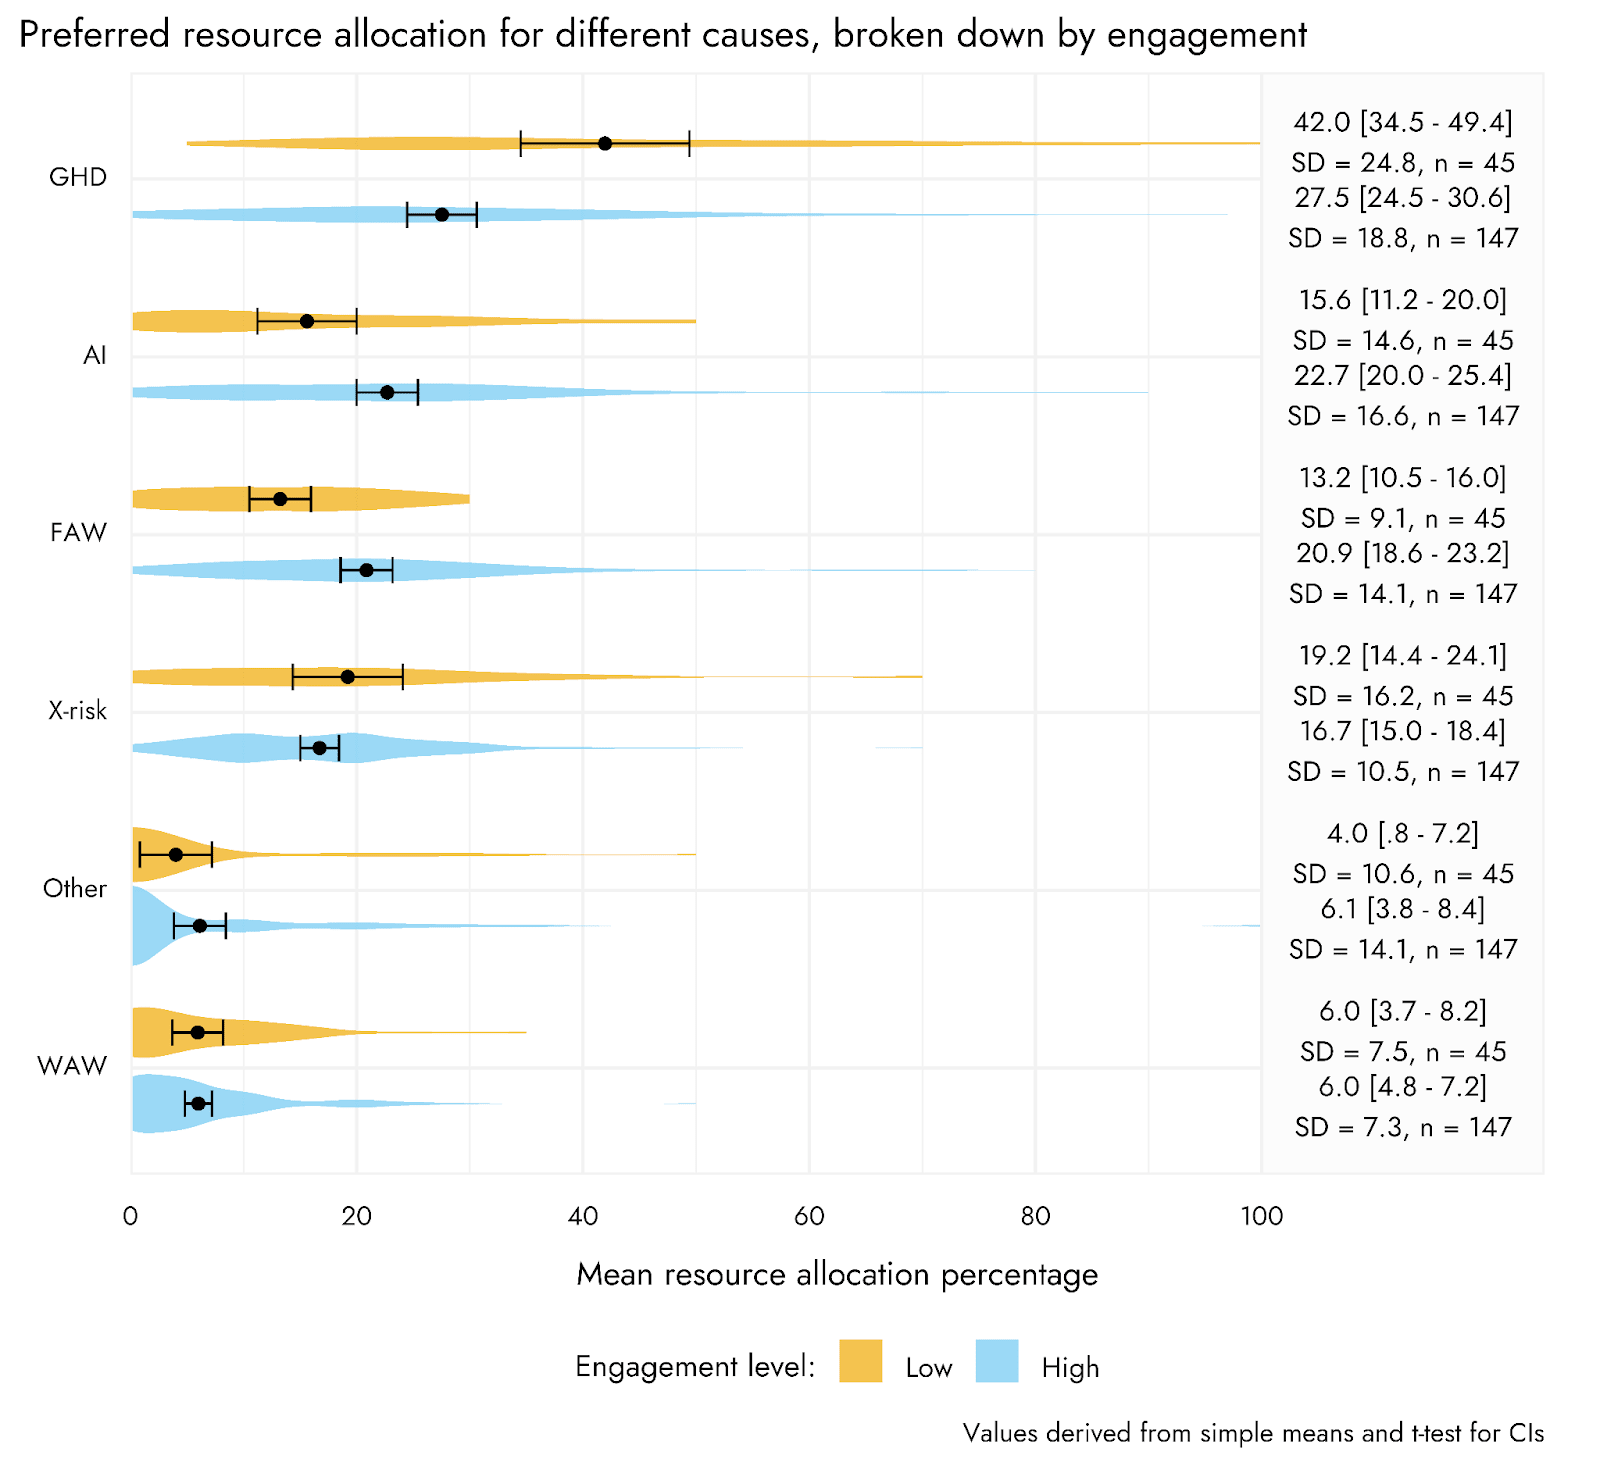
Below, we compare the mean[11] allocations from our survey respondents to actual allocations (as estimated by Ben Todd) and Leaders’ ideal allocations (as estimated by the 2019 Leaders’ Forum)[12].
The results suggest that, compared to actual allocations, our survey’s allocations assign fewer resources to GHD and more resources to AI, and more to Farmed Animal Welfare. However, compared to the Leaders Survey allocations, our survey assigns more resources to GHD, less to AI, and more to FAW. Moreover, both our results and the Leaders’ Forum survey appear to assign dramatically more resources to WAW.
Of course, it’s worth noting that both these survey results may reflect certain idealisations on the part of respondents, and so not reflect recommendations taking into account various practicalities (e.g. the effects of rapidly shifting funding allocations).
Causes and getting involved with EA
In addition to allocating resources to different cause areas, respondents were also asked the extent to which the specific causes on which EA focuses, or the philosophical ideas that underpin EA, were more influential in getting them involved in EA. The majority of respondents indicated that the ideas that underpin EA were more influential for them.
Acknowledgments
This post was written by Jamie Elsey and David Moss. We would like to thank Willem Sleegers for help with some analyses and for review, and Marie Buhl, Erich Grunewald, Bob Fischer, Oscar Delaney, and Sarah Negris-Mamani for review of and suggestions to the final draft of this post.
Appendix
Probability of superiority
To compare the relative prioritization of different items with one another in a way that respects the ordinal nature of the ratings, we can calculate the within subjects Probability of Superiority (PSup). PSup gives an indication of the proportion of times one item ‘A’ would be rated more highly than a comparison item ‘B’ in a forced choice comparison between them: For each respondent, we assess whether A was rated higher than, the same as, or less than B, scoring these cases as 1, 0.5, and 0 respectively. When averaging these ratings across all respondents, this amounts to a probability, from 0 to 1, of A being rated greater than B, where 0 indicates that nobody rates A > B, .5 would indicate A and B are essentially equally rated, and 1 indicates everybody rates A > B.
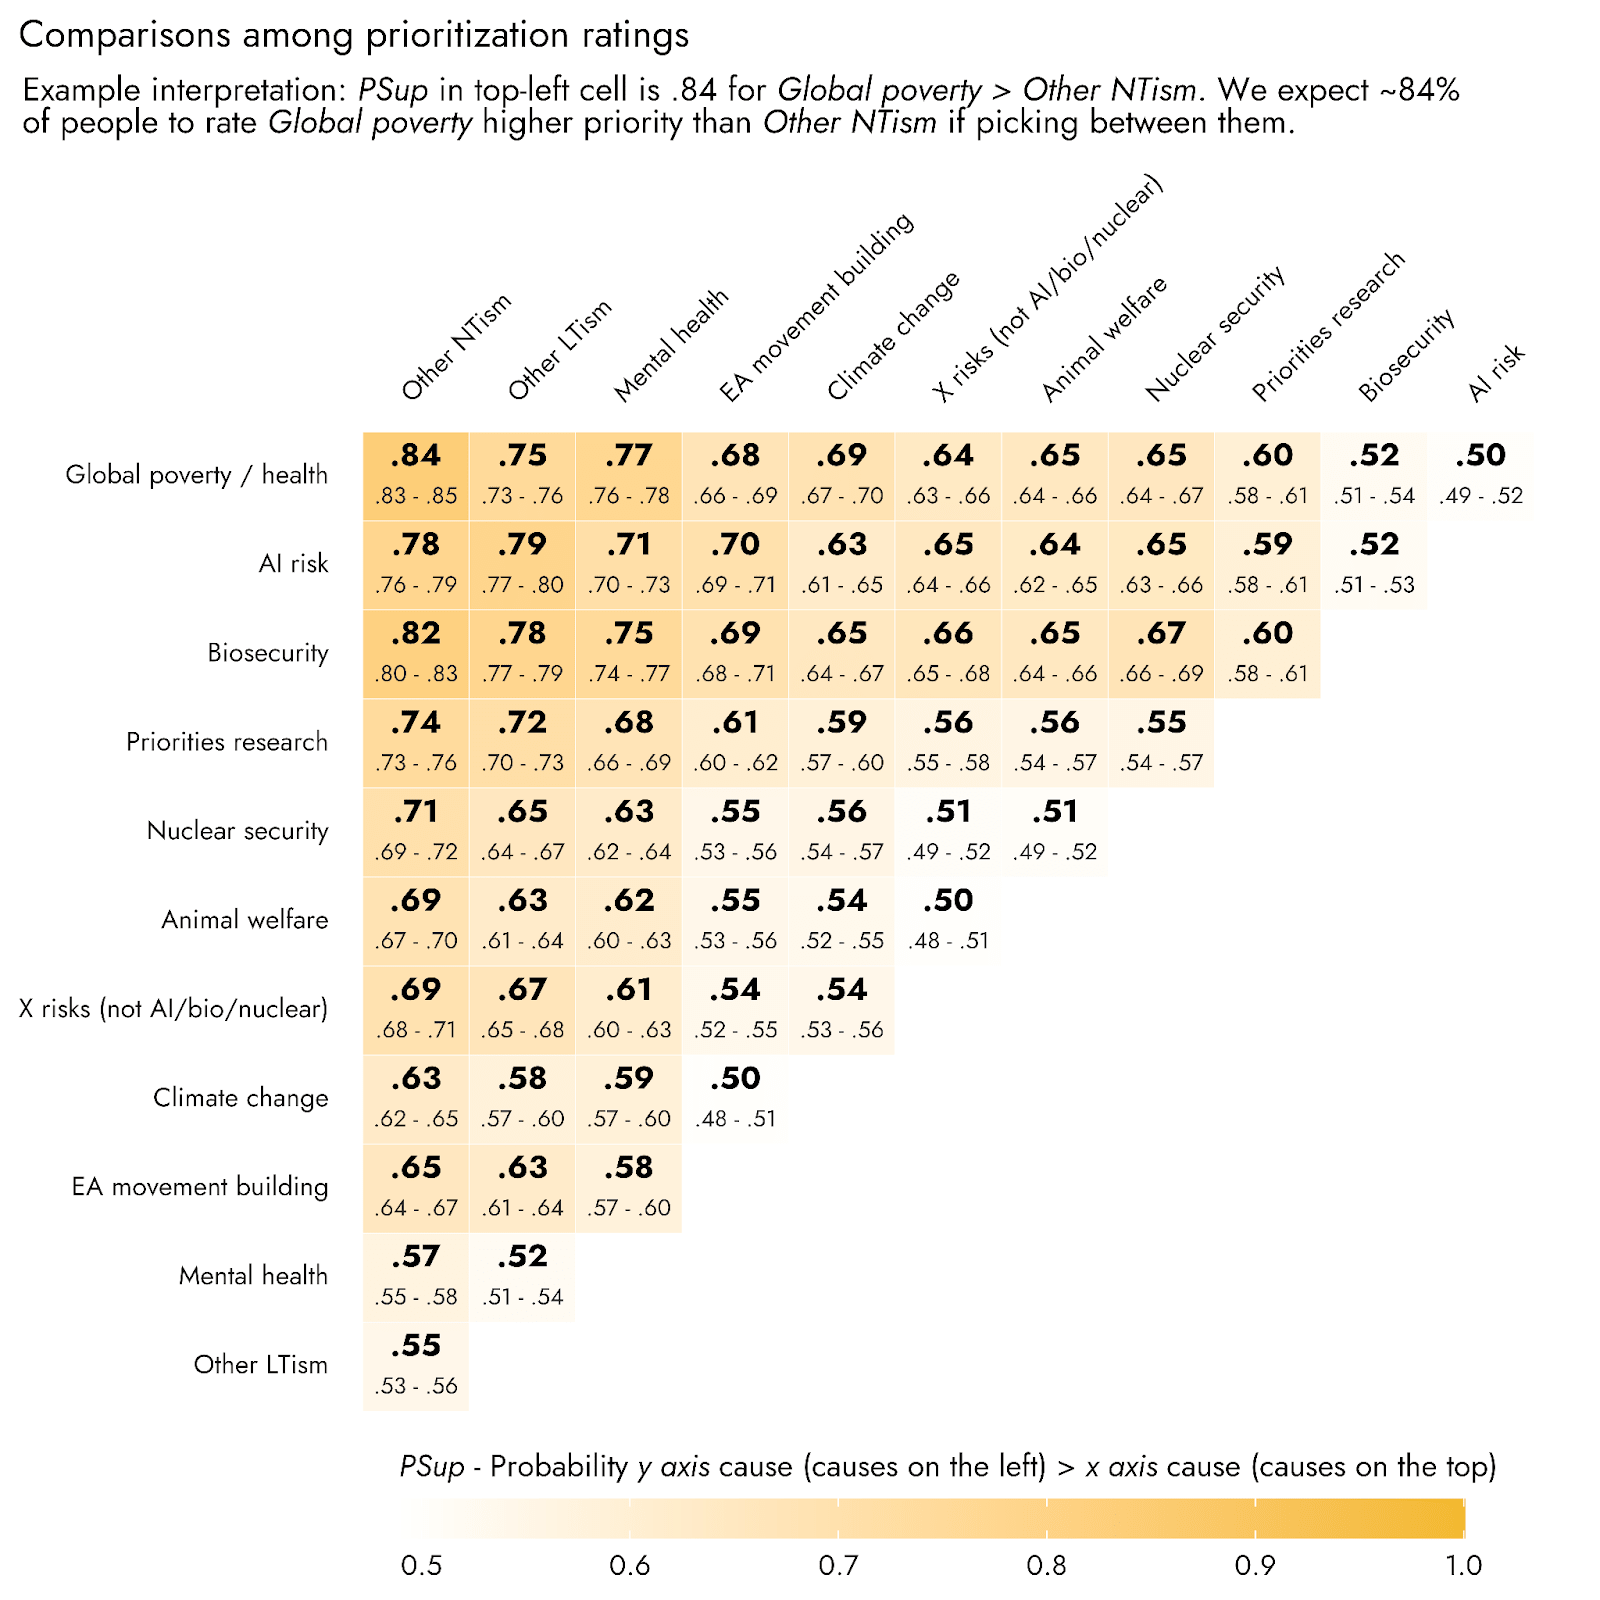
Using this metric, we can see that Global poverty and health, AI risk, and Biosecurity are expected to be rated as roughly equivalent to one another, with PSup ratings hovering around .5. However, many comparisons have moderate or large effect sizes, with a 2:1 ratio of people favoring one cause over another (PSup ~.67, roughly equivalent to a Cohen’s d of .62, e.g., Biosecurity vs. Climate change, Biosecurity vs. Nuclear security), and some even with a 3:1 ratio (PSup ~.75, roughly equivalent to a Cohen’s d of .95, e.g., Global poverty or Biosecurity vs. Mental health).
Probability of superiority in high and low engagement respondents
Comparisons among the cause ratings within these different engagement levels using Probability of superiority are presented in the appendix. Most notable in these comparisons is that, among high engagement respondents, Climate change performed especially poorly, whereas among Low engagement respondents, Climate change was rated reliably higher than most other causes with the exception of Global poverty. Among high engagement respondents, both AI risk and Biosecurity were given higher priority than Global poverty. Among high engagement respondents, EA movement building also ranked comparably to several specific cause areas, including Animal welfare, Nuclear security, and X risks (besides bio/nuclear/AI), whereas it was rated lower than most other causes among Low engagement respondents.
Predictors across causes
Relationships between ideas
As would be expected, the two ant sentience items were highly positively correlated with one another. Four items—“Long-term future”, “Low probability high impact”, “Risk neutral”, and “Digital minds”—also showed quite strong positive relationships with one another, ranging from .21 to .47. A principal component analysis (PCA) on these items suggested that the items “Long-term future”, “Low probability high impact”, “Risk neutral”, and “Digital minds” tended to cohere together as a component, each with loadings of .5 or more.
Pairwise associations between EA-related ideas and cause prioritization
Predictors of ideas
Similarly to our multiple regression analyses of cause prioritization, we entered the EA-related ideas into multiple regression models including as predictors: respondent age, year involved in EA, identifying as of white ethnicity, identifying as a man, being a student, having high engagement, and residing in the USA.
Student status, being based in the USA, and reporting white racial identification all had relatively few and small associations with EA-related ideas. In contrast, high engagement showed several relatively large and positive associations with “Low probability high impact”, “Risk neutral”, “Long-term future”, “Digital minds”, and “Learned from others”, with a negative association with agreeing with deference to experts. Identifying as a man was associated with greater agreement with “Low probability high impact”, “Risk neutral”, “Long-term future”, “Digital minds”, whereas being of older age was associated with lower agreement with these ideas. Identifying as a man was also negatively associated with attributing sentience to ants, whereas having become involved in the EA community in more recent years was associated with a greater tendency to endorse ant sentience. Both identifying as a man and increasing age were associated with being less likely to agree with “Learned from others”.
Ratings across time broken down by engagement
We first added the question about engagement in the 2019 EA Survey and so can show these breakdowns for EAS 2019, 2020 and 2022. For simplicity, we group respondents as Low engagement (‘None’, ‘Mild’, and ‘Moderate’, ~45% of respondents) and High engagement (‘Considerable’ and ‘High’, ~55% of respondents). Further breakdowns of cause prioritization depending on engagement and other variables are presented below.
Logistic regression on most cause allocation selections
In a logistic regression model, we found that roughly half of respondents would be expected to give their highest (or equal highest) share of resources to GHD, in contrast to 37% for AI risk. FAW and X-risks were expected to be allocated a top share of resources by approximately 20% and 15% of respondents respectively, with a minority of 2-3% doing so for WAW.
When assessing those causes to which respondents were expected to allocate no resources, based on logistic regression modeling we expect approximately 28% of members to allocate no resources to WAW. Other than WAW, cause areas were generally expected to receive no resource allocation by at most around 10% of people.
- ^
The EAS 2022 was conducted from November to December, 2022. The EAS Supplement 2023 was conducted from December 2023 to January, 2024.
- ^
Respondents were asked “Please give a rough indication of how much you think each of these causes should be prioritized by EAs.” The full rating options were: (1) I do not think any resources should be devoted to this cause, (2) I do not think this is a priority, but should receive some resources, (3) This cause deserves significant resources, but less than the top priorities, (4) This cause should be a near-top priority, (5) This cause should be the top priority. In 2015 and 2017, the wording of some options was slightly different but conveyed the same meaning.
- ^
In previous years and in analyses here, we calculated a Longtermism-minus-Neartermism score to assess prioritization of longtermist causes over neartermist causes. The mean scores offer a better sense of the degree to which respondents generally prioritize longtermist causes over neartermist causes (or prioritize each separately). However, as this is a continuous scale it does not give a straightforward answer as to which respondents should be counted a longtermist or neartermist overall.
- ^
Causes classified as longtermist were Biosecurity, Nuclear risk, AI risk, X-risk other and Other longtermist. Causes classified as neartermist were Mental health, Global poverty and Neartermist other. Causes classified as Other were Animal Welfare, Cause Prioritization, EA movement building and Climate change.
As we have noted previously, people may of course prioritise these causes for reasons other than longtermism or neartermism per se. Likewise, people might support the ‘Other’ causes here for neartermist or longtermist reasons. The classifications we used here were informed by our prior analyses of the factor structure of the cause prioritisation items and a priori theoretical considerations (namely Climate Change is clearly associated with the neartermist causes not the longtermist causes, but theoretically some might think of it as a longtermist cause, and we count it as ‘Other’ in this analysis). Prior analyses we have conducted on the full response scales suggest the support for ‘Meta’ causes (Cause prioritisation and movement building) tend to be strongly correlated with support for longtermist causes.
A respondent’s “highest rating” was the highest rating that they gave to any cause, whether or not it was the absolute highest rating on the response scale (e.g., a respondent who assigned a cause 4⁄5, but assigned no cause a 5, would be counted as assigning that cause their highest rating, since they most prioritized that cause).
- ^
As in previous posts, we used a binary classification where respondents indicating ‘None’, ‘Mild’, and ‘Moderate’, (~45% of respondents) were classified as ‘Low engagement’ and respondents indicating ‘Considerable’ and ‘High’, (~55% of respondents) were classified as ‘High engagement’.
- ^
Age and Year involved in EA were standardized by mean centering and dividing by two standard deviations, as recommended by statistician Dr Andrew Gelman (Gelman, A. (2008). Scaling regression inputs by dividing by two standard deviations. Statistics in medicine, 27(15), 2865-2873.)
- ^
The ‘LT score’ reflects the average of several longtermism-related causes (AI risk, Biosecurity, Nuclear security, and other X-risks), whereas the ‘NT score’ reflects the average of two typically ‘neartermist’ causes (Global poverty / health and Mental health). ‘LT minus NT’ reflects the LT score minus the NT score, such that higher values indicate a relatively greater preference for the above LT vs. NT cause areas, on average. However, because we have found in exploratory work that Global poverty / health may have quite different associations with various correlates than does Mental health, we also plot these two outcomes independently of one another. The ‘Meta score’ reflects an average of Cause prioritization and EA movement building. Finally, we include Animal welfare, as concern for animals would otherwise go unrepresented in these regression analyses. The plot below highlights the predictors for each cause area, and in the appendix we show how the predictors tended to perform across different priorities.
- ^
The two items related to ant sentience were purely exploratory items requested by an organization with interests in animal welfare, whereas the remaining six items are more strictly the ‘EA-related ideas/attitudes’ that were intended to generate more insight into people’s cause prioritization preferences, and their general epistemological stances.
- ^
i.e., there are two separate ‘peaks’, with more people somewhat agreeing and somewhat disagreeing with the statement than there are people in the middle of the response scale, in contrast to a normal distribution
- ^
This score was the average of support for AI, Nuclear, Biosecurity, and other X-risk minus support for the average of Global poverty and Mental health.
- ^
Median results were only minimally different and do not change the pattern of results overall.
- ^
More up to date estimates of allocations are available from Tyler Maule, but the categories line up less well with the survey categories.
- Please Take the EA Survey 2024 by (9 Dec 2024 13:52 UTC; 120 points)
- Resources for Farmed Animal Advocacy: 2024 Roundup by (21 Jan 2025 21:51 UTC; 45 points)
- 's comment on GiveWell may have made 1 billion dollars of harmful grants, and Ambitious Impact incubated 8 harmful organisations via increasing factory-farming? by (23 Dec 2024 22:20 UTC; 20 points)
- 's comment on EA Survey 2024: Cause prioritization by (10 Dec 2025 9:54 UTC; 5 points)
- 's comment on Probabilities might be off by one percentage point by (13 Dec 2024 9:42 UTC; 4 points)
- 's comment on Yarrow’s Quick takes by (20 Apr 2025 14:08 UTC; 2 points)
Thanks for the great analysis!
The lack of interest in GHD by the Leaders Forum is often communicated as if GHD should be deprioritised, but I think a fair amount of causation goes the other way. Historically, people promoting GHD have not been invited to the Leaders Forum.
I think it’s similar with engagement. Highly engaged EAs are less likely to support GHD, but that ignores the fact that engagement is defined primarily based on direct work not E2G or careers outside EA, hence people interested in GHD are naturally classified as less engaged even if they are just as committed.
Thanks Grayden!
I strongly agree that engagement =/= commitment or impact.
That said, I’d the trend for higher engagement to be associated with stronger support for longtermist over neartermist causes is also observed across other proxies for engagement. For example, perhaps most surprisingly, having taken the GWWC pledge is (within our sample) significantly associated with stronger support for LT over NT.
I agree. We have to take into account that 80k strongly pushed for careers in AI safety, encouraged field building specifically for AI safety, and the job board has become increasingly dominated by AI safety job offers. And the trend is not likely to be reversed soon.
However, that does not keep people outside of EA to obtain jobs in the GHD field (which is not just development economics, as someone wrote one day); they are just not accounted for. And if the movement keep giving opportunities and funding specifically towards AI safety, sure we’ll get less and less GHD people. So it’s still impressive, taking all this funding concentration, that we get so many EAs that still consider GHD as the most pressing cause-area.
This raises some hackles in me, gender & race are both dimensions of privilege (‘based in US’ is a much less clear marker of privilege in this context). This is speculation, but I wonder if psychological distance from suffering is a strong predictor of longtermist beliefs; i.e. that suffering yourself or being in a context of suffering leads you to prefer near-term causes. This, at least, is one thing I think critics of longtermism take issue with (at their strongest & in best faith).
Of course. It is much easier for privileged individuals to relate to the suffering of minds that do no exist yet compared to the very real suffering of people and animals today that force you to confront your emotions and uneasiness towards those who have so little when you have so much.
The divide between gender and cause-area is obvious (not just from this study but also from my own EA group!). Women in general care much more about GHD and animal welfare and dislike fixing technological issues with yet another technology; they want more systemic change. That some privileged men who benefit from the current status quo do not want to change the current power dynamics and prefer to think about future beings who do not have a voice yet to feel useful is hard to deny.
Sadly I have not seen any research mixing gender dynamics and longtermist urgency.
Thanks for the great work as usual. This is a very good snapshot of where people are at.
I would love to see an analysis that normalizes for meta funds flowing into causes areas. In @Joel Tan’s recent Meta Funding Landscape post, he states that OP grants 72% of total meta funds and that the lion’s share goes to longtermism.
From his post:
And although the EA Infrastructure fund supports multiple cause areas, if you scroll through the recent grants you might be surprised at the percentage going to LT.
Funders should, of course, prioritize the cause areas they want, but I hope to make it clear to people that when a vast majority of funding goes to prop up one area, it should be no surprise that that area has lots of adherents that advocate it.
Normalizing some of this data for meta-funding received would show that, among other things, GH&D is on top DESPITE a significant LT funding advantage.
Many thanks Devon!
I agree if you adjusted most of these results by a factor of 3/4x (for the LTF vs GHD/NT ratios above), you’d see GHD/NT ahead pretty much across that board. The biggest ratios in favour of longtermism in the results above are ~2x (though closer to 4x among the highly engaged specifically).
That said, I think the relationship between funding and intra-EA influence is unclear. I would expect large diminishing returns, and for a lot of Meta resources to not be spent on intra-EA influence. My guess is also that a lot of the influence driving people from neartermist to longtermist causes comes from the support of EA elites in a way that is partially separable from funding.[1] So adjusting by the funding ratio would not be straightforward.
Obviously funding levels and influence are causally related in both directions. That said, I imagine OP/80K/CEA and advocating for cause areas would have significant influence independent of their funding levels.
In the traditional breakdown used in EA, the animal cause is split into two (Farm Animal Welfare and Wild Animal Welfare), but if we consider the two together, it appears that concern for animals actually reaches 23.8%, ahead of AI-related risks (23.2%).
I’m rather surprised by this result, as it is quite different from the funding breakdown.
First off, thank you for this research and for sharing it with the community. My overall feeling on this work is extremely positive, and the below is one (maybe my only?) critical nitpick, but I think it is important to voice.
I have to object to this. I don’t think longtermism is best understood as a cause, or set of causes, but more as a justification for working on certain causes over others. e.g.:
Working on Nuclear Risk could be seen as near-termist. You can have a person-affecting view of morality and think that, given the track record of nuclear near-miss incidents, that it’s a high priority for the wellbeing of people alive today
We just lived through a global pandemic, there is active concern about H5N1 outbreaks right now, so it doesn’t seem obvious to me that many people (EA or not) would count biosecurity in the ‘longtermist’ bucket
Similarly, many working on AI risk have short timelines that have only gotten shorter over the past few years.[1]
Climate Change could easily be seen through a ‘longtermist’ lens, and is often framed in the media as being an x-risk or affecting the lives of future generations
Approaching Global Poverty from a ‘growth > randomista’ perspective could easily be justified from a longtermist lens given the effects of compounding returns to economic growth for future generations
EA movement building has often been criticised as focusing on ‘longtermist’ causes above others, and that does seem to be where the money is focused
Those concerned about Animal Welfare also have concerns about how humanity might treat animals in the future, and if we might lock-in our poor moral treatment of other beings
(I’m sure everyone can think of their own counter-examples)
I know the groupings came out of some previous factor analysis you did, and you mention the cause/justification difference in the footnotes, and I know that there are differences in community cause prioritisation, but I fear that leading with this categorisation helps to reify and entrench those divisions instead of actually reflecting an underlying reality of the EA movement. I think it’s important enough not to hide the details in footnotes because otherwise people will look at the ‘longtermist’ and ‘neartermist’ labels (like here) and make claims/inferences that might not correspond to what the numbers are really saying.
I think part of this is downstream of ‘longtermism’ being poorly defined/understood (as I said, it is a theory about justifications for causes rather than specific causes themselves), and the ‘longtermist turn’ having some negative effects on the community, so isn’t a result of your survey. But yeah, I think we need to be really careful about labelling and reifying concepts beyond the empirical warrant we have, because that will in turn have causal effects of the community.
In fact, I wonder if AI was separated ut from the other 3 ‘longtermist’ causes, what the others might look like. I think a lot of objections to ‘longtermism’ are actually objections to prioritising ‘AI x-risk’ work.
Thanks for the detailed comment!
We agree and say as much:
And here’s what we say at the linked previous post:
We also explicitly discuss your example of Climate Change making much the same point:
I acknowledge though that your concern is that “this categorisation helps to reify and entrench those divisions”. I think this is possible, but I think that:
There is something[1] unifying these causes
It is important to talk about that (I think we’d be more confused/less informed if we just considered all the causes as separate/independent).
Referring to these clusters of causes and ideas in terms of “longtermism” and “neartermism” is established terminology. Crucially, I don’t think there’s an obviously better set of term, because “existential risk” wouldn’t capture some causes within this bucket (e.g. in previous years we had a “broad longtermism” item which was also part of this cluster)
I think it’s an entirely reasonable view to think discussion of this should be in the text, not a footnote. Though we had a lot of information in both the footnotes and appendix, so it’s tricky.
Though I don’t claim it’s a single thing, rather than a cluster of correlated things. And empirically, our longtermist-neartermist cause scores measure is strongly correlated with people’s stated abstract beliefs. The single abstract item explicitly about longtermism, is correlated with LT-NT at r=0.457, which is appreciably strong for a necessarily noisy cause prioritisation score and single item, in a social science context.
Thanks for responding David, and again I think that the survey work you’ve done is great :) We have many points of agreement:
Agreed that you basically note my points in the previous works (both in footnotes and in the main text)
Agreed that it’s always a hard tradeoff when compressing detailed research findings into digestible summaries of research—I know from professional experience how hard that is!
Agreed that there is some structure which your previous factor analysis and general community discussions picked up on, which is worth highlighting and examining
I still think that the terminology is somewhat misguided. Perhaps the key part I disagree is that “Referring to these clusters of causes and ideas in terms of “longtermism” and “neartermism” is established terminology”—even if it has been established I want to push back and un-establish because I think it’s more unhelpful and even harmful for community discussion and progress. I’m not sure what terms are better, though some alternatives I’ve seen have been:[1]
Richard Chappell’s “Pure suffering reduction vs Reliable global capacity growth vs High-impact long-shots”
Laura Duffy’s “Empirical EA vs Reason-driven EA”
Ryan Briggs’s “Bed-nets vs Light-cone”
I guess, to state my point as clearly as possible, I don’t think the current cluster names “carve nature at its joints”, and that the potential confusion/ambiguity in use could lead to negative perceptions that aren’t accurate became entrenched
Though I don’t think any of them are perfect distillations
Thanks JWS, it certainly sounds like we agree more than we disagree.
That’s definitely fair!
For what it’s worth I think that the explanation for differences in support for these two different clusters of causes is more epistemic and than it is to do with attitudes towards the longterm or near term per se.[1] Ideally, I’d like the terms we use to not (be seen to) refer to the explanation for supporting the causes at all, since I think the reasons are heterogeneous.
In any case, we definitely agree that none of these terms are perfect, and I suspect no terms are going to be completely satisfactory, but I’m open to continued discussion about what better terms would be.
Although, in terms of predicting “LT minus NT” cause prioritisation from our cause-related idea items, the “long term future” item and “low probability, high impact” items were about equally predictive.
Interestingly, this also holds true in unpublished work we have looking at the general public, for whom objections that influencing the far future is impractical or impossible are more consequential than their lack of concern for future generations.
FWIW I made my comment with that in mind, I think those causes involve more psychological distance even if they’re not explicitly longtermist
Could this be added to the EA survey 2022 sequence?
Done!
Thanks!
Executive summary: The EA Survey reveals that Global poverty, AI risk, and Biosecurity are the highest prioritized causes, with longtermist causes being favored especially among highly-engaged EAs, and that key philosophical ideas are associated with cause prioritization.
Key points:
Global poverty, AI risk, and Biosecurity are the top prioritized causes overall, with Climate change polarizing and Mental health lower priority.
Longtermist causes are prioritized by 63.6% of respondents vs. 46.8% for neartermist causes, a gap that widens among highly engaged EAs.
Prioritization of longtermist and existential risk causes has increased over time, while Global poverty has decreased but remains high.
Higher engagement predicts greater support for longtermist over neartermist causes, while higher age predicts the reverse. Other demographic factors have smaller effects.
Philosophical ideas around longtermism, risk neutrality, and digital sentience correlate with longtermist cause prioritization. Belief in ant sentience is substantial.
In an allocation task, respondents assign the most resources to Global health/poverty, then AI risk, then animal welfare, with actual allocations lower on Global poverty and animal welfare than the survey or an earlier survey of EA leaders.
This comment was auto-generated by the EA Forum Team. Feel free to point out issues with this summary by replying to the comment, and contact us if you have feedback.
This is not a bad summary overall, but has some errors/confusions:
Both parts of this are technically true, but the statistic referred to in the first half of the sentence is different from the one that we reported to show the gap between low/high engagement EAs.
Comparable statistics would be:
Overall: 37.6% of respondents most prioritised only a longtermist cause, 21.0% most prioritised only a neartermist cause.
Among the highly engaged, 47% most prioritized only a longtermist cause and only 13% most prioritized a neartermist cause.
Among, the less engaged 26% most prioritized a longtermist cause and 31% most prioritized a neartermist cause.
True looking at farmed animal welfare, but a combined animal welfare category would be neck and neck with AI (slightly ahead but not significant).
Actual allocations to Global Poverty are higher than our survey allocations and actual allocations to FAW are lower. I don’t have statistics for actual allocations to WAW, but they are likely dramatically lower.
Super nice work and kudos for breaking down by demographics. On that topic, do you see that any changes over time in cause prioritization could be explained by changing demographics? You mentioned e.g. engagement level predicting cause prioritization. I am then thinking that if the % of low to high engagement EAs have changed over time, perhaps that partially drives the trends in your 4th chart?
Thanks!
Yes, that’s definitely right, and one of the reasons why we plotted the interaction between engagement and time in the appendix.
The percentage of high engagement EAs (using the simple binary measure) has increased over time, from 44% in 2019 to 49% in 2020 and 55% in 2022. So you would expect this to increase support for causes which are shown to be more strongly supported by high engagement EAs across those years. That said, looking at the interaction plots, you can also see that support for Biosecurity and Nuclear and AI has increased among both high and low engagement EAs over that time period,
Thanks and sorry I missed that.
Could you explain the ‘mental health’ cause area more? Is that about mental health of EAs, mental health as a global health intervention, or some combination of the two? Is the label unambiguous in the survey? (I’m sure this has been answered somewhere but it’s unclear from this post)
Thanks for the question Huw. This is in reference to the EA cause mental health, rather than mental health for EAs (which would fall under movement building (assuming that the purpose was building the movement, rather than just narrowly helping EA)). This was a requested addition from 2018.