I am a researcher at the Happier Lives Institute. In my work, I assess the cost-effectiveness of interventions in terms of subjective wellbeing.
JoelMcGuire
Karma: 3,438
Hi Jamie and David,
Really cool work. It’s striking how much higher mental health is in importance and support than GHD. Do you have any insight into why this is and what people are imagining when they’re referring to mental health?
I interpret this as very weak evidence that there’s an audience for global mental health / mental health related EG that is non-overlapping with GHD (that is, there are MH givers that wouldn’t otherwise give to GHD). But of course 1. most philanthropy is domestically oriented, and presumably that’s what people mostly have in mind here as well. 2. It’s in my self interest to read the data this way, so wondering what y’all think.
Do you know how hard it’d be to tease our real answers to these questions if you couldn’t answer them with current data? E.g., by adding questions to the next round of the pulse data.
I appreciate the caveat and you sharing your best guess!
This is super helpful to have explained and makes more sense now.
So what is your best guess of the cost per student educated given Malengo’s expected ability to recycle costs and leverage? What is the cost per person Malengo educates / facilitates the immigration of that you would put into my BOTEC?
Thank you for the response Richard!
I’m going to focus on the funds recycling since this seems like it may be the most important bit.
Since you’re assuming $1mil recycled for a budget of $5mil does this imply that you will recycle 20% of costs? If so, that seems low given everything else you’ve said, so I assume I’m missing something.
The leverage point is really interesting. Do you have any current prospects for making the leverage work? I would guess you have to wait (how long?) to see if the default rate is sufficiently low for the ISA?
What has to be true for this to work out financially? Something like the real rate of return on $ / euro invested in students has to be equal or greater than the interest rate on the loan?
It’d be great to hear more about this!
When you mention $2k and $400 per student, could you explain how this differs from the $30k listed as the best guess in the spreadsheet. Sorry for all the questions, I just want to understand!
Howdy Nick,
I was secretly hoping you’d show up given your past comments about brain drain.
Can you explain the pathway that immigration “may be one of the single greatest ways to increase human wellbeing”. I can see how it has the potential to do good in many cases but “one of the single greatest” is a big call.
Right, this comes from Sam and I’s previous look into immigration. Based on this work, our working model is that immigrants adapt to the level of wellbeing (proxied by satisfaction) of the host country. If we take this seriously, then there’s no known intervention that is more powerful than immigration. We can imagine this is plausible because immigration is a super intervention where you are getting tens to hundreds of potentially positive economic, health and psychological interventions altogether. Now, I also take this as a bit of a puzzle. Is it really the case that immigrating from India to the USA is ~2x better than moving from moderate to minimal depression symptoms?
One further thing is that this depends on preferring measures of satisfaction to happiness / mood. In some ongoing work it seems like the Kenya / Nigeria are about as happy as the UK even though they’re less satisfied.
I’m curious what you think about this, since you’ve supposedly made the move down the ladder of life satisfaction by going from NZ to Uganda (but this is I assume a relatively smaller dip in terms of daily happiness).
Also this...”immigration ultimately will be critical to maintaining the balance of power of democracies against autocracies”. How would this work?
I could have spoken more precisely here—I meant that immigration is critical if we can do it right and not have it undermine our democracies (which is arguably what’s happened in the USA).
This topic is outside of my happiness wheelhouse, and involves putting on my much smaller hat of geopolitics dilettante. But I buy the argument that to compete economically and deter militarily autocracies like China the west will need to be constituted by much larger countries, or have tighter alliances. Both prospects seem bleak at the moment. This is of course assuming we don’t have an AI singularity and the world looks relatively normal by 20th century standards.
Do you think that immigrants are more likely to vote against autocratic leaders?
I’m not super familiar with the literature but I lean towards “yes”, but I imagine this could depend quite a bit on the country of origin and the filter (e.g., Cuban Americans tend to be very anti-communist and Republican).
Hi Johannes and Richard,
It’s great to see the work of Malengo continuing! What a fascinating, ambitious project. Some questions.
What share of the costs do you expect to be recovered through the income sharing agreements? You seem to think this is quite high, and that seems plausible. But I’d be curious to think how this should be reflected in the current cost per person if it isn’t already.
Out of curiosity I did a BOTEC of Malengo in WELLBY terms. The cost-effectiveness depends strongly on the assumption of cost coverage through the ISA. I make some other assumptions that are conservative:
Assumption: That the wellbeing benefits don’t increase over time, but last the rest of life. As I explain below, we might expect these to increase as students integrate. On the other hand, if these are driven by receiving counselling, then these would decrease over time (how many receive counselling and what’s the dosage?) – to be clear I think this would be strange if true. Overall, I think this is the most conservative assumption.
Assumption: that the spillover benefits last until parents pass away. I assume the mechanism is remittances and these will last until parents pass away. I also assume no further emotional spillover benefits to the family that the beneficiary will form if they stay in Germany. This is hard to think about but seems consistent with assuming a relatively efficient mating market.
Clarification: is the cost per person the presumed cost to support someone all the way through their (7 years hopefully less?) of schooling?
What is the effect on SWB / MH disaggregated by measure? Also, what were the absolute values for the SWB / MH measures at baseline? I’ve recently been doing some work comparing the difference between happiness / affective measures and satisfaction. This has led me to think the difference between a country’s happiness is much less than their satisfaction. So my guess is that the effects on satisfaction are larger than happiness / mood / MH.
Most evidence about immigration and SWB suggests convergence towards the host country SWB. It’s hard to tell, because of the aggregation, but this seems to tentatively point against that. But a year isn’t that much time, so I guess prior evidence would suggest to me that the effects grow with more time.
That said, this could also show something weird / interesting about SWB scales. What you have is just about the only causal effects of immigration on wellbeing outcomes (I think there’s one other study but I remember being unsatisfied with it). While this seems like pioneering work by itself, it’s also maybe a way to crack open the black box between cross-country wellbeing comparisons and what drives them. It’d be really interesting to ask the Malengo beneficiaries something like how they remember their wellbeing back in Uganda. I wouldn’t be totally surprised if their scales are also changing in response to moving.
I think immigration may be one of the single greatest ways to increase human wellbeing, and (a hotter take) ultimately will be critical to maintaining the balance of power of democracies against autocracies—which seems important for the future to me. Now the awkward question. The programme on a small scale seems like it shouldn’t raise concerns about wider societal spillovers, but I doubt you’d be doing this if you wanted it to remain on a small scale! What are your thoughts on the potential negative political side effects of increasing immigration in Germany?
This may be my skittishness as an American, but immigration seems to fuel anti-immigration parties which tend to be more illiberal in other ways unrelated to their immigration policies. This seems also to be true in the case of Germany.
Here’s the expected rejoinder:
“This may be the case for lower skilled (I know there must be a better term than this) immigration, but these individuals will be college graduates – and not only that they’ll be educated in Germany so they’ll be better able to navigate Germany’s proclivity towards certifications. The data on the economic integration (as proxied by unemployment) of immigrants that are German college graduates is much higher (see this OECD report, 2024). Furthermore, much of the cultural backlash is based on religion, given that Uganda is 80%+ Christian, Ugandans may be better at supporting traditional German values than natives!”
Would be curious to know your thoughts, but I get the discussion of immigration poitics is a difficult topic, so I understand if you don’t want to opine publicly.
Again, fascinating, and very cool work! I wish it to succeed.
I think this maybe highlights that it’s best when possible to bypass these acrimonious debates and avoid the loaded language they use.
We probably shouldn’t take them too seriously (as in assuming anything that vaguely pattern matches with colonialism is immediately bad), but this doesn’t meaning embracing colonialism revisionism either.
I think it’s probably extremely useful to avoid associating ourselves with arguments such as those that try to revise colonialism into “actually good”.
I think that even if we can think of cases where one could argue “colonialism good” (maybe French Guiana), it’s probably best to dissociate from such arguments and instead have a conversation about the origin of institutions and which ones lead to better and worse outcomes.
“Colonialism good” feels sort of like trying to reclaim eugenics. Just come up with a different term that doesn’t mean the thing the people who you’re arguing again will think of like “slavery, the Belgian Congo, or the partition of India”. And if you’re trying to defend those things, please for the love of the Good, keep EA out of it.
I think the Sudanese civil war is a relevant comparison. I’d take the typical EA point to be something like:
“If Western diplomats spent as much time as they’ve (ineffectively) spent trying to avert famine / improve aid in Gaza as ending the war in Sudan, it seems like there would have been much more progress—fewer dead, starving, maimed, irreparably emotionally harmed.”
Or one level deeper, there are probably conflicts that are not yet happening that we could decrease the likelihood of and that are probably even more neglected. I’m thinking of Ethiopia and Tigray, which seems like it could flare up again. It’s probably easier to avert a war than stop it, and fewer people are focused on it for normal reasons related to attention and incentives (preventing things that aren’t naturally inevitable is always undersupplied because you rarely if ever get credit).
To a broader formulation of the question: “Should more EAs be focusing on reducing conflicts given their role in causing suffering and sapping the potential of sentient life?”—I am deeply sympathetic to this. But between conflicts I think we should still apply the prioritization lens.
Alcohol taxes seem like the go-to intervention from what I can tell. Kilian et al. 2023 reports that doubling alcohol taxes reduces alcohol consumption by 10%. But I’m unsure the causal-correlational mix of the evidence. When I’ve looked at less comprehensive reviews of only natural experiments, they come off as more equivocal.
Does anyone know of any organization’s focusing on advocacy for alcohol taxes?
Reset Alcohol is an initiative by Vital Strategies, which has received a $10mil grant in 2024 (following $15 million in 2022) from Open Philanthropy. They reportedly contributed to the passage of a recent alcohol tax in Sri Lanka. Concentric Policies appears to be focusing on tobacco control—presumably because they / AIM thought it was more tractable?
Someone should commission new moral weights work in the next year
The moral weights of animals seems like one of the most important inputs into cause prioritization. The difference between whether we use RP weights or neuron count is the difference between whether the present contains more happiness than suffering, and potentially whether humanity has been overall good or bad for wellbeing.
This also poses challenges to the future. Averting catastrophes is profoundly insufficient if the default trajectory for wellbeing is negative (and potentially worsening). Indeed, if the default trajectory is negative (and we have no good ways of changing it) we can imagine the universe giving a sigh of relief if we were filtered out of the cosmic pool of awareness.
Given the profound importance for cause prioritization—if the present is overall negative for wellbeing I think it implies we should focus much, much more on making the future and present go well than go long—we should have several independent well resourced attempts to answer the question of “how do we weigh the wellbeing of animals versus humans?”
There’s also the historical fact that the last time someone (the Imperial Japanese) tried this on the U.S. (Pearl Harbor), it ended up being disastrous for them.
I think there’s an important disanology with a first strike against the USA now. Japan woefully underestimated the USA’s manufacturing ability. We rebuilt all our lost fleet and then some. I really doubt we’d be able to rebuild in the time it’d become relevant to actually challenge the PRC—indeed you seem to be aware of this issue. I think it’s better to imagine China as the USA during WW2 in terms of capacity to fight an industrial war.
And yes, I agree that trying to match China industrially is setting yourself up for failure. I think there could be a smarter way as you note (and note I noted! - Hah!) by focusing on less flashy but highly lethal and asymmetrical systems. If I was China I’d really want to know how well Taiwan’s autonomous naval drones work.
In general regarding EA involvement in this though, I think a lot of thought has already been put into these concerns by the people within the NatSec establishment, such that I’m not sure what EAs can actually add to the equation.
Yep, I think this is super fair. I’m not sure if we have something to contribute, but I lean towards an optimistic maybe. One of the key points I wanted to make is that given the risks involved, it seems like we should try a little bit harder to see if we can carefully contribute in a clearly beneficial way before throwing in the towel.
Also thanks for the kind words! I’ve found your comments very helpful. You may be right! I think we should try harder to find out, the stakes are high.
I don’t think China would need to be deterred forever. I think it would need to probably be deterred for the next ~10 years. After which…
India will probably step into global power status, and become a peer competitor with China. Unless they’ve settled their substantial border issues, this seems like a very plausible source of conflict from the PRC’s perspective. Most interstate conflicts are border skirmishes (I think).
I note this in the essay, but the PRC is in a rough neighborhood. If they act on Taiwan they need to be confident they can also ensure that a competitor like India doesn’t take the opportunity to make a move to resolve a border dispute. The same goes for any adversary who they have conflicting territorial claims with in the South China sea.
Whatever is happening with AI will probably pan out and for better or worse we’re in a world beyond our ability to easily imagine.
Demographic issues in China will start to bite which I think will relate to a broader risk aversion (a pretty weak reason).
More military power could also increase the costs in case of an invasion, so you need to be quite confident that deterrence will work and continue working indefinitely.
Yes, I agree on the first part. Not on the “indefinitely” part.
To me, the most tractable part of this equation seems to be the chance that the USA intervenes, but I’m profoundly uncertain if it would be better for the world if this were higher or lower. Do you have any views on that?
Reducing the chance the USA intervenes doesn’t strike me as very tractable. What are you imagining here?
Grassroots campaigns towards isolationism (isolationism is now associated with the right so not sure about that)
General advocacy of austerity with cuts to defense budget (that could do it but less direct and very hard to do).
Make some deal with China conditional on non-intervention in Taiwan?
I’m a little nervous around geopolitics as a philanthropic cause area cause it seems so easy to harm when information and calculations are imperfect (and our information will be extremely imperfect). [...]
Do you think there are clear things we can do in this space to mitigate downside risks?
I am also nervous and agree with the downside risks. I suspect there are some clear actions we can take, but I think we definitely need more research to know which are the best of the bunch.
I do stand by one of my main arguments that encouraging Taiwan to defend itself more smartly will make it less likely China invades. But I’m not committed to this as being the most cost-effective option. There are many other options I spent less time on like advocating that the USA minimize unhelpful and inflammatory diplomatic showmanship like the Pelosi visit.
You’re welcome! Thanks for the kind words.
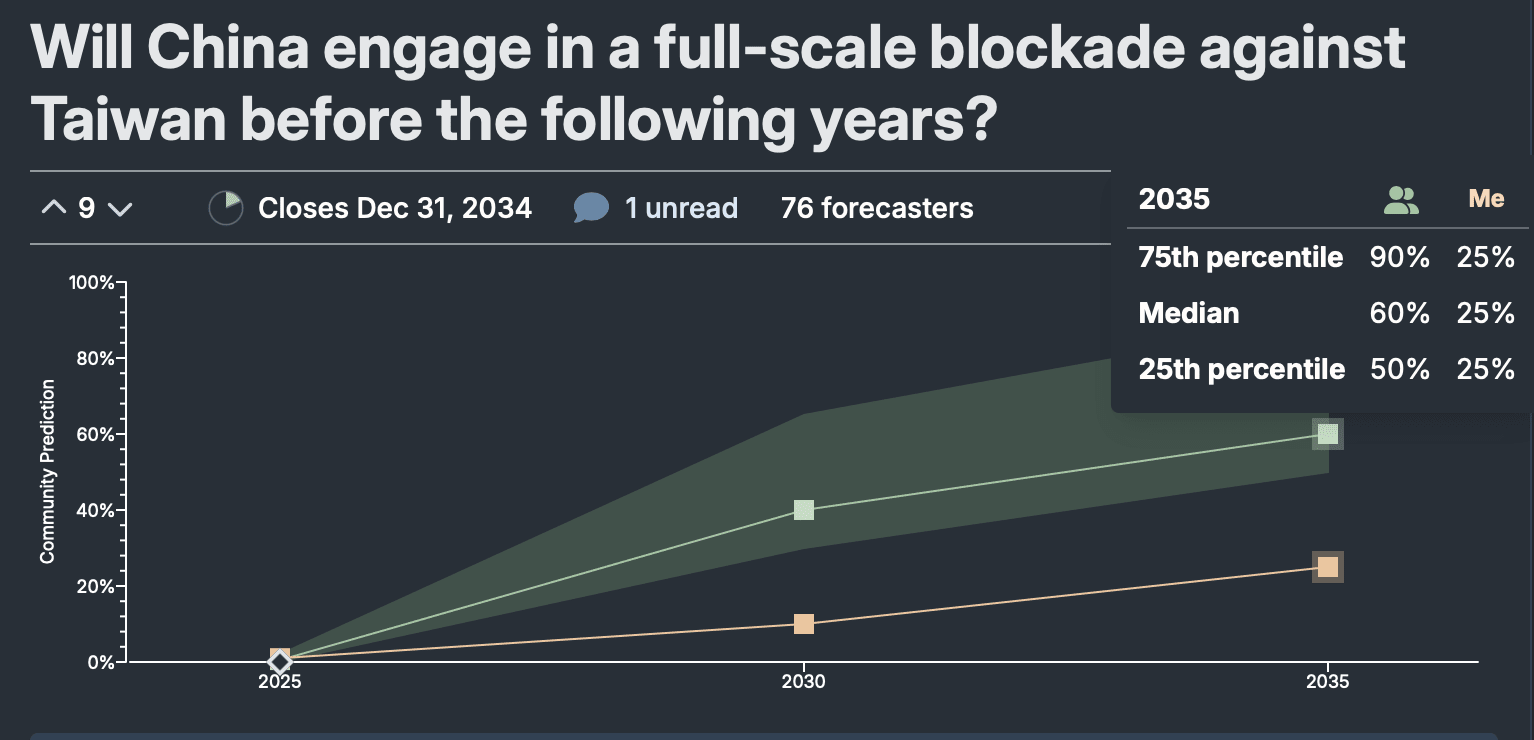
I think the likelihood of a blockade is lower than the metaculus community, but this is a low volume question.
I disagree with Hugh White. This is for a couple weak reasons.
Many of the experts I trust seem to think this is a less likely scenario. I don’t know Hugh White well, but he came off a bit more “talking head” than calibrated analyst (or hedgehog than fox) to me (I’ll probably try and explain this in another comment).
My model of Xi / the PRC is that they want to minimize the time they’re exposed to potential diplomatic pushback. I guess that fait accompli = good, with the example of the Russian occupation of Crimea as ideal. Act before anyone can really get angry. A blockade seems like something they may want to threaten but I doubt they want to engage in.
It would potentially take a really long time to squeeze Taiwan (6 months to 2 years?). All this time could potentially galvanize global support for Taiwan, and consolidate anti-PRC / resistance sentiment within the country. It’s hard to justify internationally that you are trying to starve a whole country. It’s probably harder to justify than what I expect the PRC would prefer which is to actually do what Russia planned on doing—a quick 3 day operation where they take out military sites and the head of government and say “we had information Taiwan was about to declare independence. We have taken out the separatists, and protected the unity of the Chinese people.”
During this time it wouldn’t be too hard for Taiwan to ensure their fabs are destroyed if the PRC invades and to smuggle out key TSMC staff to Japan / USA in return for USA airlifts or something.
Indeed, I’m pretty sure blockades are considered an act of war under international law. If so, this would potentially allow Taiwan / the USA to attempt to break the blockade at a time of their choosing with justification. So I think a blockade could potentially leave the Chinese navy very vulnerable.
Blockades don’t have a strong track record of forcing capitulation. See Israel and Gaza, USA and Cuba, or USSR and Berlin.
If they fail then the PRC has lost their opportunity for a surprise attack and a good amount of credibility.
I strongly doubt the USA would sabotage Taiwan fabs. I mean, I think if anything Taiwan would do this themselves (but only if a Chinese invasion was inevitable). Sure the USA, may want to make sure Taiwan has these plans, but I don’t think they’d unilaterally sabotage the fabs. Is there any precedent for anything like this? We didn’t even destroy a fraction our massive amounts of valuable US hardware from getting into the hands of the Taliban—granted those were tactical rather than strategic assets. Maybe I’d update this if it turns out the USA was behind Nordstream 2 -- I thought that turned out to be Ukraine though.
But I’d welcome more forecasts and breakdowns of these scenarios!
I would love to hear someone make a more detailed argument about how this would affect things.
Naively, invasion --> Taiwan fabs destroyed --> timelines pushed back a couple of years.
Longer timelines typically considered good because it means more time to do safety work.
But my gut says that when the supply chain is rebuilt this would mean China has a relatively larger share of high end chips (but very, very unclear) --> race dynamic is tighter --> world more dangerous.
Net effect --> ???
I guess my question is: how much risk reduction would there be if USA stopped messing with the world?
If the messing around pertains to Taiwan -- a naive implication of my model is if the USA had a 0% chance of intervening in Taiwan this would decrease the risk of catastrophe by around 1% (percentage point). This seems difficult to influence though.
Howdy Huw,
I think that Xi has shown himself less sensitive to economic pressure than previous premiers or the leaders of more liberal countries (see zero Covid). I’m concerned that he sees himself in some manner similar to Putin—in that they both have historical missions to fulfill. The great rejuvenation of the Chinese nation in Xi’s case. A lot of his action’s and PRC industrial policy (squeezing certain seemingly decadent sectors like gaming and propping up manufacturing) is probably bad for growth in the long run. But they are consistent with a China that bases its economy on something more material and connected to power (and the ability to win a protracted war).
This is all to say, I don’t see trade as a major detterent even if it was a possible threat. But I think when it comes to trade, I’m concerned that stable authoritarian regimes just have more leverage due to their willingness to replace consumption with patriotism in a way that seems to have no equivalent in modern democracies.
There’s still potentially something here, I just haven’t given it too must time or thought. One of the many good questions I wish we had better answers to.
The timeline would depend on the magnitude of the scale. I think a good analogy is to see how long it’s taking Poland’s military to absorb it’s sizable surge in investment spending. In short I’d guess anything substantial would take years.
And definitely it’s a risk. I think a key assumption is that the PLA isn’t yet ready to invade. If we were already in that window, then I’d be more concerned by the risks of that strategy.
I’m sure there’s some good empirical analysis that is either possible (or more likely) already been done that could inform this question—but it’s just far enough outside my wheelhouse that I haven’t found it.
Are there any EA organisations that fund creation of popular media in order to deliver impact? If not, why not?
The closest thing I’ve seen is https://www.shouldwestudio.com . The founder was on 80k and Clearer Thinking recently.
This is a good answer and gives a lot of important context, thanks Joseph.
Regarding the conscription, I tried but failed to get a sense if it got more serious since they went from 4 months to a full year of service.
I can’t respond because I don’t know what “significantly reduce” means. 0.01%? 10%?