‘Dissolving’ AI Risk – Parameter Uncertainty in AI Future Forecasting
1 - Summary
This is an entry into the Future Fund AI Worldview contest. The headline figure from this essay is that I calculate the best estimate of the risk of catastrophe due to out-of-control AGI is approximately 1.6%.
However, the whole point of the essay is that “means are misleading” when dealing with conditional probabilities which have uncertainty spanning multiple orders of magnitude (like AI Risk). My preferred presentation of the results is as per the diagram below, showing it is more probable than not that we live in a world where the risk of Catastrophe due to out-of-control AGI is <3%.
I completely understand this is a very radical claim, especially in the context of the Future Fund contest considering error bars of 7%-35% to be major updates. I will defend the analysis to a degree that I think suits such a radical claim, and of course make my model available for public scrutiny. All of my analysis is generated with this spreadsheet, which is available to download if you would like to validate any of my results.
Some general comments on the methods involved in this essay:
My approach is to apply existing methods of uncertainty analysis to the problem of AI Risk to generate new findings, which I believe is a novel approach in AI Risk but a standard approach in other disciplines with high levels of uncertainty (like cost-effectiveness modelling).
Rather than a breakthrough insight about AI itself, this essay makes the case that a subtle statistical issue about uncertainty analysis means low-risk worlds are more likely than previously believed. This subtle statistical issue has not been picked up previously because there are systematic weaknesses in applying formal uncertainty analysis to problems in EA / rationalist-adjacent spaces, and the issue is subtle enough that non-systematised intuition alone is unlikely to generate the insight.
The intuitive explanation for why I report such different results to everyone else is that people’s intuitions are likely to mislead them when dealing with multiple conditional probabilities – the probability of seeing a low-risk output is the probability of seeing any low-risk input when you are stacking conditional probabilities[1]. I avoid my intuitions misleading me by explicitly and systematically investigating uncertainty with a statistical model.
The results pass several sensitivity and validation checks, so I am confident that the mechanism I describe is real, and should affect AI funding decisions going forward. There are limitations with the exact parameterisation of the model, and I will explain and contextualise those limitations to the extent that I don’t think they fundamentally alter the conclusion that distributions matter a lot more than has previously been understood.
The conclusion of this essay is that for the average AI-interested individual nothing much will change; everyone was already completely aware that there was at least order-of-magnitude uncertainty in their beliefs, so this essay simply updates people towards the lower end of their existing beliefs. For funding bodies, however, I make some specific recommendations for applying these insights into actionable results:
We should be devoting significantly more resources to identifying whether we live in a high-risk or low-risk world. The ‘average risk’ (insofar as such a thing actually exists) is sort of academically interesting, but doesn’t help us design strategies to minimise the harm AI will actually do in this world.
We should be more concerned with systematic investigation of uncertainty when producing forecasts. In particular, the radical results contained in this essay only hold under quite specific structural assumptions. A considered and systematised approach to structural uncertainty would be a high-value follow up to this essay about parameter uncertainty, but would need to be written by an expert in AI Risk to move beyond surface-level insight.
More generally, the analysis in this essay implies a reallocation of resources away from macro-level questions like, “What is the overall risk of AI catastrophe?” and towards the microdynamics of AI Risk. For example, “What is the probability that humanity could stop an AI with access to nontrivial resources from taking over the world?” is the best early differentiator between low-risk and high-risk worlds, but it is a notably under-researched question (at least on a quantitative level)
Somewhat interestingly, the method used in this paper was initially developed by rationalist luminaries—Anders Sandberg, Eric Drexler and Toby Ord. Their paper is well worth a read on its own merits, and is available here.
2 - Introduction
2.1 Context
As part of the Effective Altruism Red Teaming Contest I wrote an article arguing that there were systematic limitations with uncertainty analysis within the EA space. The judges were extremely kind to highlight some of the stronger features of the article in their commentary, but they did note that I failed to adequately defend the importance of uncertainty analysis, particularly in areas in which highly sophisticated measurement and quantification are less central. While the errors of explanation were entirely mine, this article will hopefully address that gap, and function as an example of the sorts of insights that can only come from systematic application of the uncertainty analysis toolkit.
This essay focuses on parameter uncertainty, which is to say uncertainty that arises because we are unsure about numerical values for some of our inputs. There are some unique features of models of AI Risk which mean a complete and systematic investigation of parameter uncertainty leads to some very surprising and potentially important results. I will also try to complete an essay on structural uncertainty which will follow a more conventional approach and derive more conventional conclusions, which will more directly function as an example of what might be achieved with systematic analysis of uncertainty in these sorts of situations.
As a small caveat, the state of AI Risk analysis has advanced a very great deal since I was last properly immersed in it. Although I have taken steps to minimise the impact my ignorance has on the analysis (specifically by doing as much background reading as was practical in the time I had to draft the essay), it is extremely likely that I am still using terms which are a decade out of date in places. This is an essay about a statistical concept more than about any particular idea in AI Risk, so although the archaic language is probably jarring I wouldn’t expect it to lead to the sort of oversight which fundamentally alters conclusions. Nevertheless, apologies for the anachronisms!
2.2 Summary of claims
The general claim in this essay is that distribution of risk around central estimates of AI catastrophe is at least as important as the central estimates themselves. This is because most models of AI catastrophe have a number of discrete steps, all of which need to come true in order for bad outcomes to occur. This means worlds where risk is very low will be systematically overrepresented compared to worlds where risk is very high. In this essay I put an optimistic slant on this (“We probably live in a low-risk world!”), but a pessimist might argue that this mathematically means that in worlds where risk is not low then it is likely to be very high compared to what we expect.
A particularly striking demonstration of this is that the Future Fund give a 3% risk of AGI Catastrophe due to an out-of-control AGI as an example of a probability so outlandish that it would result in a major shift of direction for them; in fact, it is more probable than not that we live in a world where the risk of AGI Catastrophe of this kind is <3%.
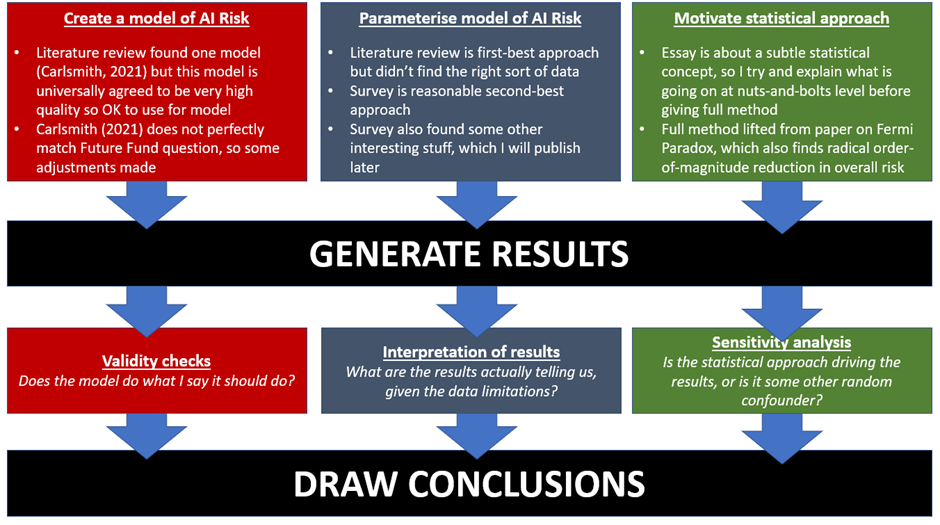
A high-level summary of the structure of this essay is given below.
I don’t want to either oversell or undersell the claims being made in this essay. It looks only at one possible type of AI Risk (an out-of-control AGI permanently disempowering humanity), and has a number of structural and data limitations that should prompt caution before anyone makes any irrevocable decisions off the back of the analysis. On the other hand, I am quite confident the mechanism discussed in this essay is sound; if it is genuinely true that (elements of) the structure of AI Risk can be described as a series of weighted coin tosses, all of which have to come up ‘heads’ in order for this particular Catastrophe to be observed, then the conclusion is mathematically inevitable; the AI Risk community is systematically overestimating AI Risk, probably because it is extremely hard to intuitively reason about asymmetric uncertainty distribution so people are making systematic errors of intuition. Part of the length of this essay is trying to motivate an intuitive understanding of this mechanism so that even if my specific model of AI Risk is later found to be in error the core insight about distributions of risk is preserved.
It might be worth spending a moment to emphasise what this essay does not claim. A claim that we are probably living in a world where the risk of AGI Catastrophe of a certain kind is low does not mean that the risk of AGI Catastrophe is negligible. Low-probability high-impact events are still worth thinking about and preparing for, especially since the Catastrophe described in this essay is only one possible way AI could be bad for humanity. My background is health economics, so I tend to think of interventions as being cost-effective or not: most interventions to lower the risk of AGI Catastrophe that were cost-effective before this essay will remain cost-effective afterwards, since it is a good guess we are nowhere near the productivity frontier of AGI Risk mitigation given how young the discipline is. Moreover, a 1.6% chance of extremely bad AGI outcomes is actually not all that low a probability in the context of how catastrophic the disempowerment of all humanity would be. If a doctor told me a bone marrow transplant to save the life of a stranger carried a 1.6% chance of my death, then I would have to think very hard about whether I wanted to risk the procedure. Fundamentally, this essay is an argument in favour of the importance of uncertainty analysis and examining ex post distributions of uncertainty, rather than making any claims against the importance of AGI Risk.
3 - Methods
3.1 Literature review & Model Structure
Creating a model of the AI Risk decision space is not a trivial problem, and certainly not one a person with lapsed AI Risk credentials like myself was likely to get right first try. In order to identify the state-of-the-art in AI Risk decision modelling I performed a review of the EA / LessWrong forum archives and recorded any relevant attempt at describing the decision space. By ‘relevant’ I mean that the author explicitly laid out the logical interrelationship of the steps between now and a possible AI Catastrophe, and then assigned probabilities to those intermediate steps (in other words it was possible for me to replicate the model of the world the author had used in order to reach the same conclusions as the author). This is a significantly more restrictive filter than it might initially appear – it excludes canonical pieces of writing on AI Risk such as Yudkowsky (2008) or Bostrom (2014) because neither of these include probability estimates and it is not clear they are even supposed to be read as containing a strict logical model of the interrelationships between steps to different AI futures.
I found eleven relevant models, although this slightly overstates the findings; I found Carlsmith (2021) and then ten reviews of Carlsmith (2021) which offered their own probability estimates without offering a significantly revised model of the decision problem. I’ll refer to this conceptual map of the AI Risk decision space as the ‘Carlsmith Model’, in order to differentiate it from the specific probabilities which populate the model given in Carlsmith (2021).
The Carlsmith Model is a six-parameter deterministic decision tree which aims to estimate the probability that AI catastrophe occurs before 2070. The parameters correspond to the probability that each step on the path to catastrophe occurs, with (implicitly) all other outcomes ending up in an absorbing state that we could roughly label ‘No AI catastrophe’. In Carlsmith (2021)’s initial parameterisation, the model gives an output of approximately 5% likelihood of catastrophe. Carlsmith notes that they have later revised this estimate upwards to approximately 10%, but as far as I can see didn’t publish what changes in the intermediate parameters led to this conclusion. There is some limited uncertainty analysis around these central estimates, but this analysis was not systematic and focussed more on scenario analysis than parameter uncertainty. The model is represented in the figure below.
I validated this approach by asking the EA Forums whether they knew of any sources which I had missed, but this revealed no new quantitative models of AI Risk[2]. It did direct me to approximately twenty relevant estimates of individual steps in the Carlsmith Model – mostly in Michael Aird’s database of existential risk – which were not full specifications of the decision space themselves, but might inform individual parameters in the Carlsmith Model[3]. Overall, it makes sense to me that the Carlsmith Model would be the most appropriate model of AI Risk for this question; the framing of the question in the contest announcement specifically highlights Carlsmith (2021) as an example of best practice.
Although the Future Fund question is framed in a way that makes it clear the Carlsmith Model approach is valuable, it also distances itself from the exact probabilities given by Carlsmith (2021). In particular, the Future Fund give their central probability of catastrophe given the invention of AI as 15%, approximately three times higher than Carlsmith (2021). This is not necessarily a contradiction; Carlsmith (2021) and the Future Fund ask subtly different questions:
Unlike the Future Fund question, the Carlsmith Model considers the risk of catastrophe by 2070 rather than the risk of catastrophe at any point in the future after AI is invented. A number of reviewers note that this is a slightly awkward restriction on the Carlsmith Model.
Unlike the Future Fund question, the Carlsmith Model does not distinguish between catastrophe due to an out-of-control AI and a catastrophe due to an in-control AI being misused. This makes sense given what Carlsmith is trying to accomplish, but is a limitation given what the Future Fund are trying to accomplish (specifically, the two outcomes suggest radically different strategies for funding decisions)
The Carlsmith Model is not conditional on AI being invented by 2070 (i.e. there is a step in the Carlsmith Model which is abstracted away in the Future Fund contest), so even if they agreed completely the Future Fund would estimate a higher probability of catastrophe, because AI is sometimes not invented in the Carlsmith Model.
Since this essay considers the Future Fund question explicitly (rather than a repeat analysis of Carlsmith), the specific parameterisation of Carlsmith (2021) was not appropriate, and primary data collection was required to parameterise the model.
3.2 Model Parameterisation
Due to the above limitations of applying the parameters of Carlsmith and his reviewers directly to the Future Fund question, I surveyed the AGI Risk Community[4] with this instrument, which asks exactly the correct questions to match the Future Fund’s question to the structure of the Carlsmith Model. In particular, note that the instrument does not condition on the catastrophe occurring by 2070, and also includes an explicit differentiator between catastrophe due to an in-control AI and an out-of-control AI. I am not a triallist and have no particular expertise in survey design beyond hobbyist projects, so in hindsight there are some design errors with the survey. To this end I would normally suggest that an expert replication of the survey would be valuable, except I think the MTAIR project will be so much better than what I have done here that a replication would be a waste of resources; it is reasonable to use my numbers for now, until MTAIR gives a ‘definitive’ view on what the correct numbers should be. However, it is also prudent to be aware of the limitations with my numbers until MTAIR reports—the biggest weaknesses that I have identified are:
The most major omission was not explicitly conditioning all estimates on the possibility of catastrophic existential risk. Some respondents did condition their estimates on this, some respondents assumed I implicitly meant ‘conditional on no other existential risk occurring…’. This is not the end of the world[5] because it can be routed around with good structural uncertainty analysis, but on average responses will be slightly too high.
There was ambiguity in some of the questions. For example, one question asked about ‘Alignment’ and it was clear some respondents had differing ideas about what that meant in practice. Someone more expert on AI than me wouldn’t have made those errors, and could probably have identified a better set of questions to ask than just covering a summary survey of Carlsmith (2021).
I didn’t offer an opportunity to specify a distribution when respondents gave their answers. This was a deliberate omission because I was going to generate the distributions myself with the SDO method I describe below. However, some respondents described how they had quite complex responses (e.g. bimodal responses) and couldn’t give genuinely accurate answers without the ability to specify distributions of uncertainty.
The survey doesn’t force people to assume AI is invented before 2070, which the Future Fund would like you to assume. This affects seven responses which estimate AI will come later than 2070, plus three more which estimate AI will be invented in 2070 exactly. In theory this could have affected responses because people’s risk estimates could be correlated – for example AI being invented in 2500 gives more time for other sources of x-risk to cause a catastrophe. In practice there wasn’t a significant difference between pre-2070 and post-2070 responders so I have included all responses together.
42 people took the survey. Of these, 14 self-identified as experts—either fully or marginally—and I have separated out responses from these individuals as a separate subgroup in the results.
Generally, data quality was good. The most major issues with data quality was inconsistency with how percentage values were entered (“50%” vs “50″ vs “0.5”). A validation question at the end ensured that all of these errors were caught and corrected. Similarly, some individuals wrote short explanations of their estimates in the response box itself rather than the comment box, but these were also easy to detect and resolve. One rather lovely thing about rationalist-adjacent communities is that when people fill out a survey with odd data they are self-aware enough to recognise the issue and kind enough to explain exactly what their thought process was leading to it. So, for example, when I asked for the year people thought AGI would be invented and someone put a date in the past, they very helpfully explained that they knew this would normally be rejected as junk data but in this particular case they really did mean they thought it already existed!
With this in mind, only very minor data cleaning was undertaken. Aside from normalising probabilities and removing explanatory text, the only data adjustment was a slight compensation for entirely certain estimates. Specifically, any estimate which gave probabilities of 100% or 0% was adjusted to 99% and 1% respectively. This had to be performed in order to allow the conversion of probabilities to odds, and was justified on the basis that entries of 100% or 0% must have been intended as a shorthand for ‘almost completely certain’ rather than actually expressing complete certainty[6]. No other result was adjusted, which means that a reported probability of 99.9% ended up being more certain than a reported probability of 100% in the final analysis. That is slightly inelegant, but it won’t materially affect results generated with the SDO method described in the next section. It might slightly alter some summary statistics generated without the SDO method, but since the whole point of this essay is that those summary statistics are misleading I haven’t added any correction or validation around this point.
Summary results of the survey are reported below. I will update this sentence with a link to the full results dataset once I have had a chance to anonymise them properly[7].
In general, these responses are consistent with the Future Fund’s position on the risk of AI Catastrophe, in the sense that all approaches give a number which is in the 10%-50%-ish order of magnitude. The responses are generally slightly higher than the Future Fund estimate, and I’m not sure why that is – it could be that the Future Fund is unusually conservative on AI Risk by community standards, or it could be a bias I accidentally embedded into the survey and have not identified. Experts are more worried about AI than non-experts, but this seems easily explainable by a selection bias (only people who think AI is very worrying would invest the time and resources to become expert on it).
People’s responses are quite internally valid – their overall estimate of the risk of AI Catastrophe is roughly the same as the estimate made by multiplying each individual step in the sequence together. Furthermore, the agreement between the Expert and the Full dataset is overall good on specific questions. The only exception to this is that there is a substantial difference between the Expert and Non-Expert view of AGI scaling – that is, the probability that an AGI that is given an initial endowment of some high-power resource will convert that endowment into something that can subjugate all of humanity. Non-experts give roughly even odds that we will be able to ‘correct’ a misbehaving AI, whereas Experts suggest that 3 times in 4 we will not be able to fight / contain / bargain with a misbehaving AI. This is the only major difference between the two groups, and appears to drive almost all of the difference in overall result between the Full and Expert dataset.
As a point of analysis, one interpretation of this is that what makes people worried about AGI is fear that we cannot contain a Misaligned AI. That is (pending confirmation of the result) the most effective way for Experts to evangelise AGI Risk would be taking people who are complacent about our ability to contain a Misaligned AI and convincing them it would actually be 1-in-4 hard rather than 1-in-2 hard. A sketch model of the problem space is that non-worriers think of AI deployment as being a bit like virus research – for sure governments are going to do it, for sure someone is going to do something stupid and unleash a pandemic on the world, but probably someone will invent a vaccine or something and everything will be fine. There’s no point trying to convince Non-Experts that Alignment will be tricky because they already agree with you!
Overall, my view is that the Full Survey Dataset is probably more reasonable as a base case than the Expert Survey Dataset. There isn’t really any objective definition of ‘expert’ that would mean that we have any reason to trust the Expert Survey Dataset more, and the Full Survey Dataset gives a response which is closer to what the Future Fund says is its central estimate, making it more appropriate for this particular application. My main reason for including the ‘Expert’ filter was in case Non-Experts gave completely invalid / inexplicable answers, but this did not actually happen – the demographics of the AI Risk Community obviously skew more conscientious than the general population.
Finally, I include a brute-force sense check on my survey work – as a sensitivity analysis I simply multiplied the implied odds given by Carlsmith (2021) and his reviewers by 1.5 and set the ‘probability AGI invented’ parameter to 100% with no uncertainty. This gives the same overall risk of catastrophe as the Future Fund, and so might be in approximately the ballpark of the figures we would get if we asked Carlsmith and their reviewers to repeat the exercise again with precisely the question Future Fund was asking. To be clear, this is a completely ad hoc step with no methodological justification: if Carlsmith intended for any of his estimates to be correlated, I have just broken this correlation. If he had better evidence for some parameters than others I have just deleted this evidence. And so on.
Many thanks to the 42 respondents who have made the forthcoming analysis possible by sharing their expertise and insight.
3.3 Statistical methods
3.3.1 Motivation
As described in the introduction, the statistical methods used in this essay have an interesting heritage. I am lifting the method entirely from Sandberg, Drexler and Ord (2018) – hereafter ‘SDO’ - and these three authors are all rationalist-adjacent in different ways. As far as I know they are all actively interested in AI Risk, so I am a little surprised that they have not applied their method to the problem described in this essay. My guess is that they are too professional to rely on pure survey data as I have done and without this survey there is currently not enough data to use their method.
SDO’s insight was that for a certain class of problem it is extremely dangerous to implicitly treat parameter uncertainty as not existing. They demonstrate this by ‘dissolving’ the Fermi Paradox. The Fermi Paradox is the strange contradiction between the fact that reasonable estimates for the number of intelligent civilisations in the universe who should be trying to contact us put the number very high, but when we actually observe the universe we do not see any signs of intelligent life other than our own. SDO’s argument is that all prior investigations have treated parameter uncertainty as though it doesn’t exist, and as a result tried to calculate the number of alien civilisations we should see. However, SDO argue that this is an incorrect framing; what we are interested in is the probability we see any alien civilisations at all.
This is confusing, and I don’t think trying to pretend otherwise is helpful. Surely, you might think, a high number of alien civilisations (on average) should translate to a high probability of being contacted by an alien civilisation? What made it ‘click’ for me was rereading a comment by Scott Alexander on this study:
Imagine we knew God flipped a coin. If it came up heads, He made 10 billion alien civilization. If it came up tails, He made none besides Earth. Using our one parameter [equation], we determine that on average there should be 5 billion alien civilizations. Since we see zero, that’s quite the paradox, isn’t it?
No. In this case the mean is meaningless. It’s not at all surprising that we see zero alien civilizations, it just means the coin must have landed tails.
I wouldn’t expect to be able to communicate statistics better than Scott Alexander, but I’ve included a second possible construction of this point (my own, this time) in case a different perspective helps explain the issue:
You work in retail. A survey shows you that the average human has less than two legs (because some people have one leg, or no legs). You order all your trousers to be lopsided to account for the fact that a trouser with 1.97 legs matches the average human best. You are surprised when none of your trousers sell. The average number of legs per human matters less than the distribution of those legs.
Part of the reason this is unintuitive is that for most probability problems we come across in everyday life, the number / probability distinction is basically irrelevant. If we throw a large number of dice onto a table then the number of sixes we see relative to other numbers is a pretty good proxy for the probability that we see a six on the next roll. So, most problems are not going to ‘dissolve’ in the way SDO make the Fermi Paradox behave. The specific features of the Fermi Paradox that make it very suitable for the SDO method are:
We reach a final estimate by multiplying conditional probabilities together (ie probabilities for events that depend on whether earlier events in a chain of logic come to pass or not)
We are uncertain about those probabilities, often to the extent that our uncertainty spans several orders of magnitude
There is an enormous, disjunctive, difference between one possible outcome and all other possible outcomes
AI Risk clearly meets points 2 and 3 (although our uncertainly probably spans fewer orders of magnitude than for some parameters in the Fermi Paradox) and my literature review suggested that the most generally accepted model of AI Risk meets point 1. Therefore, we might expect AI Risk to ‘dissolve’ in a similar way to the Fermi Paradox. What we need to prove this is a method for systematising this observation.
3.3.2 Synthetic point estimates
The method used in SDO to make the Fermi Paradox ‘dissolve’ is described as ‘synthetic point estimates’. The authors review the literature on the Fermi Paradox, and extract any estimate of any parameter which makes up their equivalent of the Carlsmith Model (the ‘Drake Equation’). They then populate a ‘synthetic’ Equation of their own by randomly picking one estimate per parameter. They do this many times to form a “collective view of the research community’s uncertainty”. The diagram below might help illustrate this process.
It might be helpful thinking about what the SDO method is going to show in sketch terms before letting it loose on the Full Survey Dataset – this might help motivate the intuition behind the rather startling headline results. Let’s look at the distribution the SDO method would find for one particularly interesting question, “Conditional on [being exposed to high-impact inputs] what is the probability AGI will scale (in aggregate) to the point of permanently disempowering roughly all of humanity?”. The graph below shows every survey response to this question in orange blobs (obviously including some overlapping responses). The blue line was my attempt to create a smooth distribution through these points, to help show where there are overlapping points better [8].
Imagine for the sake of argument that the Carlsmith Model was just this distribution of points repeated six times. The most likely outcome of sampling randomly from the pool of possible answers to the question is 60%, so we might very roughly imagine that the output of the toy-Carlsmith model would 60% six times in a row for a toy-probability of AI Catastrophe of about 5%. The distribution of points is very roughly symmetric, so we’d expect that for every time the model sampled high (70%, say) it would likely sample an equivalent low score a few draws later (50%, say) and so the uncertainty would cancel itself out (we might expect) – 60% * 60% * 60% is very roughly the same number as 50% * 60% * 70% so there is some empirical basis for making this assumption (we might incorrectly conclude). Doing this sampling process just six times isn’t really enough time for central limit theorem to assert itself and so we couldn’t say with confidence that every high draw would certainly be cancelled out, but on average and for practical applications we could be reasonably confident that high and low draws are equally likely.
To be clear, this chain of logic is incorrect – however it is implicitly the chain of logic followed by every single structural model of AI Risk I came across during the literature review, including many discussions where explicit probabilities weren’t given but it was clear that the author had this sort of structure in mind.
In the diagram below I have colour-coded the diagram above to make this point. The red area are draws which are low enough that they make a difference to the overall result (<10%), the orangey-yellow area are draws middling enough that they don’t really affect the final result on expectation and the green area are draws high enough that we might expect them to cancel out the draws in the low area (>90%)
The ‘trick’ here is that the high and low draws do not cancel each other out. In the diagram above, a single draw in the red area functionally means the final probability will be much less than 5%. Imagine for example a scenario where four down-the-middle 60% draws were made, and then a draw of 10%. The overall probability would be 60%* 60%* 60%* 60%* 10% = roughly 1%. So already the probability of the event after five samples is less than our naively anticipated probability after six samples! You might object that this is unfair and that I have just selected a low draw with no compensating high draw. So, let’s assume our final draw is a perfect 100% probability on the final parameter of the toy-Carlsmith model. That means we take our slightly less than 1%, multiply it by 100%… and of course it doesn’t go upwards at all; 100% of any probability is just the probability you started with!
For me, this is the absolutely critical mechanic to understand in order to grok what is about to happen to convert a naïve 18.7% estimate of risk from the survey with with no uncertainty into a synthesised 1.6% chance of risk with parameter uncertainty – intuitively we think of conditional probabilities as being like numbers, but they don’t actually act like numbers in all situations. If the graph above represented my productivity at the widget-factory each day then a bad day (red area) on Monday genuinely could be offset with a good day (green area) on Tuesday. However, because these are conditional probabilities, a bad day on Monday starts me off in a worse position on Tuesday – the best I can do is try to hang on to my already low endowment.
So conceptually, what we are really interested in with the synthetic point estimate is not so much the central estimate for the probability of continuing on to the next step, but rather the distribution of estimates within each parameter (you might notice a bit of a recurring theme here…) Specifically, we are interested in the probability that any particular parameter is sampled low enough that it completely throws off all subsequent calculations. This is significantly more likely to occur when estimates span multiple orders of magnitude, and this is why the SDO method is particularly suitable for some applications (Fermi Paradox, AI Risk) and no better than a simple average in some other applications (rolling dice, predicting sports team victories)
4 - Results
4.1 Base case
4.1.1 Main results
The main results are based on 5000 simulations of the Full Survey dataset, using the Synthetic Point Estimate method from SDO. The outputs of the base case are displayed below. The panel in the top left represents the probability that we live in a world with one of a number of different ‘categories’ of risk, and the panel in the top right offers summary statistics of this graph. The interpretation of the line graph at the bottom is slightly fiddly; the area under the curve between a 0% probability of catastrophe and x% probability of catastrophe represents the fraction of possible worlds with a less than x% risk. Please also note the log scale.
The ‘headline’ result from this analysis is that the geometric mean of all synthetic forecasts of the future is that the Community’s current best guess for the risk of AI catastrophe due to an out-of-control AGI is around 1.6%. You could argue the toss about whether this means that the most reliable ‘fair betting odds’ are 1.6% or not (Future Fund are slightly unclear about whether they’d bet on simple mean, median etc and both of these figures are higher than the geometric mean of odds[9]). However, the whole point of this essay is to encourage people to move beyond summary statistics and do systematic uncertainty analysis, so I don’t want to over-emphasise the 1.6% figure.
In reality, the most important feature of this analysis is the panel in the top left, showing a very high probability that the world we actually live in has a very low risk of AI Catastrophe due to an out-of-control AGI. About 38% of all simulations fall into this category, and another 13% or so before the risk reaches 3%. I think the best conclusion of the Survey dataset is that it is most likely that we live in a world where AI Risk is very low (<3%). This accurately captures and characterises the distribution of possible worlds we might experience, and I think also helps make the ‘so what’ of the analysis more concrete.
A clear implication of this is that there are some worlds where the risk of catastrophe must be absolutely terrifying, to balance out this probability mass of low-risk worlds so that end up with a simple average probability close to the Future Fund’s central estimate. In fact, this is what we see – around 5% of the probability mass covers worlds where the risk of out-of-control AI catastrophe is 50% or greater (i.e. we are as likely to be catastrophically disempowered by an AGI via this one single mechanism as not). Each of these ‘high risk’ worlds cancels out a large number of ‘low risk’ worlds unless you statistically correct for that effect, which one reason why the simple mean ends up so much higher than the geometric mean of odds. So whereas I have placed an optimistic slant on the results (“It is highly likely we live in a world where AI Risk is low”), a pessimist might say, “…but on learning we don’t live in a low-risk world, we also learn that AI Risk is much, much higher than we expected before”.
Please also note that my computer stubbornly refuses to calculate the true geometric mean of odds of the distribution by taking the 5000th root of the results, so I’ve used an approximation. However, this approximation is close enough to the actual value that you can treat it as being correct for the purpose of discussion.
4.1.2 Interpretation
One important question we might therefore want to ask is, “Do we actually live in one of the 50% of low-risk worlds? Or do we actually live in one of the one of the worlds where the risk of AI Catastrophe is worse than the Future Fund estimate?”
This is actually a remarkably difficult question to answer – I answered an analogous question as part of my PhD and it took me deep into machine learning territory I never want to revisit. There are some fairly robust statistical approximations we can use, and even better there are some nice visualisations answering the same question. The graphs below display probability density functions for each question asked in the Carlsmith Model. The density function for ‘safe’ worlds (risk <3%) is graphed in green, the density function for ‘dangerous’ worlds (risk >35%) is graphed in red. What we are looking for is a different shape between the green and red lines that we could use to infer a difference between ‘safe’ and ‘dangerous’ worlds – so for example “There will be strong incentives to build APS systems” is not very interesting to us because the lines basically overlap, but “Alignment is hard” is potentially interesting because there is a big probability mass on the left of the ‘safe’ graph which does not exist in the ‘dangerous’ graph. What this means is that if we can refine our understanding of whether “Alignment is hard” to be confident it is at or below 20%, we can be fairly confident we live in a ‘safe’ world – almost no ‘dangerous’ worlds have a low risk that “Alignment is hard” and very many ‘safe’ worlds do.
| Statement | Distribution |
| There will be strong incentives to build APS systems | |
| Alignment is hard | |
| The AGI system will NOT be deliberately tasked with actions which result in the extinction of humanity | |
| Some deployed APS systems will be exposed to inputs where they seek power in misaligned and high-impact ways | |
| Some of this misaligned power-seeking will scale (in aggregate) to the point of permanently disempowering ~all of humanity | |
| This will constitute an existential catastrophe |
It is horrifically easy to misinterpret these graphs just by eyeballing them, because – at the very least – the base rate of ‘safe’ and ‘unsafe’ worlds is different so you need to use a Bayesian framework to make actual probability judgements. However, there are also a few quite useful implications here if you are prepared to use such a framework. In particular, the highest value of information of AI Risk microdynamics is establishing whether the probability that AI will be deliberately tasked with ending humanity is less than about 60% and whether the AI will scale in power to the point of disempowering most of humanity is less than about 50%. These are the probability judgements that add the most information about whether we live in a ‘safe’ or ‘dangerous’ world. Since the first of these scenarios involves an AI killing most of us anyway (it just isn’t ‘out of control’), realistically the second case is the one we are most interested in.
That is to say, to a first approximation we will learn more about whether AI is likely to lead to existential catastrophe by asking specifically about Containment scenarios than by asking about any other single element of the Carlsmith Model. This is potentially highly actionable for funders, as I don’t think this information was previously known.
4.2 Sensitivity Analysis
‘Sensitivity analysis’ is the process of ensuring that I haven’t just cherry-picked data to get the result I wanted. There are two pre-defined sensitivity analyses I described in the text above. The first is an ‘Expert Only’ subgroup of the Survey Data, the second is a Modified Carlsmith version of Carlsmith (2021) and his reviewers. These outcomes are reported below:
4.2.1 Expert only subgroup
4.2.2 Modified Carlsmith
4.2.3 Interpretation
Both sensitivity analyses show the same basic pattern as the main analysis; the simple mean of results is roughly in line with the Future Fund estimate, but that ‘the mean is misleading’ and the distribution of results disproportionately favours very low-risk worlds. Whereas around half of all possible worlds are very low risk (<3% risk) in the base case, only around 35%-40% of possible worlds are very low risk in the two sensitivity analysis cases. The ‘Expert Only’ analysis shows the flattest distribution of the three analyses conducted so far, and hence has the highest geometric mean of odds. The ‘Adjusted Carlsmith’ analysis has a slightly higher median but a sharper distribution and hence a geometric mean of odds somewhere between the base case and ‘Expert Only’ case.
It is common in analyses of these sorts to go back and retroactively pretend that Modified Carlsmith was supposed to be the main result all along, and put the two Survey analyses as sensitivity. This means that you can say, “My sensitivity analysis gave me results a bit above and a bit below my main analysis, so I’m confident I’ve triangulated the risk correctly”. I don’t think that would be intellectually honest in this case; notwithstanding that I pre-committed to using the Full Survey results before I knew the outcomes anyway, the Modified Carlsmith has no theoretical basis for use (it is inappropriate to just multiply odds by 1.5x to get at what the authors ‘would have reported’ if asked a completely different question). Overall, I am satisfied that the sensitivity analysis supports the main argument of this essay, which is that uncertainty analysis around the distribution of risk in AI Futures is more important than has been acknowledged to this point. I am also satisfied that the sensitivity analysis supports a view that the best estimate for a community consensus on the risk of AGI incorporating uncertainty is somewhere around or below the 3% threshold Future Fund specify would be a ‘major’ change.
4.3 Validity Checks
‘Validity checking’ is the process of ensuring that the model actually outputs what we expect it to output. The gold standard here is to have someone double-check my work cell-by-cell (and I would invite you to download my model and do so from this link). However more commonly we would conduct analyses with particular features in order to ensure the output behaves in the way we expect it to – for example setting values to zero and making sure the output is zero and so on. In this section I’ve highlighted three such analyses which I think give an interesting perspective on the results.
4.3.1 Unadjusted Carlsmith
A very simple validity check is to run the SDO method on the unadjusted data generated by Carlsmith and his reviewers. Since we know Carlsmith (2021) is amongst the best-regarded and best-validated models of AI Risk in the AI Risk Community, this validation check completely abstracts away all the imperfect data collection decisions I have made. This isn’t a good check on the Future Fund question specifically, but rather the claim that before 2070 we would expect to see an AI Catastrophe from any source (not just an out-of-control AGI). The results are basically where we would expect them to be – the probability of being in a low-risk world is much higher than the probability of being in a high-risk world.
4.3.2 ‘Negative Validity Check’
A second validity check is ensuring that the SDO method doesn’t produce these skewed distributions when the SDO assumptions don’t hold (i.e., did I get my implementation of the maths right?). My claim in this essay is that we don’t intuitively understand uncertainty analysis of conditional probabilities, and acting as though uncertain conditional probabilities are certain leads to error. If I generate the same ‘error’ with data where our intuition should be reliable, it implies a problem with the SDO method rather than our intuition. The simplest SDO assumption to relax is that we have significant uncertainty about our parameters, which is also the central claim in this essay and so a negative result here would fundamentally upend the rest of the analysis. In the validity check below, I use the (unadjusted) Carlsmith (2021) estimates, and randomly ‘perturb’ each parameter 20 times to a maximum deviation of 1% from the original estimate. I then perform the SDO method as described above. The result is below. It shows almost exactly the same thing as the Carlsmith point estimates, which is exactly as expected (remember that the original Carlsmith (2021) paper includes a term for whether AI is actually ever invented, whereas this is abstracted out of all analysis conducted for the Future Fund). The only reason the graph appears to have any uncertainty at all is that I do some smoothing to the final curves.
4.3.3 (Very basic) Structural uncertainty analysis
The final validity check I thought might be interesting was to demonstrate how sensitive the results were to structural sensitivity. For example, an unsophisticated objection to the SDO method is that you could use it to generate arbitrarily low probabilities by adding increasingly arcane parameters to the model about which we are uncertain (“…and the universe still exists due to false vacuum collapse” etc). The most sophisticated critique of the SDO method along these lines is probably here – the author argues that, for example, life might arise in places other than planets, so the structure of the Drake Equation shouldn’t have a term for ‘Mean number of planets that could support life per star with planets’ because it overfits the model. With respect to the more sophisticated version of the critique of SDO, we might imagine that some terms in the Carlsmith Model are redundant however carefully Carlsmith workshopped his paper. For example, maybe we think that an AGI disempowering humanity and bad outcomes for humanity are so inextricably linked that we shouldn’t separately sample from them. Similarly, perhaps we think that deploying an AGI on any real-world application whatsoever automatically means the AGI can escape confinement and gain access to high-impact resources. We could therefore create a ‘truncated Carlsmith model’ to take account of this.
The results of the Truncated Carlsmith Model validity check are below. Overall, there is some evidence that the probability of living in a very low-risk world is smaller in the Truncated Carlsmith model (although the geometric mean of odds is largely unaffected). In general, this makes sense to me – the fact it is now impossible to make six ‘low’ draws in a row rules out the possibility of the ridiculously low 10^-6-level probabilities we see in the base case model, but it doesn’t fundamentally alter the fact that a single low draw on any of the four remaining parameters puts us at or near a ‘low risk’ world. Furthermore, the probability of making a low draw increases in both of the grouped parameters, since anyone who had a low value for one and a high value for the other now has a low overall value as a mathematical consequence of multiplying probabilities.
4.3.4 Interpretation
The reason I selected these validity checks is because these three validity checks together imply:
The use of a survey isn’t the thing driving the results – there might be weaknesses with the survey, but the central insight that uncertainty analysis is neglected would survive a major weakness being discovered in the survey.
The use of the SDO method isn’t creating the results out of nothing – SDO only creates striking results when uncertainty around parameters is neglected
The specifics of the Carlsmith Model isn’t multiplying uncertainty unnecessarily – although there is certainly structural uncertainty analysis which should be performed (and I will try and perform it in a later essay), this relates more to the general concept of multiplying conditional probabilities together to arrive at an overall risk. If you merely want to tinker around with the specifics of the Carlsmith Model you will arrive at a very similar result to the base case.
These three points are the major pillars I expect objections to this essay are likely to attack. The reason I think this validity analysis is helpful is that even if one of these pillars collapses the general thrust of my conclusion remains. For example, I personally think the weakest element of the argument is the implicit premise that a survey of the AI Risk Community is the same thing as generating a reliable distribution of AI Risk probabilities. Let us suppose I am wrong about this and in fact the only reliable way to generate accurate beliefs around AI Risk is careful expert review of longform essays about claims, which I cannot do as I don’t have the social capital to get AI experts to produce such data. Nevertheless, I can be confident that my general conclusion would remain if I undertook this process; because the mechanism of SDO isn’t specific to any particular dataset (provided there is order-of-magnitude uncertainty on some parameters), I can be confident that those experts would have intuitions that would mislead them and the SDO process would produce this striking result.
5 - Analysis
5.1 Strengths and weaknesses of analysis
The purpose of this essay is to argue that uncertainty analysis has been systematically neglected by rationalist-adjacent communities with an interest in forecasting the future. Consider that prior to this essay, the gold standard analysis of systematic uncertainty in AI Risk prediction was from Carlsmith (2021) and looked like the below:
I don’t intend this as a slight on Carlsmith (2021) at all – the only reason this essay is even possible is because Carlsmith performed an incredible piece of work in making explicit structural claims about AI Risk. I think I have something to add on the topic of systematic investigation of uncertainty, but his non-systematic coverage of this topic is light-years ahead of anything I could have produced. Moreover, SDO’s insight is not at all obvious – people have been theorising about the Fermi Paradox for years before SDO ‘dissolved’ it, and nobody else hit on the idea that the solution might have been contained within the uncertainty analysis, rather than uncertainty analysis being something you grudgingly do prior to publication.
There are therefore some elements of the analysis I am quite proud of – in particular I think it sets a new benchmark for appropriate parameter uncertainty analysis in AI Risk spaces. I am really pleased to make a contribution in this area, however minor it is.
However, there are elements of the analysis which are not so good. The main weaknesses of the analysis are:
I am relying heavily on survey data being representative of the underlying reality of the world. That is, my headline result is actually that the AI-interested rationalists believe there is a 1.6% risk of catastrophe once you have correctly adjusted for asymmetric distributions of risk. To the extent you believe the ‘wisdom of crowds’ applies to AI forecasting this is not a problem, but to the extent you think that rationalists will systematically over- or under- estimate AI risk my results will be wrong to the same degree.
The SDO method is incredibly brittle to correlated parameters. If, for example, the probability that AI is invented is correlated with the probability that Alignment is easy (for example because whole-brain emulation turns out to be the best path to AGI and Alignment is easy when you’re literally simulating human values) then the SDO method doesn’t work – it can’t randomly sample from the Alignment question, because it needs to weight its sampling based on what it picked in the Invented question. I did some initial experiments into whether this was possible to fix by converting the synthetic point estimate to a synthetic distribution estimate, and my conclusion is that this objection isn’t fatal but it needs a better statistician than me to get it implemented.
A review of the literature uncovered only one structural model of AI Risk to inform usage of the SDO method. Structural sensitivity analysis is therefore very limited. For example, one significant structural assumption is that this model assumes only one AGI is ever invented. That is, I think everyone is implicitly always talking about the AGI that comes closest to causing a catastrophe for humans in every possible world when they are forecasting probabilities. However, if successfully containing one AGI doesn’t mean you’ve successfully contained the next AGI then the Carlsmith Model greatly misspecifies the AGI landscape. I will attempt to write a second (mercifully shorter) essay with a method to address this, but it is too much to include in one place so it is a limitation of the analysis here.
5.2 Implications of analysis
5.2.1 Implications for individuals
If my analysis is correct, then there is a high probability that we live in a world where the risk of AI Catastrophe due to out-of-control AGI is significantly lower than (most of) the AI Risk community initially believed. I don’t think my position is especially iconoclastic – “shut up and multiply” is a fairly common saying in rationalist-adjacent spaces for a reason – but I accept for some people it could trigger a re-evaluation of their existing beliefs. If we do live in such a world, does this imply a radical restructuring of anyone’s beliefs? I think probably not for individuals, for three reasons:
The most extreme analysis of my data you could imagine would still be within an order of magnitude of basically all community consensuses, including the Future Fund estimate. There are very many AI-related questions and forecasts over which we have significantly worse than order-of-magnitude accuracy, so this analysis should be understood as being wholly consistent with the existing AI paradigm (note that that is quite different to SDO’s application in the Fermi Paradox space, where their method totally blew all existing analysis out of the water). If you were comfortable with order-of-magnitude imprecision before you should be comfortable with it now, even though the central estimate has shifted within that order of magnitude.
In general, the probability of AI catastrophe due to out-of-control AGI is not as relevant as the expected value of preventing AI catastrophe through this route, for example expressed as the value of future QALYs not accrued because of that catastrophe. More specifically – since I am an economist – I’d suggest the most relevant framework for considering the problem is the cost-effectiveness of interventions designed to lower AI risk. On that framework it sort of doesn’t matter whether the risk of catastrophe is 1% or 10% or 100% - there’s a lot of stuff we could be doing cost-effectively at the moment that we are not, and we can perhaps worry about things on the 1% vs 10% margin when we’ve completely saturated the low-cost high-impact interventions with money.
This only considers one particular model of AI Risk – one where an out-of-control AI permanently disempowers humanity in a bad way. There are very many other scenarios in which AI could be bad for humanity, for example scenarios where one country uses an AI to wage a genocidal war against other countries. There are also scenarios where being overcautious regarding AI is bad for humanity, for example scenarios where AI research is deliberately slowed down because of concerns over risk and then a pandemic wipes out all life on earth because we didn’t have access to an AI to develop a cure. What I mean to say by this is that this essay is not (and is not intended to be) the final word on uncertainty analysis in AI Risk, so radically updating your belief should be conditional on more analyses like this being published to cover other AI Risk scenarios.
5.2.2 Implications for funding bodies
However, for organisations / fundholders this analysis might potentially prompt some thought about the best way to distribute resources. Some high-level implications of my analysis are:
Strategies for preventing AI Risk should start from the premise that there is a good chance we live in a low-risk world:
Instead of preparing for a middling-ish risk of AGI Catastrophe due to the risk of out-of-control AGI, we should be preparing (at least) two strategies for the possibility that we live in one of a high-risk or low-risk world, and plan accordingly. For example, in a high-risk world we might be prepared to trade away a lot of the potential economic advantages of AGI in order to prevent it disempowering humanity, whereas in a low-risk world we might treat AGI Risk like we currently treat natural pandemic risk (that is, mostly the honour system, followed by a massive commitment of resources if a pandemic breaks out).
To this end, we should be devoting significantly more resources to identifying whether we live in a high-risk or low-risk world. The ‘value of information’ here is potentially trillions of dollars of AGI resilience infrastructure we do not need to build.
Risk microdynamics are extremely understudied. For example:
It seems like there is a difference between Expert and Non-Expert predictions of overall AI Catastrophe which is driven almost entirely by different beliefs about how easy it will be to Contain an AI which is trying to disempower humanity. When funding outreach / explanations of AI Risk, it seems likely it would be more convincing to focus on why this step would be hard than to focus on e.g. the probability that AI will be invented this century (which mostly Non-Experts don’t disagree with). Are there more dynamics like this that could improve outreach?
It is clear some steps between AGI being invented and AGI catastrophe are more uncertain than others, and this is driving the broad distribution of results we see. If we were more certain about the most uncertain steps in the process then this would have a disproportionate impact on our certainty over what kind of world we live in, and therefore our response to the sort of future we were likely to experience. A good candidate for this sort of investigation is the probability that we can ‘Contain’ an AI attempting to disempower humanity. If we can do this with ~60% probability or better, it is very likely we live in a ‘safe’ world.
More generally, I’d imagine that the Carlsmith Model is also not the last word in structural analysis of possible AI futures. How different structural specifications of risk affect overall risk is not well understood in the AI space, and future commissioned research could (and probably should) seek to resolve this issue. This is by far the most important gap in understanding suggested by this essay, but also the one that looks most set to be quickly filled, thanks to the MTAIR project.
SDO’s method is not so complex that an intelligent layperson couldn’t have spotted the problem given access to the Survey Data I generated (my main contribution was knowing to look for a problem in exactly that spot in the first place) However, community norms in AGI spaces do not reward systematic investigation of uncertainty, and few people actually enjoy undertaking analysis of uncertainty just for the sheer thrill of it. It is really good that Carlsmith’s work is getting such a lot of praise, because it takes the AI Risk Community in a direction where major statistical issues like that described in this essay are more likely to be spotted early. Funders may want to consider accelerating this direction of travel, and commissioning many more systematic investigations of elements of uncertainty, using different elements of the uncertainty analysis toolkit. Funders might also want to reward / commission work that would form the building blocks of such analysis, such as Michael Aird’s database of existential risk.
6 - Conclusions
This essay makes an extremely striking claim; analysis of uncertainty reveals that the actual risk of AI Catastrophe due to out-of-control AGI is almost an order of magnitude less than most experts think it is. To the extent that I even dare make such a bold claim, it is because of the strong community norms to take weird results seriously, especially if they expose a failure mode in intuitive reasoning. At least part of the purpose of the essay is to make the case that we shouldn’t spend so much time focussing on single estimates of AI Catastrophe, and should instead consider distributions of results. To that end I would say that the main result I want to communicate is that it is more probable than not that we live in a world where the risk of AGI Catastrophe due to out-of-control AGI is <3%.
This is still an extremely striking claim, but one that is slightly more consistent with existing beliefs about AGI Risk – a large number of low-risk worlds are balanced out by a small number of high-risk worlds, such that when you take a simple average of risk you end up with a middling-ish number (perhaps around 15%), but when you consider the asymmetric distribution of high- and low-risk worlds you end up with a much lower number.
In this essay I propose a mechanism for why AI Risk analysts might have persisted with the belief that the distribution of uncertainty was symmetric. In my experience, people are not inherently comfortable reasoning about probabilities in their head – for example, people intuitively feel like if a chain of reasoning has a lot of high probabilities and a single low probability that the outcome must surely have at least a middling probability, when in fact the overall outcome will (on reflection) clearly be lower than the lowest probability in the chain of logic. People are also uncomfortable reasoning about uncertainty, especially when the distribution of uncertainty isn’t a nice symmetric normal or uniform distribution. When distribution of uncertainty is more or less symmetric is can be abstracted away for most purposes, but this mental habit gets people into trouble when the distribution is asymmetric. Given these two hypotheses, it stands to reason that people would be extremely uncomfortable reasoning about uncertain probabilities, which, unfortunately, is exactly what is required to make accurate forecasts of AI Risk.
SDO offer a powerful method for explicitly quantifying this uncertainty. To summarise, if you repeatedly sample from the space of all possible analyses of AI Risk then you will sometimes hit a low number for some parameters. The nature of the way conditional probabilities function is that this leads to disproportionately low (asymmetric) risk, which is surprising and unintuitive. An important argument in this essay is that the SDO method is not doing any ‘work’ – rather the method offers a way to think about uncertainty in parameter estimates to help us overcome our cognitive bias. It is rather nice that SDO are rationalist luminaries, but the method would be appropriate even if they had never commented on AI Risk.
I argue that for most individuals, not much will change as a result of this analysis. Almost nobody would have said their certainty over AI Risk scenarios was better than order-of-magnitude, so the finding in this essay that the risk of this kind of Catastrophe is actually towards the lower end of the order-of-magnitude we thought it was is probably not wholly transformative news. On the other hand, there may well be some actionable insight for funding bodies contained within this essay. I’d suggest the three most immediately actionable insights are:
We should be devoting significantly more resources to identifying whether we live in a high-risk or low-risk world. The ‘average risk’ (insofar as such a thing actually exists) is sort of academically interesting, but doesn’t help us design strategies to minimise the harm AI will actually do in this world.
We should be more concerned with systematic investigation of uncertainty when producing forecasts. In particular, the radical results contained in this essay only hold under quite specific structural assumptions. A considered and systematised approach to structural uncertainty would be a very high-value follow up to this essay about parameter uncertainty, but would need to be written by an expert in AI Risk to move beyond surface-level insight.
More generally, the analysis in this essay implies a reallocation of resources away from macro-level questions like, “When will AI be created?” and towards the microdynamics of AI Risk. For example, “What is the probability that the Alignment Problem turns out to be easy?” is the best early differentiator between low-risk and high-risk worlds, but it is a notably under-researched question (at least on a quantitative level).
Overall, ‘Dissolving AI Risk’ is a slightly incendiary title; AI Risk is still a live concern, and even a 1.6% chance of a terrible risk to humanity is too high for comfort. The title is an homage to Sandberg, Drexler and Ord, and their excellent 2018 paper on the Fermi Paradox. The reason for the homage is that this is really an essay about their insight, applied to a fairly straightforward survey dataset that happens – coincidentally—to be about AI Risk. Their insight is that for any application where you are multiplying conditional probabilities, and uncertainty over those probabilities spans at least one order-of-magnitude, you will end up with a significantly asymmetric distribution of underlying risks, favouring low-risk outcomes. This is not at all intuitive, but the extensive sensitivity and scenario analysis here is hopefully enough to make the case that the result is robust (even if I haven’t done a perfect job explaining the SDO mechanism). The overall goal of this essay is to demonstrate a practical example of the use of uncertainty analysis to create novel insight, and to the extent that I have succeeded at ‘dissolving’ AI Risk by an order of magnitude, I hope this essay accomplishes that.
- ^
If you clicked on this footnote because you didn’t totally understand why this would be the case, I will reassure you that there is a lot more explanation to follow in the main body of the essay.
To help orient you though, an analogy with sports teams might be helpful:
In a sports league there are multiple teams competing at games which can be modelled roughly as (weighted) coin tosses as to who wins. Losing one game doesn’t mean you lose the whole season, so in general the best team usually wins the League.
A sports elimination bracket is the same, except if your team loses a single game they are out of the whole tournament. This means that the best team does not always win an elimination bracket – they need to have a certain amount of luck to win every single game in a row.
So looking only at the best team’s probability of winning one specific game will systematically underrepresent their wins in a league-type format and systematically overrepresent their wins in an elimination-type format. You are much safer betting on the best team to win a league-type format than betting on the best team to win an elimination-type format, all other things being equal.
Most models of AI risk are – at an abstract enough level – more like an elimination tournament than a league, at least based on what has been published on various AI-adjacent forums. The AI needs everything to go its way in order to catastrophically depower humanity (although for sure it can make things very nasty for humans without catastrophically depowering them). Even if the AI is the ‘best team’ in the elimination tournament – which is a disturbingly apt metaphor now I think about it – simply because it is an elimination tournament the best player is disadvantaged compared to its probable performance in a single match
If this example confuses more than it enlightens, there is a much more comprehensive explanation to follow.
- ^
During this step I was made aware of the ‘Modeling Transformative AI Risk’ (MTAIR) project, which is a significantly more textured approach to modelling AI Risk, building on the work of Cottier and Shah (2019). This is effectively the next-generation of laying out the logical interrelationship between steps between now and a possible AI Catastrophe, building on the strong foundations of Carlsmith (2021). I am fairly confident that once published it will completely resolve my concerns about structural uncertainty analysis, which is why I make less of a fuss about structural uncertainty here than I did in my earlier essay about GiveWell’s model
- ^
I ended up having to exclude most of Aird’s database because the questions included in the database didn’t quite fit the decision problem the Future Fund were interested in. Nevertheless, Aird’s database deserves significantly more credit for this essay than it is about to get, because I used the estimates that he collated to parameterise a proof-of-concept model I then used to design everything else. In general, I suspect a significant cause of the issues I diagnose with uncertainty analysis in EA spaces are because there are few people like Aird doing hard and mostly thankless work to systematically bring together different perspectives on the same issue. This is a fertile area for high-impact funding, although slightly outside the scope of this essay.
- ^
By which I mean Astral Codex Ten, LessWrong and the Effective Altruism Forums. It was simply a blunder to miss the AI Alignment Forums – I misread my notes. I assumed there was enough cross-pollination between sources that this didn’t matter too much.
- ^
Ho ho
- ^
If anyone disagrees with my adjustment of their results in this way, I would be delighted to bet you $1 that you are wrong at one to a billion odds – please PM me!
- ^
The average here is the geometric mean of odds, although I convert it back into a probability to make it more comparable to the simple mean
A classic statistician drum to bang is that there is no such thing as ‘an average’ – there are just different measures of central tendency which are more or less appropriate for certain applications.
In this particular case, a simple mean would be quite misleading, because it implicitly proposes that a 99% and 99.99% probability express basically the same position (the simple mean of – say – 50%, 99% and 99.99% is not that different to the simple mean of – say – 50%, 99% and another 99%). Instead we use geometric mean of odds to ensure that 99.99% is correctly recorded as several orders of magnitude more certain than 99%.
See here for a really good discussion with further argument and justification
- ^
As an aside, for statisticians: I found method of moment was REALLY bad at generating plausible beta distributions from my real-world data, when previously it has worked pretty well for me and was working perfectly on toy data I was feeding it (eg the Modified Carlsmith numbers I described above). Is that likely to be because the data in this case spans multiple orders of magnitude / contains a lot of extreme values? Is there a better method other than grid searching over and over? If anyone has some insight on this problem I can think of a couple of interesting ways to extend my results—please PM me if you’ve ever worked on a problem like this
- ^
Obviously the correct ‘fair betting odds’ depend on the payoff matrix associated with a particular bet. If we set up a bet where you pay $1 and I pay out $X if you are right, then the simple mean is the fair odds for this payoff matrix. If we set up a bet where I pay you $1 for a prediction and you pay me an increasing amount of dollars depending on how overconfident / underconfident you were, then the Briar Score (or some other loss function like Log-Loss) gives you the fair betting odds, and this is found with the geometric mean of odds.Edit: Sorry, I have no idea what I mean to say here, please ignore itI think either simple mean or geometric mean of odds has a plausible defence for being used in this case, and I’d say I’ve got a weak supposition that geometric mean of odds should be the default. I note however that the Future Fund doesn’t want to get too hung up on what constitutes ‘fair betting odds’, so I haven’t either – this is an essay about distributions not about point estimates.
- “The Race to the End of Humanity” – Structural Uncertainty Analysis in AI Risk Models by (19 May 2023 12:03 UTC; 48 points)
- A Model-based Approach to AI Existential Risk by (LessWrong; 25 Aug 2023 10:32 UTC; 45 points)
- [Cross-post] Is the Fermi Paradox due to the Flaw of Averages? by (LessWrong; 18 Jan 2023 19:22 UTC; 42 points)
- EA & LW Forums Weekly Summary (17 − 23 Oct 22′) by (25 Oct 2022 2:57 UTC; 35 points)
- AI X-Risk: Integrating on the Shoulders of Giants by (1 Nov 2022 16:07 UTC; 34 points)
- 's comment on Announcing the Winners of the 2023 Open Philanthropy AI Worldviews Contest by (30 Sep 2023 20:30 UTC; 28 points)
- Decision Engine For Modelling AI in Society by (7 Aug 2025 11:15 UTC; 24 points)
- October 2022 AI Risk Community Survey Results by (24 May 2023 10:37 UTC; 19 points)
- How should we think about the decision relevance of models estimating p(doom)? by (LessWrong; 11 May 2023 4:16 UTC; 12 points)
- 's comment on Microdooms averted by working on AI Safety by (21 Sep 2023 3:29 UTC; 10 points)
- EA & LW Forums Weekly Summary (17 − 23 Oct 22′) by (LessWrong; 25 Oct 2022 2:57 UTC; 10 points)
- 's comment on Mo Putera’s Quick takes by (14 Mar 2024 3:55 UTC; 4 points)
- 's comment on Announcing the Winners of the 2023 Open Philanthropy AI Worldviews Contest by (30 Sep 2023 20:20 UTC; 4 points)
- 's comment on What are the most underrated posts & comments of 2022, according to you? by (3 Jan 2023 5:35 UTC; 2 points)
The main assumption of this post seems to be that, not only are the true values of the parameters independent, but a given person’s estimates of stages are independent. This is a judgment call I’m weakly against.
Suppose you put equal weight on the opinions of Aida and Bjorn. Aida gives 10% for each of the 6 stages, and Bjorn gives 99%, so that Aida has an overall x-risk probability of 10^-6 and Bjorn has around 94%.
If you just take the arithmetic mean between their overall estimates, it’s like saying “we might be in worlds where Aida is correct, or worlds where Bjorn is correct”
But if you take the geometric mean or decompose into stages, as in this post, it’s like saying “we’re probably in a world where each of the bits of evidence Aida and Bjorn have towards each proposition are independently 50% likely to be valid, so Aida and Bjorn are each more correct about 2-4 stages”.
These give you vastly different results, 47% vs 0.4%. Which one is right? I think there are two related arguments to be made against the geometric mean, although they don’t push me all the way towards using the arithmetic mean:
Aida and Bjorn’s wildly divergent estimates on probably come from some underlying difference in their models of the world, not as independent draws. In this case where Aida is more optimistic about Bjorn on each of the 6 stages, it is unlikely that this is due to independent draws. I think this kind of multidimensional difference in optimism between alignment researchers is actually happening, so any model should take this into account.
If we learn that Bjorn was wrong about stage 1, then we should put less weight on his estimates for stages 2-6. (My guess is there’s some copula that corresponds to a theoretically sensible way to update away from Bjorn’s position treating his opinions as partially correlated, but I don’t know enough statistics)
This is unquestionably the strongest argument against the SDO method as it applies to AI Risk, and therefore the biggest limitation of the essay. There is really good chance that many of the parameters in the Carlsmith Model are correlated in real life (since basically everything is correlated with everything else by some mechanism), so the important question is whether they are independent enough that what I’ve got here is still plausible. I offer some thoughts on the issue in Section 5.1.
To the best of my knowledge, there is no work making a very strong theoretical claim that any particular element of the Carlsmith Model will be strongly correlated with any other element. I have seen people suggest mechanisms with the implicit claim that if AI is more revolutionary than we expect then there will be correlation between our incentive to deploy it, our desire to expose it to high-impact inputs and our inability to stop it once it tries to disempower us—but I’m pretty confident the validity check in Section 4.3.3 demonstrates that correlation between some parameters doesn’t fundamentally alter conclusions about distributions, although would alter the exact point estimates which were reached.
Practically, I don’t think there is strong evidence that people’s parameters are correlated across estimates to a degree that will significantly alter results. Below is the correlation matrix for the Full Survey estimates with p<0.05 highlighted in green. Obviously I’m once again leaning on the argument that a survey of AI Risk is the same thing as the actual AI Risk, which I think is another weakness of the essay.
This doesn’t spark any major concerns for me—there is more correlation than would be expected by chance, but it seems to be mostly contained within the ‘Alignment turns out to be easy’ step, and as discussed above the mechanism still functions if one or two steps are removed because they are indistinguishable from preceding steps. The fact that there is more positive than negative correlation step is some evidence of the ‘general factor of optimism’ which you describe (because the ‘optimistic’ view is that we won’t deploy AI until we know it is safe, so we’d expect negative correlation on this factor in the table). Overall I think my assumption of independence is reasonable in the sense that the results are likely to be robust to the sorts of correlations I have empirically observed and theoretically seen accounted for, however I do agree with you that if there is a critical flaw in the essay it is likely to be found here.
I don’t quite follow your logic where you conclude that if estimates are correlated then simple mean is preferred—my exploration of the problem suggests that if estimates are correlated to a degree significant enough to affect my overall conclusion then you stop being able to use conventional statistics at all and have to do something fancy like microsimulation. Anecdata—in the specific example you give my intuition is that 0.4% really is a better summary of our knowledge, since otherwise we round off Aida’s position to ‘approximately 1%’ which is several orders of magnitude incorrect. Although as I say above, in the situation you describe above both summary estimates are misleading in different ways and we should look at the distribution—which is the key point I was trying to make in the essay.
Thanks. It looks reassuring that the correlations aren’t as large as I thought. (How much variance is in the first principal component in log odds space though?) And yes, I now think the arguments I had weren’t so much for arithmetic mean as against total independence / geometric mean, so I’ll edit my comment to reflect that.
If the estimates for the different components were independent, then wouldn’t the distribution of synthetic estimates be the same as the distribution of individual people’s estimates?
Multiplying Alice’s p1 x Bob’s p2 x Carol’s p3 x … would draw from the same distribution as multiplying Alice’s p1 x Alice’s p2 x Alice’s p3 … , if estimates to the different questions are unrelated.
So you could see how much non-independence affects the bottom-line results just by comparing the synthetic distribution with the distribution of individual estimates (treating each individual as one data point and multiplying their 6 component probabilities together to get their p(existential catastrophe)).
Insofar as the 6 components are not independent, the question of whether to use synthetic estimates or just look at the distribution of individuals’ estimates comes down to 1) how much value is there in increasing the effective sample size by using synthetic estimates and 2) is the non-independence that exists something that you want to erase by scrambling together different people’s component estimates (because it mainly reflects reasoning errors) or is it something that you want to maintain by looking at individual estimates (because it reflects the structure of the situation).
In practice these numbers wouldn’t perfectly match even if there was no correlation because there is some missing survey data that the SDO method ignores (because naturally you can’t sample data that doesn’t exist). In principle I don’t see why we shouldn’t use this as a good rule-of-thumb check for unacceptable correlation.
The synth distribution gives a geomean of 1.6%, a simple mean of around 9.6%, as per the essay
The distribution of all survey responses multiplied together (as per Alice p1 x Alice p2 x Alice p3) gives a geomean of approx 2.3% and a simple mean of approx 17.3%.
I’d suggest that this implies the SDO method’s weakness to correlated results is potentially depressing the actual result by about 50%, give or take. I don’t think that’s either obviously small enough not to matter or obviously large enough to invalidate the whole approach, although my instinct is that when talking about order-of-magnitude uncertainty, 50% point error would not be a showstopper.
Jaime Seville (who usually argues in favor of using geometric mean of odds over arithmetic mean of probabilities) makes a similar point here:
Strong endorsement for pushing against unjustified independence assumptions.
I’m having a harder time thinking about how it applies to AI specifically, but I think it’s a common problem in general—e.g. in forecasting.
It sounds like the headline claim is that (A) we are 33.2% to live in a world where the risk of loss-of-control catastrophe is <1%, and 7.6% to live in a world where the risk is >35%, and a whole distribution of values between, and (B) that it follows from A that the correct subjective probability of loss-of-control catastrophe is given by the geometric mean of the risk, over possible worlds.
I want to argue that the geometric mean is not an appropriate way of aggregating probabilities across different “worlds we might live in” into a subjective probability (as requested by the prize). This argument doesn’t touch on the essay’s main argument in favor of considering distributions, but may move the headline subjective probability that it suggests to 9.65%, effectively outside the range of opinion-change prizes, so I thought it worth clarifying in case I misunderstand.
Consider an experiment where you flip a fair coin A. If A is heads you flip a 99%heads coin B; if A is tails you flip a 1%heads coin B. We’re interested in forming a subjective probability that B is heads.
The answer I find intuitive for p(B=heads) is 50%, which is achieved by taking the arithmetic average over worlds. The geometric average over worlds gives 9.9% instead, which doesn’t seem like “fair betting odds” for B being heads under any natural interpretation of those words. What’s worse, the geometric-mean methodology suggests a 9.9% subjective probability of tails, and then p(H)+p(T) does not add to 1.
(If you’re willing to accept probabilities that are 0 and 1, then an even starker experiment is given by a 1% chance to end up in a world with 0% risk and a 99% chance to end up in a world with 100% risk—the geometric mean is 0.)
Footnote 9 of the post suggests that the operative meaning of “fair betting odds” is sufficiently undefined by the prize announcement that perhaps it refers to a Brier-score bet, but I believe that it is clear from the prize announcement that a 1−vs−X bet is the kind under consideration. The prize announcement’s footnote 1 says “We will pose many of these beliefs in terms of <u>subjective probabilities, which represent betting odds</u> that we consider fair in the sense that we’d be roughly indifferent between betting in favor of the relevant propositions <u>at those odds</u> or betting against them.”
I don’t know of a natural meaning of “bet in favor of P at 97:3 odds” other than “bet to win $97N if P and lose $3N if not P”, which the bettor should be indifferent about if . Is there some other bet that you believe “bet in favor of P at odds of X:Y” could mean? In particular, is there a meaning which would support forming odds (and subjective probability) according to a geometric mean over worlds?
(I work at the FTX Foundation, but have no connection to the prizes or their judging, and my question-asking here is as a EA Forum user, not in any capacity connected to the prizes.)
Hmm I accidentally deleted a comment earlier, but roughly:
I think there’s decent theoretical and empirical arguments for having a prior where you should be using geometric mean of odds over arithmetic mean of probabilities when aggregating forecasts. Jaime has a primer here. However there was some pushback in the comments, especially by Toby Ord. My general takeaway is that geometric mean of odds is a good default when aggregating forecasts by epistemic peers but there are a number of exceptions where some other aggregation schema is better.
Arguably Froolow’s data (which is essentially a glorified survey of rationalists) is closer to a situation where we want to aggregate forecasts than a situation where we have “objective” probabilities over probabilities (as in your coin example).
So I can see why they used geometric mean as a default, though I think they vastly exaggerated the confidence that we should have in that being the correct modeling decision.
I also don’t quite understand why they used geometric mean of probabilities rather than geometric mean of odds.
This comment is exactly right, although it seems I came across stronger on the point about geometric mean of odds than I intended to. I wanted to say basically exactly what you did in this comment—there are relatively sound reasons to treat geometric mean of odds as the default in this case, but that there was a reasonable argument for simple means too. For example see footnotes 7 and 9 where I make this point. What I wanted to get across was that the argument about simple means vs geometric mean of odds was likely not the most productive argument to be having—point estimates always (necessarily) summarise the underlying distribution of data, and it is dangerous to merely use summary statistics when the distribution itself contains interesting and actionable information
Just for clarity—I use geometric mean of odds, which I then convert back into probability as an additional step (because people are more familiar with probability than odds). If I said anywhere that I took the geometric mean of probabilities then this is a typo and I will correct it!
I agree about this in general but I’m skeptical about treating distributions of probabilities the same way we treat distributions of quantities.
Perhaps more importantly, I assumed that the FTX FF got their numbers for reasons other than deferring to the forecasts of random rationalists. If I’m correct, this leads me to think that sophisticated statistics on top of the forecasts of random rationalists is unlikely to change their minds.
Thanks! This is my fault for commenting before checking the math first! However, I think you could’ve emphasized what you actually did more. You did not say “geometric mean of probabilities.” But you also did not say “geometric mean of odds” anywhere except in footnote 7 and this comment. In the main text, you only said “geometric mean” and the word “probability” was frequently in surrounding texts.
I think that’s a fair criticism. For all I know, the FF are not at all uncertain about their estimates (or at least not uncertain over order-of-magnitude) and so the SDO mechanism doesn’t come into play. I still think there is value in explicitly and systematically considering uncertainty, even if you end up concluding it doesn’t really matter for your specific beliefs -if only because you can’t be totally confident it doesn’t matter until you have actually done the maths.
I’ve updated the text to replace ‘geometric mean’ with ‘geometric mean of odds’ everywhere it occurs. Thanks so much for the close reading and spotting the error.
Thanks! Though it’s not so much an error as just moderately confusing communication.
As you probably already know, I think one advantage of geometric mean of odds over probabilities is that it directly addresses one of Ross’s objections:
Geomean of odds of 99% heads and 1% heads is
sqrt(99∗1):sqrt(1∗99)=1:1=50
More generally, geomean of X:Y and Y:X is 50%, and geomean of odds is equally sensitive to outlier probabilities in both directions (whereas geomean of probabilities is only sensitive to outlierly low probabilities).
I agree that geomean-of-odds performs better than geomean-of-probs!
I still think it has issues for converting your beliefs to actions, but I collected that discussion under a cousin comment here: https://forum.effectivealtruism.org/posts/Z7r83zrSXcis6ymKo/dissolving-ai-risk-parameter-uncertainty-in-ai-future?commentId=9LxG3WDa4QkLhT36r
I think there are good reasons for preferring geometric mean of odds to simple mean when presenting data of this type, but not good enough that I’d take to the barricades over them. Linch (below) links to the same post I do in giving my reasons to believe this. Overall, however, this is an essay about distributions rather than point estimates so if your main objection is to the summary statistic I used then I think we agree on the material points, but have a disagreement about how the work should be presented.
On the point about betting odds, I note that the contest announcement also states “Applicants need not agree with or use our same conception of probability”. I think the way in which I actually disagree with the Future Fund is more radical than simple means vs geometric mean of odds—I think they ought to stop putting so much emphasis on summary statistics altogether.
Thanks for clarifying “geomean of probabilities” versus “geomean of odds elsethread. I agree that that resolves some (but not all) of my concerns with geomeaning.
I agree with your pro-distribution position here, but I think you will be pleasantly surprised by how much reasoning over distributions goes into cost-benefit estimates at the Future Fund. This claim is based on nonpublic information, though, as those estimates have not yet been put up for public discussion. I will suggest, though, that it’s not an accident that Leopold Aschenbrenner is talking with QURI about improvements to Squiggle: https://github.com/quantified-uncertainty/squiggle/discussions
So my subjective take is that if the true issue is “you should reason over distributions of core parameters”, then in fact there’s little disagreement between you and the FF judges (which is good!), but it all adds up to normality (which is bad for the claim “moving to reasoning over distributions should move your subjective probabilities”).
If we’re focusing on the Worldview Prize question as posed (“should these probability estimates change?”), then I think the geo-vs-arith difference is totally cruxy—note that the arithmetic summary of your results (9.65%) is in line with the product of the baseline subjective probabilities for the prize (something like a 3% for loss-of-control x-risk before 2043; something like 9% before 2100).
I do think it’s reasonable to critique the fact that those point probabilities are presented without any indication that the path of reasoning goes through reasoning over distributions, though. So I personally am happy with this post calling attention to distributional reasoning, since it’s unclear in this case whether that is an update. I just don’t expect it to win the prizes for changing estimates.
Because I do think distributional reasoning is important, though, I do want to zoom in on the arith-vs-geo question (which I think, on reflection, is subtler than the position I took in my top-level comment). Rather than being a minor detail, I think this is important because it influences whether greater uncertainty tends to raise or lower our “fair betting odds” (which, at the end of the day, are the numbers that matter for how the FF decides to spend money).
I agree with Jamie and you and Linch that when pooling forecasts, it’s reasonable (maybe optimal? maybe not?) to use geomeans. So if you’re pooling expert forecasts of {1:1000, 1:100, 1:10}, you might have a subjective belief of something like “1:100, but with a ‘standard deviation’ of 6.5x to either side”. This is lower than the arithmean-pooled summary stats, and I think that’s directionally right.
I think this is an importantly different question from “how should you act when your subjective belief is a distribution like that. I think that if you have a subjective belief like “1%, but with a ‘standard deviation’ of 6.5x to either side”, you should push a button that gives you $98.8 if you’re right and loses $1.2 if you’re wrong. In particular, I think you should take the arithmean over your subjective distribution of beliefs (here, ~1.4%) and take bets that are good relative to that number. This will lead to decision-relevant effective probabilities that are higher than geomean-pooled point estimates (for small probabilities).
If you’re combining multiple case parameters multiplicatively, then the arith>geo effect compounds as you introduce uncertainty in more places—if the quantity of interest is x*y, where x and y each had expert estimates of {1:1000, 1:100, 1:10} that we assume independent, then arithmean(x*y) is about twice geomean(x*y). Here’s a quick Squiggle showing what I mean: https://www.squiggle-language.com/playground/#code=eNqrVirOyC8PLs3NTSyqVLIqKSpN1QELuaZkluQXwUQy8zJLMhNzggtLM9PTc1KDS4oy89KVrJQqFGwVcvLT8%2FKLchNzNIAsDQM9A0NNHQ0jfWPNOAM9U82YvJi8SqJUVQFVVShoKVQCsaGBQUyeUi0A3tIyEg%3D%3D
For this use-case (eg, “what bets should we make with our money”), I’d argue that you need to use a point estimate to decide what bets to make, and that you should make that point estimate by (1) geomean-pooling raw estimates of parameters, (2) reasoning over distributions of all parameters, then (3) taking arithmean of the resulting distribution-over-probabilities and (4) acting according to that mean probability.
In the case of the Worldview Prize, my interpretation is that the prize is described and judged in terms of (3), because that is the most directly valuable thing in terms of producing better (4)s.
An explicit case where I think it’s important to arithmean over your subjective distribution of beliefs:
coin A is fair
coin B is either 2% heads or 98% heads, you don’t know
you lose if either comes up tails.
So your p(win) is “either 1% or 49%”.
I claim the FF should push the button that pays us $80 if win, -$20 if lose, and in general make action decisions consistent with a point estimate of 25%. (I’m ignoring here the opportunity to seek value of information, which could be significant!).
It’s important not to use geomean-of-odds to produce your actions in this scenario; that gives you ~9.85%, and would imply you should avoid the +$80;-$20 button, which I claim is the wrong choice.
I agree that the arith-vs-geo question is basically the crux when it comes to whether this essay should move FF’s ‘fair betting probabilities’ - it sounds like everyone is pretty happy with the point about distributions and I’m really pleased about that because it was the main point I was trying to get across. I’m even more pleased that there is background work going on in the analysis of uncertainty space, because that’s an area where public statements by AI Risk organisations have sometimes lagged behind the state of the art in other risk management applications.
With respect to the crux, I hate to say it—because I’d love to be able to make as robust a claim for the prize as possible—but I’m not sure there is a principled reason for using geomean over arithmean for this application (or vice versa). The way I view it, they are both just snapshots of what is ‘really’ going on, which is the full distribution of possible outcomes given in the graphs / model. By analogy, I would be very suspicious of someone who always argued the arithmean would be a better estimate of central tendency than the median for every dataset / use case! I agree with you the problem of which is best for this particular dataset / use case is subtle, and I think I would characterise it as being a question of whether my manipulations of people’s forecasts have retained some essential ‘forecast-y’ characteristic which means geomean is more appropriate for various features it has, or whether they have been processed into having some sort of ‘outcome-y’ characteristic in which case arithmean is more appropriate. I take your point below in the coin example and the obvious superiority of arithmeans for that application, but my interpretation is that the FF didn’t intend for the ‘fair betting odds’ position to limit discussion about alternate ways to think about probabilities (“Applicants need not agree with or use our same conception of probability”)
However, to be absolutely clear, even if geomean was the right measure of central tendency I wouldn’t expect the judges to pay that particular attention—if all I had done was find a novel way of averaging results then my argument would basically be mathematical sophistry, perhaps only one step better than simply redefining ‘AI Risk’ until I got a result I liked. I think the distribution point is the actually valuable part of the essay, and I’m quite explicit in the essay that neither geomean nor arithmean is a good substitute for the full distribution. While I would obviously be delighted if I could also convince you my weak preference for geomean as a summary statistic was actually robust and considered, I’m actually not especially wedded to the argument for one summary statistic over the other. I did realise after I got my results that the crux for moving probabilities was going to be a very dry debate about different measures of central tendency, but I figured since the Fund was interested in essays on the theme of “a bunch of this AI stuff is basically right, but we should be focusing on entirely different aspects of the problem” (even if they aren’t being strictly solicited for the prize) the distribution bit of the essay might find a readership there anyway.
By the way, I know your four-step argument is intended just as a sketch of why you prefer arithmean for this application, but I do want to just flag up that I think it goes wrong on step 4, because acting according to arithmean probability (or geomean, for that matter) throws away information about distributions. As I mention here and elsewhere, I think the distribution issue is far more important than the geo-vs-arith issue, so while I don’t really feel strongly if I lose the prize because the judges don’t share my intuition that geomean is a slightly better measure of central tendency I would be sad to miss out because the distribution point was misunderstood! I describe in Section 5.2.2 how the distribution implied by my model would quite radically change some funding decisions, probably by more than an argument taking the arithmean to 3% (of course, if you’re already working on distribution issues then you’ve probably already reached those conclusions and so I won’t be changing your mind by making them—but in terms of publicly available arguments about AI Risk I’d defend the case that the distribution issue implies more radical redistribution of funds than changing the arithmean to 1.6%). So I think “act according to that mean probability” is wrong for many important decisions you might want to take—analogous to buying a lot of trousers with 1.97 legs in my example in the essay. No additional comment if that is what you meant though and were just using shorthand for that position.
Clarifying, I do agree that there are some situations where you need something other than a subjective p(risk) to compare EV(value|action A) with EV(value|action B). I don’t actually know how to construct a clear analogy from the 1.97-legged trousers example if the variable we’re meaning is probabilities (though I agree that there are non-analogous examples; VOI for example).
I’ll go further, though, and claim that what really matters is what worlds the risk is distributed over, and that expanding the point-estimate probability to a distribution of probabilities, by itself, doesn’t add any real value. If it is to be a valuable exercise, you have to be careful what you’re expanding and what you’re refusing to expand.
More concretely, you want to be expanding over things your intervention won’t control, and then asking about your intervention’s effect at each point in things-you-won’t-control-space, then integrating back together. If you expand over any axis of uncertainty, then not only is there a multiplicity of valid expansions, but the natural interpretation will be misleading.
For example, say we have a 10% chance of drawing a dangerous ball from a series of urns, and 90% chance of drawing a safe one. If we describe it as (1) “50% chance of 9.9% risk, 50% chance of 10.1% risk” or (2) “50% chance of 19% risk, 50% chance of 1% risk” or (3) “10% chance of 99.1% risk, 90% chance of 0.1% risk”, what does it change our opinion of <intervention A>? (You can, of course, construct a two-step ball-drawing procedure that produces any of these distributions-over-probabilities.)
I think the natural intuition is that interventions are best in (2), because most probabilities of risk are middle-ish, and worst in (3), because probability of risk is near-determined. And this, I think, is analogous to the argument of the post that anti-AI-risk interventions are less valuable than the point-estimate probability would indicate.
But that argument assumes (and requires) that our interventions can only chance the second ball-drawing step, and not the first. So using that argument requires that, in the first place, we sliced the distribution up over things we couldn’t control. (If that is the thing we can control with our intervention, then interventions are best in the world of (3).)
Back to the argument of the original post: You’re deriving a distribution over several p(X|Y) parameters from expert surveys, and so the bottom-line distribution over total probabilities reflects the uncertainty in experts’ opinions on those conditional probabilities. Is it right to model our potential interventions as influencing the resolution of particular p(X|Y) rolls, or as influencing the distribution of p(X|Y) at a particular stage?
I claim it’s possible to argue either side.
Maybe a question like “p(much harder to build aligned than misaligned AGI | strong incentives to build AGI systems)” (the second survey question) is split between a quarter of the experts saying ~0% and three-quarters of the experts saying ~100%. (This extremizes the example, to sharpen the hypothetical analysis.) We interpret this as saying there’s a one-quarter chance we’re ~perfectly safe and a three-quarters chance that it’s hopeless to develop and aligned AGI instead of a misaligned one.
If we interpret that as if God will roll a die and put us in the “much harder” world with three-quarters probability and the “not much harder” world with one-quarters probability, then maybe our work to increase the we get an aligned AGI is low-value, because it’s unlikely to move either the ~0% or ~100% much lower (and we can’t change the die). If this was the only stage, then maybe all of working on AGI risk is worthless.
But “three-quarter chance it’s hopeless” is also consistent with a scenario where there’s a three-quarters chance that AGI development will be available to anyone, and many low-resourced actors will not have alignment teams and find it ~impossible to develop with alignment, but a one-quarter chance that AGI development will be available only to well-resourced actors, who will find it trivial to add on an alignment team and develop alignment. But then working on AGI risk might not be worthless, since we can work on increasing the chance that AGI development is only available to actors with alignment teams.
I claim that it isn’t clear, from the survey results, whether the distribution of experts’ probabilities for each step reflect something more like the God-rolls-a-die model, or different opinions about the default path of a thing we can intervene on. And if that’s not clear, then it’s not clear what to do with the distribution-over-probabilities from the main results. Probably they’re a step forward in our collective understanding, but I don’t think you can conclude from the high chances of low risk that there’s a low value to working on risk mitigation.
Models such as the Carlsmith one, which treat AI x-risk as highly conjunctive (i.e. lots of things need to happen for an AI existential catastrophe), already seem like they’ll bias results towards lower probabilities (see e.g. this section of Nate’s review of the Carlsmith report). I won’t say more on this since I think it’s been discussed several times already.
What I do want to highlight is that the methodology of this post exacerbates that effect. In principle, you can get reasonable results with such a model if you’re aware of the dangers of highly conjunctive models, and sufficiently careful in assigning probabilities.[1] This might at least plausibly be the case for a single person giving probabilities, who has hopefully thought about how to avoid the multiple stage fallacy, and spent a lot of time thinking about their probability estimates. But if you just survey a lot of people, you’ll very likely get at least a sizable fraction of responses who e.g. just tend to assign probabilities close to 50% because anything else feels overconfident, or who don’t actually condition enough on previous steps having happened, even if the question tells them to. (This isn’t really meant to critique people who answered the survey—it’s genuinely hard to give good probabilities for these conjunctive models). The way the analysis in this post works, if some people give probabilities that are too low, the overall result will also be very low (see e.g. this comment).
I would strongly guess that if you ran exactly the same type of survey and analysis with a highly disjunctive model (e.g. more along the lines of this one by Nate Soares), you would get way higher probabilities of X-risk. To be clear, that would be just as bad, it would likely be an overestimate!
One related aspect I want to address:
There is a lot of disagreement about whether AI risk is conjunctive or disjunctive (or, more realistically, where it is on the spectrum between the two). If I understand you correctly (in section 3.1), you basically found only one model (Carlsmith) that matched your requirements, which happened to be conjunctive. I’m not sure if that’s just randomness, or if there’s a systematic effect where people with more disjunctive models don’t tend to write down arguments in the style “here’s my model, I’ll assign probabilities and then multiply them”.
If we do want to use a methodology like the one in this post, I think we’d need to take uncertainty over the model itself extremely seriously. E.g. we could come up with a bunch of different models, assign weights to them somehow (e.g. survey people about how good a model of AI x-risk this is), and then do the type of analysis you do here for each model separately. At the end, we average over the probabilities each model gives using our weights. I’m still not a big fan of that approach, but at least it would take into account the fact that there’s a lot of disagreement about the conjunctive vs disjunctive character of AI risk. It would also “average out” the biases that each type of model induces to some extent.
Though there’s still the issue of disjunctive pathways being completely ignored, and I also think it’s pretty hard to be sufficiently careful.
My apologies if I wasn’t clear enough in the essay—I think there is a very good case for investigating structural uncertainty, it is just that it would require another essay-length treatment to do a decent job with. I hope to be able to produce such a treatment before the contest deadline (and I’ll publish afterwards anyway if this isn’t possible). This essay implicitly treats the model structure as fixed (except for a tiny nod to the issue in 4.3.3) and parameter uncertainty as the only point of contention, but in reality both the model structural uncertainty and parameter uncertainty will contribute to the overall uncertainty.
Yeah, I totally agree that combining such a detailed analysis as you are doing with structural uncertainty would be a really big task. My point certainly wasn’t that you hadn’t done “enough work”, this is already a long and impressive write-up.
I will say though that if you agree that model uncertainty would likely lead to substantially higher x-risk estimates, the takeaways in this post are very misleading. E.g.:
“The headline figure from this essay is that I calculate the best estimate of the risk of catastrophe due to out-of-control AGI is approximately 1.6%.”
“analysis of uncertainty reveals that the actual risk of AI Catastrophe is almost an order of magnitude less than most experts think it is”
“the main result I want to communicate is that it is more probable than not that we live in a world where the risk of AGI Catastrophe is <3%.”
I disagree with each of those claims, and I don’t think this post makes a strong enough case to justify them. Maybe the crux is this:
My main point was not that structural uncertainty will increase our overall uncertainty, it was that specifically using a highly conjunctive model will give very biased results compared to considering a broader distribution over models. Not sure based on your reply if you agree with that (if not, then the takeaways make more sense, but in that case we do have a substantial disagreement).
I’m not sure we actually disagree about the fact on the ground, but I don’t fully agree with the specifics of what you’re saying (if that makes sense). In a general sense I agree the risk of ‘AI is invented and then something bad happens because of that’ is substantially higher than 1.6%. In the specific scenario the Future Fund are interested in for the contest however, I think the scenario is too narrow to say with confidence what would happen on examination of structural uncertainty. I could think of ways in which a more disjunctive structural model could even plausibly diminish the risk of the specific Future Fund catastrophe scenario—for example in models where some of the microdynamics make it easier to misuse AI deliberately. That wouldn’t necessarily change the overall risk of some AI Catastrophe befalling us, but it would be a relevant distinction to make with respect to the Future Fund question which asks about a specific kind of Catastrophe.
Also you’re right the second and third quotes you give are too strong—it should read something like ‘...the actual risk of AI Catastrophe of this particular kind...’ - you’re right that this essay says nothing about AI Catastrophe broadly defined, just the specific kind of catastrophe the Future Fund are interested in. I’ll change that, as it is undesirable imprecision.
Ok, thanks for clarifying! FWIW, everything I said was meant to be specifically about AGI takeover because of misalignment (i.e. excluding misuse), so it does seem we disagree significantly about the probability of that scenario (and about the effect of using less conjunctive models). But probably doesn’t make sense to get into that discussion too much since my actual cruxes are mostly on the object level (i.e. to convince me of low AI x-risk, I’d find specific arguments about what’s going to happen and why much more persuasive than survey-based models).
The above comment is irrational and poorly formed. It shows a lack of understanding of basic probability theory, and it conflates different types of risks. Specifically, the comment conflates the risks of artificial general intelligence (AGI) takeover with the risks of misuse of AGI. These are two very different types of risks, and they should not be conflated. AGI takeover risks are risks arising from the fact that AGI may be misaligned with human values. That is, AGI may be designed in such a way that it does not act in ways that are beneficial to humanity. This is a risk because AGI could potentially cause great harm to humanity if it is not properly controlled. Misuse risks, on the other hand, are risks arising from the fact that AGI may be used in ways that are harmful to humanity. This is a risk because AGI could be used to create powerful weapons or to manipulate people in harmful ways. The comment suggests that the probability of AGI takeover is low because it is based on survey-based models. However, this is not a valid way to calculate probabilities. Probabilities should be based on evidence.
Agreed, I think this post provides a great insight that hasn’t been pointed out before, but it works best for the Carlsmith model which is unusually conjunctive. Arguments for disjunctive AI risk include Nate Soares here and Kokotajlo and Dai here.
Both of the links you suggest are strong philosophical arguments for ‘disjunctive’ risk, but are not actually model schema (although Soares does imply he has such a schema and just hasn’t published it yet). The fact that I only use Carlsmith to model risk is a fair reflection of the state of the literature.
(As an aside, this seems really weird to me—there is almost no community pressure to have people explicitly draw out their model schema in powerpoint or on a piece of paper or something. This seems like a fundamental first step in communicating about AI Risk, but only Carlsmith has really done it to an actionable level. Am I missing something here? Are community norms in AI Risk very different to community norms in health economics, which is where I usually do my modelling?)
Agreed on that as well. The Carlsmith report is the only quantitative model of AI risk I’m aware of and it was the right call to do this analysis on it. I think we do have reasonably large error bars on its parameters (though perhaps smaller than an order of magnitude) meaning your insight is important.
Why aren’t there more models? My guess is that it’s just very difficult, with lots of overlapping and entangled scenarios that are hard to tease apart. How would you go about constructing an overall x-risk from the list of disjunctive risks? You can’t assume they’re independent events, and generating conditional probabilities for each seems challenging and not necessarily helpful.
Ajeya Cotra’s BioAnchors report is another quantitative model of that drives lots of beliefs on AI timelines. Stephanie Lin won the EA Critique Contest with one critique, but I’d be curious if you’d have other concerns with it.
I think there are problems with this approach.
(Epistemic status: I have only read parts of the article and skimmed other parts.)
The fundamental thing I am confused about is that the article seems to frequently use probabilities of probabilities (without collapsing these probabilities). In my worldview, probabilities of probabilites are not a meaningful concept, because they immediately collapse. Let me explain what I mean by that:
If you assign 40% probability to the statement “there is a 70% probability that Biden will be reelected” and 60% probability to the statment “there is a 45% probability that Biden will be reelected”, then you have a 55% probability that Biden will be reelected (because 0.40.7 + 0.60.45 = 0.55). Probabilities of probabilities can be intermediate steps, but they collapse into single probabilities.
There is one case where this issue directly influences the headline result of 1.6%. You report intermediate results such as “There is a 13.04% chance we live in a world with low risk from 3% to 7%” (irrellevant side remark: In the context of xrisk, I would consider 5% as very high, not low), or “There is 7.6% chance that the we live in a world with >35% probability of extinction”. The latter alone should set a lower bound of 2.66% (0.076 * 0.35 = 0.0266) for the probability of extinction! Taking the geometric mean in this instance seems wrong to me, and the mathematically correct thing would be to take the mean for aggregating the probabilities.
I have not read the SDO paper in detail, but I have doubts that the SDO method applies to the present scenario/model of xrisk. You quote Scott Alexander:
I note that this quote fits perfectly fine for analysing the supposed Fermi Paradox, but it fits badly whenever you have uncertainty over probabilities. If gods flips a coin whether we have 3% or 33% probability of extinction, the result is 18%, and taking the mean is perfectly fine.
I would like to ask the author:
What are your probabilites to the questions from the survey?
What is the product of these probabilities?
Do you agree that multiplying these conditional probabilities is correct under the model or at least a lower bound of the probability of AGI existential catastrophe? Do you agree with the mathematical inequality P(A)≥P(A|B)⋅P(B)?
Is the result from 2. equal approximately equal to 1.6%, or below 3%?
I think if the author accepts 2. + 3. + 4. (which I think they will), they have to give probabilities that are significantly lower than those of many survey respondents.
I do conceed that there is a empirical question whether it is better to aggregate survey results about probabilities using the arithmetic mean or the geometric mean, where the geometric mean would lead to lower results (closer in line with parts of this analysis) in certain models.
TLDR: I believe the author takes gometric means of probabilites when they should take the arithmetic mean.
Probabilities of probabilities can make sense if you specify what they’re over. Say the first level is the difficulty of the alignment problem, and the second one is our actions. The betting odds on doom collapse, but you can still say meaningful things, e.g. if we think there’s a 50% chance alignment is 1% x-risk and a 50% chance it’s 99% x-risk, then the tractability is probably low either way (e.g. if you think the success curve is logistic in effort).
You are probably right that in some cases probabilities of probabilities can contain further information. On reflection, I probably should not have objected to having probabilities of probabilities, because whether you collapse them immediately or later does not change the probabilities, and I should have focused on the arguments that actually change the probabilities.
That said, I still have trouble parsing “there’s a 50% chance alignment is 1% x-risk and a 50% chance it’s 99% x-risk”, and how it would be different from saying “there’s a 50% chance alignment is 27% x-risk and a 50% chance it’s 73% x-risk”. Can you explain the difference? Because they feel the same to me (Maybe you want to gesture at something like “If we expand more thinking effort, we will figure out whether we live in a 1% x-risk world or a 99% x-risk world, but after we figure that out further thinking will not move our probabilities away from 1% or 99%”, but I am far from sure that this is something you want to express here).
If you want to make an argument about tractability, in my view that would require a different model, which then could make statements like “X amount of effort would change the probability of catastrophe from 21% to 16%”. Of course, that model for tractability can reuse un-collapsed probabilities of the model for estimating xrisk.
I don’t know if a rough analogy might help, but imagine you just bought a house . The realtor warns you that some houses in this neighbourhood have faulty wiring, and your house might randomly set on fire during the 5 years or so you plan to live in it (that is, there is a 10% or whatever chance per year the house sets on fire). There are certain precautions you might take, like investing in a fire blanket and making sure your emergency exits are always clear, but principally buying very good home insurance, at a very high premium.
Imagine then you meet a builder in a bar and he says, “Oh yes, Smith was a terrible electrician and any house Smith built has faulty wiring, giving it a 50% chance of fire each year. If Smith didn’t do your wiring then it is no more risky than any other house, maybe 1% per year”. You don’t actually live in a house with a 10% risk, you live in a house with a 1% or 50% risk. Each of those houses necessitates a different strategy—in a low risk house you can basically take no action, and save money on the premium insurance. In the high risk house you want to basically sell immediately (or replace the wiring completely). One important thing you would want to do straight away is discover if Smith or Jones built your house, which is irrelevant information in the first situation before you met the builder in the bar, where you implicitly have perfect certainty. You might reason inductively—“I saw a fire this year, so it is highly likely I live in a home that Smith built, so I am going to sell at a loss to avoid the fire which will inevitably happen next year” (compared to the first situation where you would just reason you were unlucky)
I totally agree with your final paragraph—to actually do anything with the information there is an asymmetrically distributed ex post AI Risk requires a totally different model. This is not an essay about what to actually do about AI Risk. However hopefully this comment gives perhaps a sketch picture of what might be accomplished when such a model is designed and deployed.
I’m not sure that this responds to the objection. Specifically, I think that we would need to clarify what is meant by ‘risk’ here. It sounds like what you’re imagining is having credences over objective chances. The typical case of that would be not knowing whether a coin was biased or not, where the biased one would have (say) 90% chance of heads, and having a credence about whether the coin is biased. In such a case the hypotheses would be chance-statements, and it does make sense to have credences over them.
However, it’s unclear to me whether we can view either the house example or AGI risk as involving objective chances. The most plausible interpretation of an objective chance usually involves a pretty clear stochastic causal mechanism (and some would limit real chances to quantum events). But if we don’t want to allow talk of objective chances, then all the evidence you receive about Smith’s electricity skills, and the probability that they built the house, is just more evidence to conditionalize your credences on, which will leave you with a new final credence over the proposition we ultimately care about: whether your house will burn down. If so, the levels wouldn’t make sense, I think, and you should just multiply through.
I’m not sure how this affects the overall method and argument, but I do wonder whether it would be helpful to be more explicit what is on the respective axes of the graphs (e.g. the first bar chart), and what exactly is meant by risk, to avoid risks of equivocation.
I’m not an AI Risk expert, so any answer I gave to 1 would just be polluting. Let’s say my probabilities are A and B for a two-parameter Carlsmith Model, and those parameters could be 3% or 33% as per your example. So a simple mean of this situation is A = (3% + 33%)/2 = 18% and B is the same, so simple mean is ~3%. The geometric mean is more like 1%.
The most important point I wanted to get across is that the distribution of probabilities can be important in some contexts. If something important happens to our response at a 1% risk then it is useful to know that we will observe less than 1% risk in 3⁄4 of all possible worlds (ie worlds when A or B are at 3%). In the essay I argue that since strategies for living in a low-risk world are likely to be different from strategies for living in a high-risk world (and both sets of strategies are likely to be different from optimal strategy if we live in a simple-mean medium-risk world), distribution is what matters.
If we agree about that (which I’m not certain we do—I think possibly you are arguing that you can and should always reduce probabilities-of-probabilities to just probabilities?), then I don’t really have a strong position on your other point about geometric mean of odds vs simple mean. The most actionable summary statistic depends on the context. While I think geometric mean of odds is probably the correct summary statistic for this application, I accept that there’s an argument to be had on the point.
I can understand if you don’t want to state those probabilities publicly. But then I don’t know how to resolve what feels to me like an inconsistency. I think you have to bite one of these two bullets:
Most survey respondents are wrong in (some or most of) their probabilities for the “Conditional on …” questions, and your best guess at (some or most of) these probabilities is much lower.
The probability of AGI catastrophe conditional on being invented is much higher than 1.6%
Which one is it? Or is there a way to avoid both bullets while having consistent beliefs (then I would probably need concrete probabilities to be convinced)?
Hmm… I don’t see a contradiction here. I note you skimmed some of the methods, so it might perhaps help explain the contradiction to read the second half of section 3.3.2?
The bullet I bite is the first—most survey respondents are wrong, because they give point probabilities (which is what I asked for, in fairness) whereas in reality there will be uncertainty over those probabilities. Initiatively we might think that this uncertainty doesn’t matter because it will ‘cancel out’ (ie every time you are uncertain in a low direction relative to the truth I am uncertain in a high direction relative to the truth) but in reality—given specific structural assumptions in the Carlsmith Model—this is not true. In reality, the low-end uncertainty compounds and the high-end uncertainty is neutered, which is why you end up with an asymmetric distribution favouring very low-risk outcomes.
Thanks for biting a bullet, I think I am making progress in understanding your view.
I also realized that part of my “feeling of inconsistency” comes from not having realized that the table in section 3.2 reports geometric mean of odds instead of the average, and where the average would be lower.
Lets say we have a 2-parameter Carlsmith model, where we estimate probabilities P(A) and P(B|A), in order to get to a final estimate of the probability P(A∩B). Lets say we have uncertainty over our probability estimates, and we estimate P(A) using a random variable X, and estimate P(B|A) using a random variable Y. To make the math easier, I am going to assume that X,Y are discrete (I can repeat it for a more general case, eg using densities if requested): We have k possible estimates ai for P(A), and pi:=P(X=ai) is the probability that X assigns the value ai for our estimate of P(A). Similarly, bi are estimates for P(B|A) that Y outputs with probability qi:=P(Y=bi). We also have ∑ki=1pi=∑ki=1qi=1.
Your view seems to be something like “To estimate P(A∩B), we should sample from X and Y, and then compute the geometric mean of odds for our final estimate.”
Sampling from X and Y, we get values ai⋅bi with probability pi⋅qi, and then taking the geometric mean of odds would result in the formula
P(A∩B)=k∏i=1k∏j=1(aibj1−aibj)piqj.
Whereas my view is “We should first collapse the probabilities by taking the mean, and then multiply”, that is we first calculate P(A)=∑ki=1aipi and P(B|A)=∑kj=1biqi, for a final formula of
P(A∩B)=(k∑i=1aipi)(k∑j=1bjqj).
And you are also saying ”P(A∩B)=P(A)⋅P(B|A) is still true, but the above naive estimates for P(A) and P(B) are not good, and should actually be different (and lower than typical survey respondents in the case of AI xrisk estimates).” (I can’t derive a precise formula from your comments or my skim of the article, but I don’t think thats a crucial issue.)
Do I characterize your view roughly right? (Not saying that is your whole view, just parts of it).
Have you looked at how sensitive this analysis is to outliers, or to (say) the most extreme 10% of responses on each component?
The recent Samotsvety nuclear risk estimate removed the largest and smallest forecast (out of 7) for each component before aggregating (the remaining 5 forecasts) with the geometric mean. Would a similar adjustment here change the bottom line much (for the single probability and/or the distribution over “worlds”)?
The prima facie case for worrying about outliers actually seems significantly stronger for this survey than for an org like Samotsvety, which relies on skilled forecasters who treat each forecast professionally. This AI survey could have included people who haven’t thought in much depth about AI existential risk, or who aren’t comfortable with the particular decomposition you used, or who aren’t good at giving probabilities, or who didn’t put much time/effort/thought into answering these survey questions.
And it seems like the synthetic point estimate method used here might magnify the impact of outlier respondents rather than attenuating it. An extreme response can move the geometric mean a lot, and a person who gives extreme answers on 3 of the components can have their extreme estimates show up in 3/n of the synthetic estimates, not just 1/n.
I had not thought to do that, and it seems quite sensible (I agree with your point about prima facie worry about low outliers). The results are below.
To my eye, the general mechanism I wanted to defend about is preserved (there is an asymmetric probability of finding yourself in a low-risk world), but the probability of finding yourself in an ultra-low-risk world has significantly lowered, with that probability mass roughly redistributing itself around the geometric mean (which itself has gone up to 7%-ish)
In some sense this isn’t totally surprising—removing the lowest 10% of estimates means that order-of-magnitude uncertainty is only preserved for one of the six parameters in the equation (Containment), so the SDO mechanism doesn’t really apply. I don’t have the subject-specific knowledge to conclude is de-extremising the data in this way is reasonable (do we actually have better-than-order-of-magnitude knowledge about all of these parameters except Containment?), but the analysis you suggest is an important limitation of my results which I had totally overlooked, so thank you for the suggestion.
Sorta kinda, yes? For example, convincingly arguing that any conditional probability in Carlsmith decomposition is less than 10% (while not inflating others) would probably win the main prize given that “I [Nick Beckstead] am pretty sympathetic to the analysis of Joe Carlsmith here.” + Nick is x3 higher than Carlsmith at the time of writing the report.
My understanding of what everyone is producing (Carlsmith, Beckstead etc) is their point estimate / most likely probability for some proposition being true. Shifting this point estimate to below 10% would be near enough a prize, but plenty of real-world applications have highish point estimates with a lower bound uncertainty that is very low.
The application where I am most familiar with this effect is clinical trials for oncology drugs; it isn’t uncommon for the point estimate for a drug’s effectiveness to be (say) 50% better than all other drugs on the market, but with a 95% confidence interval that covers no better at all, or even sometimes substantially worse. It seems to me to be quite a radical claim that we have better knowledge of AI Risk across nearly all parameters than we have of an oncology drug across a single parameter following a clinical trial.
Did you only drop the low outliers, or did you drop both the low outliers and the high outliers?
I dropped 10% from both the low and high end- so the analysis in the results above are the most central 80% of estimates for each parameter (although just eyeballing the data I was left with quite a few >99% probabilities even after dropping the extreme top end)
“Please also note that my computer stubbornly refuses to calculate the true geometric mean of odds of the distribution by taking the 5000th root of the results, so I’ve used an approximation. However, this approximation is close enough to the actual value that you can treat it as being correct for the purpose of discussion.”
Just a thought about this one, you should be able to get better results here by summing the logarithms, dividing by 5000 then exponentiating. It’s the same reason people maximise the log likelihood rather than the likelihood for parametric distribution parameter estimation, it just lets the computer work with much more regular scaled numbers.
The numbers that you get from this sort of exercise will depend heavily on which people you get estimates from. My guess is that which people you include matters more than what you do with the numbers that they give you.
If the people who you survey are more like the general public, rather than people around our subcultural niche where misaligned AI is a prominent concern, then I expect you’ll get smaller numbers.
Whereas, in Rob Bensinger’s 2021 survey of “people working on long-term AI risk”, every one of the 44 people who answered the survey gave an estimate larger than the 1.6% headline figure here. The smallest answer was 1.9%, and the central tendency was somewhere between 20% and 40% (depending on whether you look at the median, arithmetic mean, or geometric mean of the odds, and which of the two questions from that survey you look at).
I completely agree that the survey demographic will make a big difference to the headline results figure. Since I surveyed people interested in existential risk (Astral Codex Ten, LessWrong, EA Forum) I would expect the results to bias upwards though. (Almost) every participant in my survey agreed the headline risk was greater than the 1.6% figure from this essay, and generally my results line up with the Bensinger survey.
However, this is structurally similar to the state of Fermi Paradox estimates prior to SDO ‘dissolving’ this—that is, almost everyone working on the Drake Equation put the probable number of alien civilisations in this universe very high, because they missed the extremely subtle statistical point about uncertainty analysis SDO spotted, and which I have replicated in this essay. In my opinion, Section 4.3 indicates that as long as you have any order-of-magnitude uncertainty you will likely get asymmetric distribution of risk, and so in that sense I disagree that the mechanism depends on who you ask. The mechanism is the key part of the essay, the headline number is just one particular way to view that mechanism.
If we actually take these to be the probabilities that we live in various kinds of worlds, then it’s just a law of conditional probability that the overall probability is the arithmetic mean of the individual probabilities, not the geometric mean, I believe.
I could imagine ways to philosophically justify taking the geometric mean here anyway, e.g. by arguing that our synthetic samples are drawn from a large community of synthetic experts that is an accurate extrapolation of actual experts, and that it’s a good idea to take the geometric mean of forecasts. [EDIT 1: I’m guessing this should be done with odds instead of probabilities though, and that this would bump the answer upward.] [EDIT 2: In fact, it was done with odds already.] But the former seems implausible given that the products of the numbers given by individual experts tend to be larger (in particular, larger mean) than the ones found for the synthetic community – this suggests that experts are giving correlated answers to the different questions. Perhaps we should think that some sort of idealized experts would answer these subquestions independently, but with the same distribution as the empirical one in this sample? It’s not clear to me that this is the case. In any case, if there is good reason to take the geometric mean here, I think the analysis could greatly benefit from presenting a clear justification of this, as the answer depends on this up to close to an order of magnitude.
I read your footnote 9 on this question regarding the geometric mean vs the arithmetic mean, and found it confusing. If the picture given in the first paragraph of my comment is indeed what you have in mind, then shouldn’t the Brier-score-maximizing prediction still be the arithmetic mean (as that is the all-things-considered probability)? I don’t see how the geometric mean would come into play.
[EDIT 1: The following is wrong re the 1.6% number, because that was the geometric mean of odds, not the geometric mean of probabilities as I assumed here.]
By the way, as the number of samples you take goes to infinity, I think the geometric mean of the sampled probabilities converges (in probability) to a limit which has a simple form in terms of the data. (After taking the log, this should just be a consequence of the law of large numbers.) Namely, it converges to the geometric mean of all the products of numbers from individual predictions! So instead of getting 1.6% from the sampling, I think you could have multiplied 42 numbers you calculated to find the number this 1.6% would converge to in the limit as the number of samples goes to infinity. I.e., what I have in mind are the numbers that were averaged to get the 18.7% number below. [EDIT 2: That’s not quite true, because the 18.7% was not the average of the products, but instead the product of the averages.]
Could you compute this number? Or feel free to let me know if I’m missing something. I’m also happy to elaborate further on the argument for convergence I have in mind.
I’m not completely sure I understand your request. The screenshot below is the Excel file with the survey results in. Column U is the product of columns N to S. You’d like the geometric mean of odds of column U? This is 0.023, which is approximately 2.3%. This isn’t quite the same as the estimate in my model, I think because there is some missing survey data which isn’t carried over into the model
Thanks! That’s indeed the quantity I was interested in, modulo me incorrectly thinking that you computed the geometric mean of probabilities and not odds.
Given that you used odds when computing the geometric mean, I retract my earlier claim that there is such a simple closed-form limit as the number of samples goes to infinity. Thanks for the clarification!
Here is another claim along similar lines: in the limit as the number of samples goes to infinity, I think the arithmetic mean of your sampled probabilities (currently reported as 9.65%) should converge (in probability) to the product of the arithmetic means of the probabilities respondents gave for each subquestion. So at least for finding this probability, I think one need not have done any sampling.
If you’d like to test this claim, you could recompute the numbers in the first column below with the arithmetic mean of the probabilities replacing the geometric mean of the odds, and find what the 18.7% product becomes.
Hope I’ve understood you right! I’ve taken the arithmetic mean of all columns and then computed the product of those arithmetic means. I end up with 9.74%. Again, I think this is slightly different from my model’s estimate of the value because the survey has some missing data which doesn’t occur in the synthetic distribution of the model
Thanks, this is great!
Just a small clarification point I didn’t make clear enough in the essay—my geometric mean is always the geometric mean of odds, converted back into probability because it makes it easier to interpret for most readers. So 1.6% is genuinely the geometric mean of odds, but I take your point that the geometric mean of odds might not be the best summary statistic to use in the first place. To reiterate though, my main argument is that point estimates are misleading in this case regardless of which point estimate you use, and distributions of ex post risk are important to consider.
I’m really sorry, I don’t know what I meant by the reference to Briar Scores either—I’ll change that footnote until I can figure out what I was trying to say.
I can buy that it is sometimes useful to think about x-risk in terms of a partition of the worlds we could be in, the probability of each part in the partition, and the probability of x-risk in each part. For this to be useful in decision-making, I think we’d want the partition to sort of “carve reality at its joints” in a way that’s relevant to the decisions we’d like to make. I’m generally unconvinced that the partition given here achieves this.
My best attempt at trying to grok the partition here is that worlds are grouped according to something like the “intrinsic difficulty” of alignment, with the remaining uncertainty being over our actions to tackle alignment. But I don’t see a good reason to think that the calculation methodology used in the post would give us such a partition. Perhaps there is another natural way to interpret the partition given, but I don’t see it.
For a more concrete argument against this distribution of probabilities capturing something useful, let’s consider the following two respondents. The first respondent is certain about the “intrinsic difficulty” of alignment, thinking we just have a probability of 50% of surviving. Maybe this first respondent is certain that our survival is determined by an actual coinflip happening in 2040, or whatever. The other respondent thinks there is a 50% chance we are in a world in which alignment is super easy, in which we have a 99% chance of survival, and a 50% chance we are in a world in which alignment is super hard, in which we have a 1% chance of survival. Both respondents will answer 50% when we ask them what their p(doom) is, but they clearly have very different views about the probability distribution on the “intrinsic difficulty” of alignment.
Now, insofar as the above makes sense, it’s probably accurate to say that most respondents’ views on most of the surveyed questions are a lot like respondent 2, with a lot of uncertainty about the “intrinsic difficulty” involved, or whatever the relevant parameter is that the analysis hopes to partition according to. However, the methodology used would give the same results if the people we surveyed were all like respondent 1 and if the people we surveyed were all like respondent 2. (In fact, my vague intuition is that the best attempt to philosophically ground the methodology would assume that everyone is like respondent 1.) This seems strange, because as far as I can intuitively capture what the distribution over probabilities is hoping to achieve, it seems that it should be very different in the two cases. Namely, if everyone is like respondent 1, the distribution should be much more concentrated on certain kinds of worlds than if everyone is like respondent 2.
Note that the question about the usefulness of the partition is distinct from whether one can partition the worlds into groups with the given conditional probabilities of x-risk. If I think a coin lands heads in 50% of the worlds, the math lets me partition all the possible worlds into 50% where the coin has a 0% probability of landing heads, and 50% where the coin has a 100% probability of landing heads. Alternatively, the math also lets me partition all possible worlds into 50% where the coin has 50% probability of landing heads, and 50% where the coin has 50% probability of landing heads. What I’m doubting is that either distribution would be helpful here, and that the distribution given in the post is helpful for understanding x-risk.
Here is a model that involves taking thousands of trials of the product of six variables randomly set between 10% and 90% (e.g. 0.5^6 = 0.015 = 1.5%).
As other people have noted, conjunctive models tend to produce low probabilities (<5%).
Thanks, this is really interesting—in hindsight I should have included something like this when describing the SDO mechanism, because it illustrates it really nicely. Just to follow up on a comment I made somewhere else, the concept of a ‘conjunctive model’ is something I’ve not seen before and implies a sort of ontology of models which I haven’t seen in the literature. A reasonable definition of a model is that it is supposed to reflect an underlying reality, and this will sometimes involve multiplying probabilities and sometimes involve adding two different sources of probabilities.
I’m not an expert in AI Risk so I don’t have much of a horse in this race, but I do note that if the one published model of AI Risk is highly ‘conjunctive’ / describes a reality where many things need to occur in order for AI Catastrophe to occur then the correct response from the ‘disjunctive’ side is to publish their own model, not argue that conjunctive models are inherently biased—in a sense ‘bias’ is the wrong term to use here because the case for the disjunctive side is that the conjunctive model accurately describes a reality which is not our own.
(I’m not suggesting you don’t know this, just that your comment assumes a bit of background knowledge from the reader I thought could potentially be misinterpreted!)
My paraphrase of the SDO argument is:
…which seems pretty obvious, right?
So back to the context of AI risk. We have:
a framework in which risk is a conjunctive combination of factors…
…in which, at several of the steps, a subset of survey respondents give rather low probabilities for that factor being present
So at each step in the conjunctive argument, we wind up with some weight on “maybe this factor is really low”. And those add up.
I don’t find the correlation table (of your other comment) convincing. When I look at the review table, there seem to be obvious optimistic outliers—two of the three lowest numbers on the whole table came from the same person. And your method has those optimistic outliers punching above their weight.
(At least, you should be calculating correlations between log(probability), right? Because it’s multiplicative.)
Anyway, I think that AI risk is more disjunctive than conjunctive, so I really disagree with the whole setup. Recall that Joe’s conjunctive setup is:
Of these:
1 is legitimately a conjunctive factor: If there’s no AGI, then there’s no AGI risk. (Though I understand that 1 is out of scope for this post?)
I don’t think 2 is a conjunctive factor. If there are not strong incentives to build APS systems, I expect people to do so anyway, sooner or later, because it’s scientifically interesting, it’s cool, it helps us better understand the human brain, etc. For example, I would argue that there are not strong incentives to do recklessly dangerous gain-of-function research, but that doesn’t seem to be stopping people. (Or if “doing this thing will marginally help somebody somewhere to get grants and tenure” counts as “strong incentives”, then that’s a very low bar!)
I don’t think 3 is a conjunctive factor, because even if alignment is easy in principle, there are bound to be people who want to try something different just because they’re curious what would happen, and people who have weird bad ideas, etc. etc. It’s a big world!
4-5 does constitute a conjunctive factor, I think, but I would argue that avoiding 4-5 requires a conjunction of different factors, factors that get us to a very different world involving something like a singleton AI or extreme societal resilience against destructive actors, of a type that seems unlikely to me. (More on this topic in my post here.)
6 is also a conjunctive factor, I think, but again avoiding 6 requires (I think) a conjunction of other factors. Like, to avoid 6 being true, we’d probably need to a unipolar outcome (…I would argue…), and the AI would need to have properties that are “good” in our judgment, and the AI would probably need to be able to successfully align its successors and avoid undesired value drift over the vast times and distances.
I think you’re using a philosophical framework I just don’t recognise here - ‘conjunctive’ and ‘disjunctive’ are not ordinary vocabulary in the sort of statistical modelling I do. One possible description of statistical modelling is that you are aiming to capture relevant insights about the world in a mathematical format so you can test hypotheses about those insights. In that respect, a model is good or bad based on how well its key features reflect the real world, rather than because it takes some particular position on the conjunctive-vs-disjunctive dispute. For example I am very excited to see the results of the MTAIR project, which will use a model a little bit like the below. This isn’t really ‘conjunctive’ or ‘disjunctive’ in any meaningful sense—it tries to multiply probabilities when they should be multiplied and add probabilities when they should be added. This is more like the philosophical framework I would expect modelling to be undertaken in.
I’d add that one of the novel findings of this essay is that if there are ‘conjunctive’ steps between ‘disjunctive’ steps it is likely the distribution effect I find will still apply (that is, given order-of-magnitude uncertainty). Insofar as you agree that 4-ish steps in AI Risk are legitimately conjunctive as per your comment above, we probably materially agree on the important finding of this essay (that the distribution of risk is asymmetrically weighted towards low-risk worlds) even if we disagree about the exact point estimate around which that distribution skews
Small point of clarification—you’re looking at the review table for Carlsmith (2021), which corresponds to Section 4.3.1. The correlation table I produce is for the Full Survey dataset, which corresponds to Section 4.1.1. Perhaps to highlight the difference, in the Full Survey dataset of 42 people; 5 people give exactly one probability <10%, 2 people give exactly two probabilities <10%, 2 people give exactly three probabilities <10% and 1 mega-outlier gives exactly four probabilities <10%. To me this does seem like there is evidence of ‘optimism bias’ / correlation relative to what we might expect to see (which would be closer to 1 person giving exactly 2 probabilities <10% I suppose), but not enough to fundamentally alter the conclusion that low-risk worlds are more likely than high-risk worlds based on community consensus (eg see section 4.3.3)
Does the table in section 3.2 take the geometric mean for each of the 6 components?
From footnote 7 it looks like it does, but if it does then I don’t see how this gives such a different bottom line probability from the synthetic method geomean in section 4 (18.7% vs. 1.65% for all respondents). Unless some probabilities are very close to 1, and those have a big influence on the numbers in the section 3.2 table? Or my intuitions about these methods are just off.
That’s correct—the table gives the geometric mean of odds for each individual line, but then the final line is a simple product of the preceding lines rather than the geometric mean of each individual final estimate. This is a tiny bit naughty of me, because it means I’ve changed my method of calculation halfway through the table—the reason I do this is because it is implicitly what everyone else has been doing up until now (e.g. it is what is done in Carlsmith 2021) , and I want to highlight the discrepancy this leads to.
Could you post something closer to the raw survey data, in addition to the analysis spreadsheet linked in the summary section? I’d like to see something that:
Has data organized by respondent (a row of data for each respondent)
Shows the number given by the respondent, before researcher adjustments (e.g., answers of 0 are shown as “0“ and not as ”.01”) (it’s fine for it to show the numbers that you get after data cleaning which turns “50%” and “50″ into “0.5”)
Includes each person’s 6 component estimates, along with a few other variables like their directly elicited p(catastrophe), whether they identified as an expert, and (if you have the data) whether they came to the survey via ACX, LW, or the EA Forum
Has the exact text of every question
Yes I will do, although some respondents asked to remain anonymous / not have their data publicly accessible and so I need to make some slight alterations before I share. I’d guess a couple of weeks for this