Growth and the case against randomista development
Update, 3/8/2021: I (Hauke) gave a talk at Effective Altruism Global on this post:
Summary
Randomista development (RD) is a form of development economics which evaluates and promotes interventions that can be tested by randomised controlled trials (RCTs). It is exemplified by GiveWell (which primarily works in health) and the randomista movement in economics (which primarily works in economic development).
Here we argue for the following claims, which we believe to be quite weak:
Prominent economists make plausible arguments which suggest that research on and advocacy for economic growth in low- and middle-income countries is more cost-effective than the things funded by proponents of randomista development.
Effective altruists have devoted too little attention to these arguments.
Assessing the soundness of these arguments should be a key focus for current generation-focused effective altruists over the next few years.
We hope to start a conversation on these questions, and potentially to cause a major reorientation within EA.
We also believe the following stronger claims:
4. Improving health is not the best way to increase growth.
5. A ~4 person-year research effort will find donation opportunities working on economic growth in LMICs which are substantially better than GiveWell’s top charities from a current generation human welfare-focused point of view.
However, economic growth is not all that matters. GDP misses many crucial determinants of human welfare, including leisure time, inequality, foregone consumption from investment, public goods, social connection, life expectancy, and so on. A top priority for effective altruists should be to assess the best way to increase human welfare outside of the constraints of randomista development, i.e. allowing intervention that have not or cannot be tested by RCTs.
We proceed as follows:
We define randomista development and contrast it with research and advocacy for growth-friendly policies in low- and middle-income countries.
We show that randomista development is overrepresented in EA, and that, in contradistinction, research on and advocacy for growth-friendly economic policy (we refer to this as growth throughout) is underrepresented
We then show why some prominent economists believe that, a priori, growth is much more effective than most RD interventions.
We present a quantitative model that tries to formalize these intuitions and allows us to compare global development interventions with economic growth interventions. The model suggests that under plausible assumptions a hypothetical growth intervention can be thousands of times more cost-effective than typical RD interventions such as cash-transfers. However, when these assumptions are relaxed and compared to the very good RD interventions, growth interventions are on a similar level of effectiveness as RD interventions.
We consider various possible objections and qualifications to our argument.
Acknowledgements
Thanks to Stefan Schubert, Stephen Clare, Greg Lewis, Michael Wiebe, Sjir Hoeijmakers, Johannes Ackva, Gregory Thwaites, Will MacAskill, Aidan Goth, Sasha Cooper, and Carl Shulman for comments. Any mistakes are our own. Opinions are ours, not those of our employers.
Marinella Capriati at GiveWell commented on this piece, and the piece does not represent her views or those of GiveWell.
1. Defining Randomista Development
We define randomista development (RD) as an approach to development economics which investigates, evaluates and recommends only interventions which can be tested by randomised controlled trials (RCTs).
RD can take low-risk or more “hits-based” forms. Effective altruists have especially focused on the low-risk form of RD: specifically, directly funding interventions that have been tested by RCTs, such as malaria bednet distributions and cash transfers. However, even within direct funding of such programmes, there is significant variation in the probability of success. For example, GiveWell thinks that deworming is a high risk/high-reward bet with a significant chance of having small effect but some chance of having a large effect. Other GiveWell recommended programmes offer a much more certain probability of impact.
More clearly hits-based forms of RD are possible. GiveWell has done various forms of more hits-based giving, including for example its support for the Center for Suicide Prevention, which advocates for policy change at the national level in India and Nepal. Co-Impact, a collaborative philanthropy group, is advocating for national scale-up of the RCT-supported education programme Teaching at the Right Level across Africa. By this definition, RD also includes advocacy and scale-up of scientific research that can be tested by RCTs, such as mosquito gene drives, researching vaccines or antibiotics, or the agricultural research that led to the Green Revolution.[1]
2. Randomista development is popular in EA
Global poverty remains a popular cause area among people interested in EA.[2] EA has especially focused on directly funding RCT-backed interventions. GiveWell moved $161m to RCT-backed charities in 2018.[3] The Effective Altruism Global Health and Development Fund has disbursed most of its funds to charities that directly implement RCT-backed interventions.
Recently, GiveWell announced that they will expand their research beyond RD to include difficult-to-evaluate interventions. This could include economic growth, though their initial focus is on improving health policy. Nonetheless, as things stand at the moment, most of the EA money in global development focuses on directly funding interventions that can be tested by RCTs. Almost all EAs interested in global development we have met at events like EAG seem focused on directly funding, or working for, organisations implementing interventions that can be tested by RCTs.
We too used to support direct funding of interventions that can be tested by RCTs, but now believe it is suboptimal. We will argue that research and advocacy for growth-friendly economic policies can often be orders of magnitude more cost-effective than direct funding of evidence-based interventions. The case against hits-based RD is less clear and we leave that to future work.
The ideas here rely heavily on work by Lant Pritchett of the Blavatnik School of Government in Oxford.[4] However, within economics there is considerable support for similar views (see Appendix 1).
3. The case for economic growth and against randomista development
In this section, we set out three arguments for the proposition that research and advocacy for growth is more cost-effective than directly funding interventions tested by RCTs. However, since economic growth is not all that matters, this does not necessarily mean that advocacy for growth is the best way to increase human welfare. To reiterate: we focus on economic growth here, and aim to show that research and advocacy for growth is better than randomista development. However, there may be other ways to cost-effectively increase human welfare outside of the constraints of RD (e.g. through decreasing inequality or improving the provision of public goods that are not properly reflected in GDP).
3.1. Economic growth explains a substantial fraction of the variance in human welfare today
In this section, we discuss the relationship between income per head and different objective and subjective measures of welfare.
Income per head and broad measures of welfare
Today, there is significant variation in income per head across the world:
If markets function reasonably well and people are broadly rational, then richer people will buy more goods which have a substantial private good element,[5] such as:
Food
Transport
Shelter
Lighting
Electricity
Education
Healthcare
Therefore, we have strong reasons to think that these large cross-national differences in income per head cause large differences in human welfare due to differential consumption of private goods.
This does not mean that GDP is all that matters. The metric of GDP per capita misses some crucial contributors to human welfare, including:
Public goods: Increasing income per head reliably increases consumption of private goods. However, it might not necessarily increase public goods, such as public health interventions, clean air, public safety, electricity grids, sanitation, and so on.
Consumption: High levels of investment increase GDP but also constitute foregone consumption, which involves a loss of welfare that is not reflected in GDP.
Leisure: High hours worked per capita deliver higher GDP but also constitute foregone leisure time, which involves a loss of welfare that is not reflected in GDP
Inequality: Individuals get diminishing marginal utility from income, so income gains to the better-off should be valued less than income gains to the worse-off. Thus, holding income per capita and everything else equal, societies with a more equal income distribution must have greater welfare per person. In addition, income and other resources might be positional goods—perceiving others to be richer might be another mechanism by which inequality might lead to lower overall welfare. This is a difference in welfare that is not captured by GDP.
Social connection: Social connection is not represented in GDP statistics but is a major determinant of human welfare.
Health: A country can have higher income per head than another, but the lives of its citizens could be worse if they die earlier or suffer greater morbidity.
It is therefore interesting to explore how well GDP per capita correlates with more holistic measures of welfare that try to account for these other determinants. There have been numerous attempts to build a more holistic measure of welfare than GDP per capita. In a 2016 paper, Jones and Klenow used measures of consumption, leisure, inequality, and mortality, to create a consumption-equivalent welfare measure that allows comparisons across time for a given country, as well as across countries.[6]
This measure of human welfare suggests that the true level of welfare of some countries differs markedly from the level that might be suggested by their GDP per capita. For example, France’s GDP per capita is around 60% of US GDP per capita.[7] However, France has lower inequality, lower mortality, and more leisure time than the US. Thus, on the Jones and Klenow measure of welfare, France’s welfare per person is 92% of US welfare per person.[8]
Although GDP per capita is distinct from this expanded welfare metric, the correlation between GDP per capita and this expanded welfare metric is very strong at 0.96, though there is substantial variation across countries, and welfare is more dispersed (standard deviation of 1.51 in logs) than is income (standard deviation of 1.27 in logs).[9]
GDP per capita is also very strongly correlated with the Human Development Index, another expanded welfare metric.[10] If measures such as these are accurate, this shows that income per head explains most of the observed cross-national variation in welfare. It is a distinct question whether economic growth explains most of the observed variation across individuals in welfare. It is, however, clear that it explains a substantial fraction of the variation across individuals.
This suggests that: taking this expansive account of human welfare, only so much can be achieved for a country holding its income per head at a low level. For instance, unless a country’s income per person is at least a quarter that of the US, then, empirically, its welfare per person can also not be more than a sixth that of the US.
Crucially, on the Jones and Klenow welfare metric, most developing countries are substantially poorer than incomes suggest because of a combination of shorter lives and extreme inequality. Lower life expectancy reduces welfare by 15 to 50 percent in the developing countries Jones and Klenow examine, which implies that global welfare inequality is greater than global income inequality.[11] Therefore, ensuring evenly shared growth and improved health is also important for human welfare. We do not investigate the best way to do that here, though we think that these goals are best advanced outside of the constraints of directly funding RCT-backed interventions.
We will now look in more detail at the relationship between income per head and some other indicators of human welfare.
Life expectancy
GDP per capita and life expectancy are correlated:
As this chart shows, the life expectancy associated with a given level of real income is rising over time. If economic development were the only determinant of health, countries that get richer would just move along the same curve. Since this is not the case, we can conclude that economic development cannot be the sole determinant of health: highly efficient public health interventions also play a major role. 60 years of public health improvements since 1950 increase cross-national life expectancy on average by around 8 years.
Nonetheless, the graph above shows that GDP per capita explains a significant fraction of the variation in life expectancy across countries. 60 years of sustained growth could shift a country from income per head of $1,000 to $32,500.[12] Today, this would be correlated with, though would not necessarily wholly cause, an increase in life expectancy by more than 20 years, on average. Today, almost no countries with income per head above $10,000 have life expectancy below 70 years. Most countries with income below $5,000 per head have life expectancy below 70 years, and a significant fraction have life expectancy below 60.
Life satisfaction
GDP per capita is also correlated with self-reported life satisfaction:
Once GDP per capita is above $20,000, no countries have average life satisfaction scores below 5; once it is below $3,000, almost no countries have self-reported life satisfaction scores above 5. The chart below shows the strength of the relationship more clearly as it does not put income on a logarithmic scale:
Source: 80,000 Hours
This shows the value of economic development for life satisfaction in low-income countries (as well as the limited benefits for rich countries).
Poverty
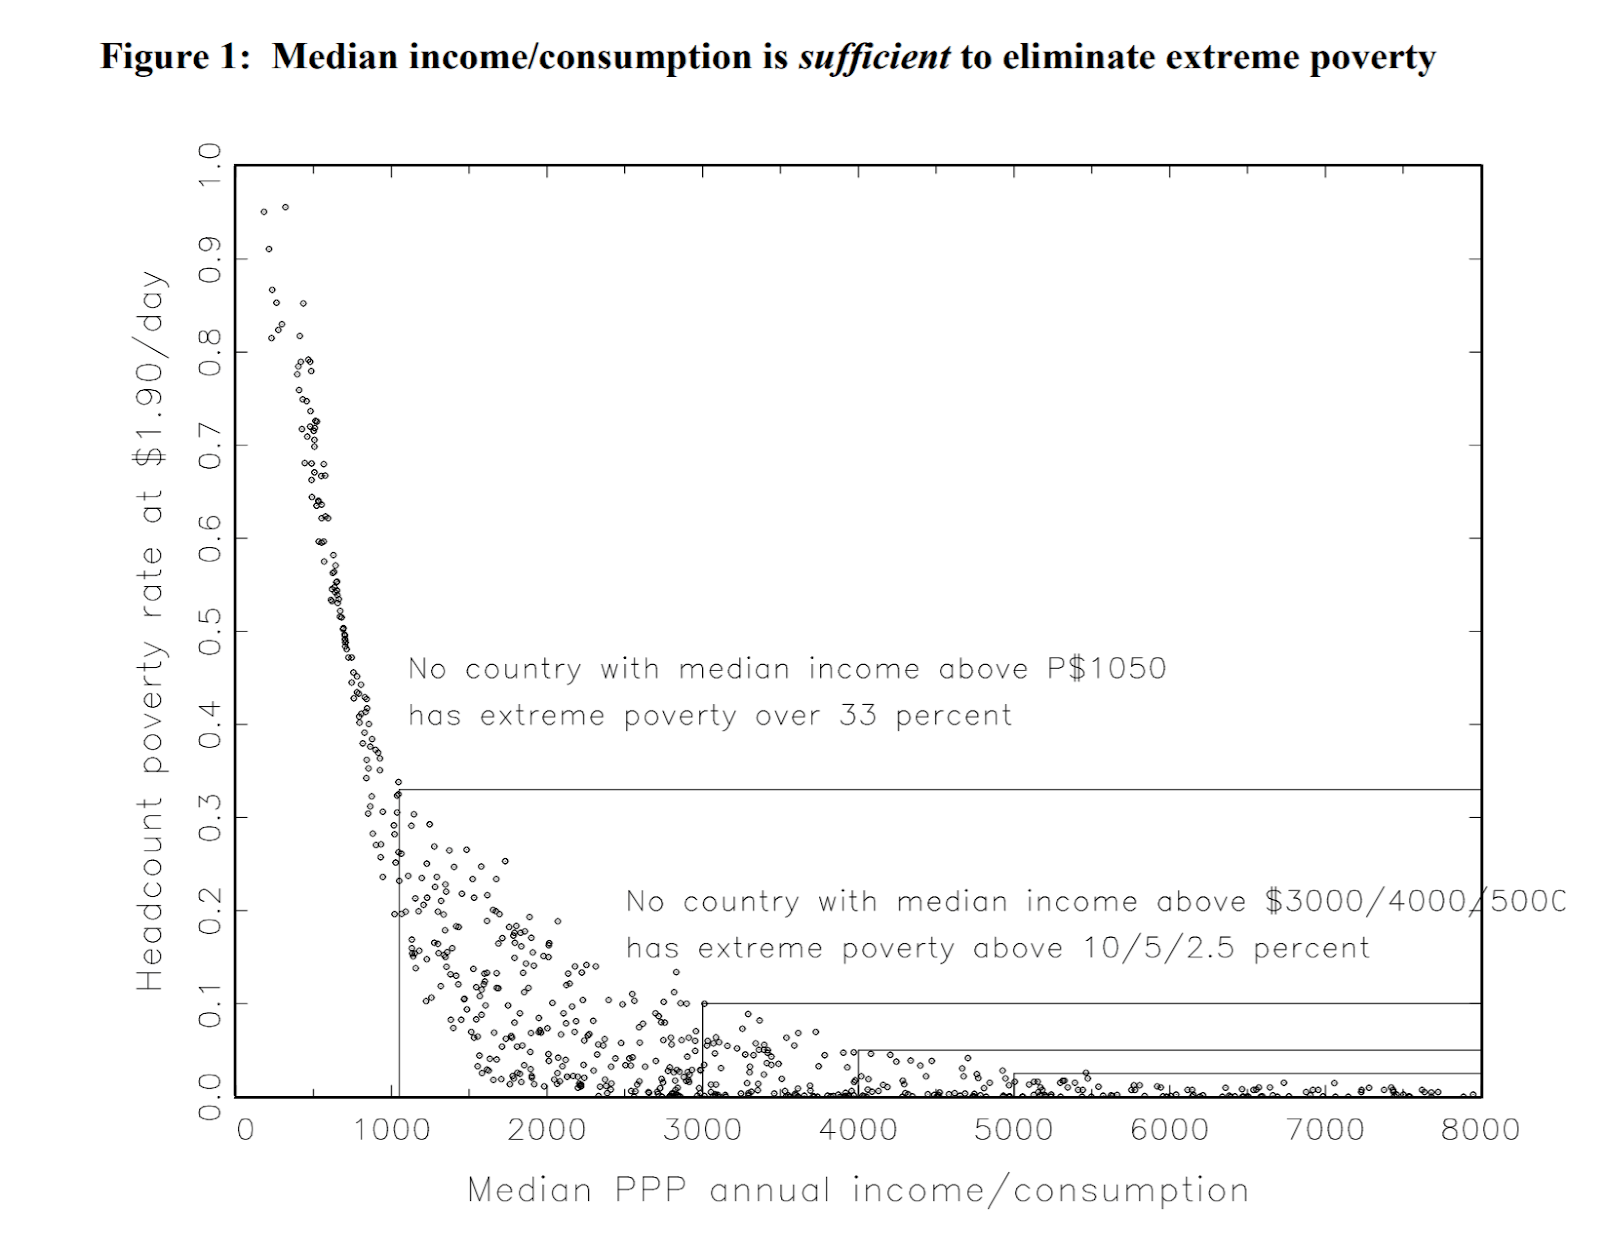
GDP per capita is very strongly associated with poverty reduction, on standard low-bar poverty thresholds. Increasing median income above a certain level is empirically sufficient to eliminate $1.90 a day poverty. Above a median income of $5,000, no country has low-bar poverty above 2.5%:
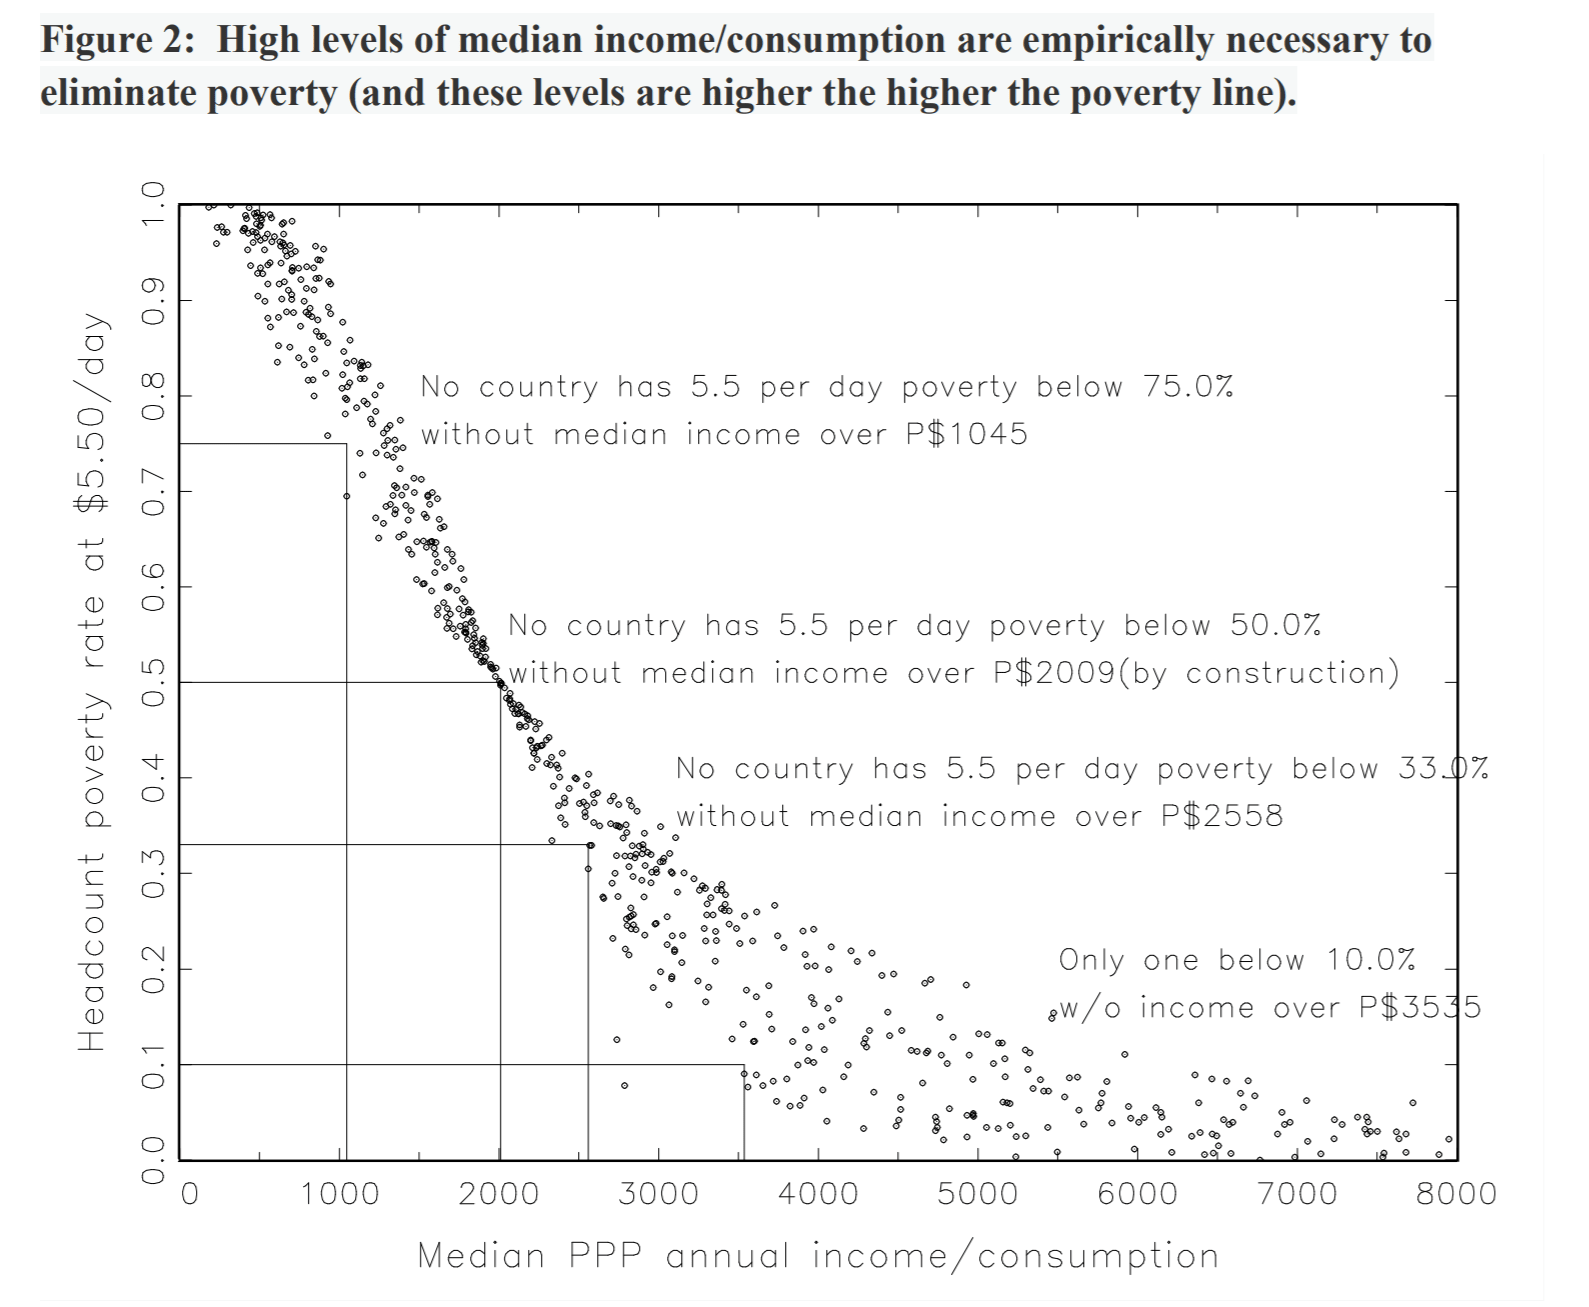
Increasing median per capita income above a certain level is also empirically necessary to eliminate poverty. No country (but one) has pushed $5.50/day poverty below 10 percent without increasing median income above $3,535.[13]
GDP and other indicators of welfare
There is also a strong correlation between GDP per capita and other indicators of welfare such as:
Economic growth as a driver of progress and the limitations of RD
The foregoing arguments show that GDP per capita is strongly correlated with many objective and subjective measures of welfare. Thus, empirical evidence shows that only so much can be achieved for a country at a low level of income per head. If a country has an income per head below $5,000, it is very likely to do poorly on most objective and subjective measures of welfare. If a country’s income per head is above $20,000, it is very likely to do well on most objective and subjective measures of welfare.
As discussed above, there are also good reasons to believe that increased GDP per capita causes many of these increases in welfare. This suggests that when we are working out how to increase human welfare to the greatest extent possible, then we should start by figuring out how best to increase GDP per capita. However, to our knowledge, EAs have not publicly published any investigations of this question.
Moreover, the vast majority of proponents of RD do not tackle the question of whether the interventions they assess increase economic growth. Instead, RD is overwhelmingly focused on evaluating the success of programmatic attempts to solve a problem in a specific target population, such as depression, educational attainment, intestinal worms or malaria. This does not mean that the things assessed by RD do not increase economic growth at all: indeed some RD health interventions increase earnings and consumption later in life, and thus do increase growth to an extent. However, evaluating whether the effect size is trivial or not should be a top priority for proponents of RD. (Hauke discusses the relationship between health and growth in Appendix 3.4)
Independently of this, we do not believe that the vast majority of RD interventions are plausibly among the top 100 ways to increase growth. For example, it is implausible that direct funding of the following interventions is the best way to increase GDP per capita:[14]
Malaria bednets
Deworming
HIV education
Mobile phone reminders for vaccinations
Improved cookstoves
Cash transfers
Etc.
The reason these things are unlikely to be the best way to increase growth is that they play no role in the causal story of the huge differences in GDP per capita across space and time. To illustrate:
It is not the case that Danish people are better off than Ugandans because they have implemented direct programmatic efforts of this kind to a greater extent.
It is not the case that Danish people today are better off than Danish people 100 years ago because they implemented this type of intervention.
When looking at the huge human welfare gains in China, Indonesia, Vietnam, Singapore, South Korea and Hong Kong in the second half of the 20th century, no-one argues that this was because they engaged in more interventions of this type.
The role of direct programmatic assistance in explaining the variance in economic outcomes is mirrored in surveys of people who have moved out of poverty. The role of direct NGO programmatic assistance is as small as we would expect, given the above. In a survey of 4,000 people across three states in India, 3 named “NGO assistance” (only slightly ahead of one person each naming “illegal activity” and “winning the lottery”).
Source: Pritchett, ‘Alleviating Global Poverty: Labor Mobility, Direct Assistance, and Economic Growth’, Center for Global Development, page 8.
It is true that there might be biases at play here that may cause under-reporting of NGO assistance as a cause of escape from poverty. Firstly, people may naturally want to attribute their success to their own hard work, even if NGOs did play a role. Secondly, the impact of some NGOs may be difficult to see, even for beneficiaries. For example, most people may not be able to notice the substantial effect of salt iodisation or the Green Revolution on their lives because such work is largely invisible to them. Nonetheless, this survey does suggest that direct funding of RCT-backed interventions have played a very small role in escape from poverty.
Moreover, and more controversially, we do not believe that health interventions (whether directly funded or implemented by the state) are the best way to increase growth in the poorest countries.[15] Here, we want to start a discussion on what the most effective causes of growth are, given its huge importance.
Overall, it would be very surprising if directly funding RD interventions turned out to be the best way to increase growth (especially given that they were not recommended on that basis in the first place). Given the strength of the correlation between growth and welfare, this should lead us to question whether RD is the best way to increase welfare.
What does explain cross-national differences in GDP per capita?
Thus, many RCT-backed interventions do not seem to explain much of the cross-national variation in GDP per capita. What does? There are a range of factors including:
Growth-friendly policies
Geography
Natural resources
Human capital
Culture
Within growth-friendly policies generally, some hits-based forms of RD may be promising. For example, the Green Revolution was a form of randomista development, and scale-up of that agricultural technology has saved the lives of hundreds of millions of people. There is also a correlation between educational performance and GDP per capita.[16] Thus, it is possible that scaling up RCT-backed educational interventions would increase GDP per capita. Assessing whether this and other RD interventions would be the most cost-effective way to increase GDP per capita should be a top priority for effective altruists.
However, many of the most promising growth-friendly policies are economic policies that cannot be tested by RCTs (though their impact is not outside the realm of empirical investigation, see Appendix 2.2). These would include things like:
Infrastructure spending
Economic liberalisation (Hong Kong, China)
Trade liberalisation (India)
Export-led development and state protection of industry (South Korea, China)
As Pritchett writes:
“… [Development] is fundamentally a process of social transformation—markets (and their supporting institutions and organizations (e.g. firms)) are social mechanisms that structure how people cooperate, governments (and their supporting institutions (e.g. agencies)) are social mechanisms. This social process of national development reliably produces higher human well-being in every dimension. However, no one can reliably and rigorously demonstrate exactly which actions best promote development (as, almost certainly they are contextual and complex) and certainly no one can reliably attribute development to specific organizations (and doing so may, in and of itself, cause less effectiveness).”[17]
This should lead us to be sceptical about RD. Growth is arguably the major driver of human progress, but proponents of RD rarely argue that the interventions that they recommend do increase growth.
Excursus on kinky poverty lines
RD might look like a plausibly effective way to reduce poverty, because of ‘kinky poverty lines’[18] — which define “extreme poverty” as living on less than $1.90 per day, and then do not measure progress above that level. On this poverty line, directly funding RCT-backed aid could ‘pull people out of poverty’. Globally, around $180bn is spent on aid per year—roughly $500 million per day. There are 500 million people who are extremely poor. Assuming that all the extreme poor have $1 per day already, we could eradicate extreme poverty through cash transfers.
But this would raise their income by around $1 per day. And someone on $2 per day is still very poor even if they are above the kinky $1.90 threshold. Indeed, this poverty line is discriminatory and would never be used for citizens in a high-income country: in the US, the poverty line is $17 per day.[19] There is no reason that such thresholds should not apply to people outside high-income countries. On this more expansive definition of poverty, it is very difficult for direct funding of programmatic aid to lift people out of poverty.
Indeed, median income, rather than direct anti-poverty programmes at a given level of income, predicts nearly all of the observed variation in poverty, at any poverty line:
Source: Pritchett, ‘Randomizing development: Method or madness?’ (2019)
Direct anti-poverty programmes usually favoured by proponents of RD, such as cash transfers, microfinance, or the graduation approach, aim to raise the income of the poor at a given level of national median income. However, differences across the country/years in the impact of these targeted poverty programmes conditional on the median account for at the very most 1.2 percent of the total cross-national variation in poverty rates.[20] This suggests that identifying the best direct anti-poverty programmes currently being implemented and scaling them up can at most have very limited low-bar poverty reduction benefits, unless these can be shown to increase national median income per head. There is no reason to think that many current RD programmes, such as cash transfers or the graduation approach, increase national median income.
(This is not to say that decreasing inequality is not important: as we saw above, inequality can have large effects on a country’s welfare per person.)
3.2. The success of the development era
The story of human welfare is well illustrated by this graph:
Until 1800, average human welfare was stagnant, but after the Industrial Revolution, living standards exploded. This preceded most development economics. However, the end of the Second World War marked the start of what Pritchett calls the ‘development era’ with:
The end of colonisation with the liberation of India, Pakistan and Indonesia
The founding of the Bretton Woods institutions—the IMF and the World Bank
Truman’s Four Point plan to provide technical assistance to developing countries
Overall a concerted effort by economists and sovereign states to increase development[21]
The development era was a huge success: since 1950, human welfare has improved on all objective measures by more than all prior human history combined.[22] On the chart below, countries can move vertically up from the diagonal line (meaning that they had positive growth), or vertically down from the diagonal line (meaning that they had negative growth).
It is important to note that the development era was not all plain sailing and that there have been some major growth decelerations, as we discuss below. Nevertheless, the net effect of the era has been overwhelmingly positive.
If things are going so well, why would we start working on a completely different form of development economics? It seems like the best course would be to broaden and accelerate this process globally, and replicate previous successes. Moreover, the failures that do exist seem to make the case for improving our knowledge of growth and the likelihood of policy success. (We discuss this in more detail below).
RD has moved in an entirely different direction. Instead of replicating this success, it asks: among interventions that we can test with RCTs, what is most impactful? In the wake of the period with by far the greatest progress in human welfare of all time, this change in strategy is difficult to justify.
As a way to guide the comparison with RD, it is interesting to compare this progress with the estimated effect of deworming. Of GiveWell’s top charities, Deworm the World is estimated to offer the most cost-effective way to improve economic outcomes for the very poor. But given the story above, it would be very surprising if this was the case: differences in rates of deworming explain a miniscule fraction of the variation in individual economic outcomes across the world. No-one argues that deworming is among the top 1000 causes of the huge economic transformation documented above.
Moreover, given that GiveWell estimates that deworming has similar impact on welfare (broadly conceived) to their other top charities, this should lead us to question whether their other top charities are the best way to increase human welfare, broadly conceived.
4. Cost-effectiveness analysis: RD vs. Growth
Though growth is a major determinant of human welfare today, it does not follow that research and advocacy for growth and national development are more cost-effective than RD interventions. While the payoff might be large, the probability of influencing policy, or the probability that you know better than policymakers, might be low enough to make the expected value of such work lower than RD.
Pritchett has a convincing response to this argument. He compares a popular form of RD, the Graduation approach, with research on and advocacy for growth.
The Graduation Approach
The Ultra Poor Graduation program gets people out of extreme poverty via livelihood training, productive asset transfers, consumption support, savings plans, and healthcare. It is one of the most well-tested and impactful direct anti-poverty programs. (Founders Pledge research suggests that Bandhan, a charity carrying out the Graduation approach, is 5x a cost-effective as cash. GiveWell estimates that Malaria Consortium is 15.8 times as cost-effective as cash. Thus, it seems fair to roughly assume that Malaria Consortium is around 3 times more cost-effective than the Graduation approach.)
A range of RCTs in different contexts have shown that the Graduation approach raised year 3 incomes in 5 out of 6 study sites. The study suggests that the intervention on average produces a 1.6x return in net present value.[23] Thus, $1000 invested in the intervention would produce $1,600 in net present value. There are around 100 million people in Ethiopia, so $1 billion invested in the graduation approach there would increase per capita income by $16.
Compare this to the per-person value of growth accelerations and decelerations documented by Pritchett et al (2016). These are defined as the change in output per capita resulting from one structural break in the trend growth of output to the next. These acceleration or deceleration typically range from 10 to 30 years. The per person benefits (costs) of these growth accelerations (decelerations) are orders of magnitude greater than the impact of the Graduation programme:[24]
Many of the largest growth accelerations produce total benefits in the hundreds of billions of dollars in net present value.[25] The costs of growth decelerations are similarly vast.[26] The top 20 growth accelerations and decelerations have a Net Present Value of $30 trillion and minus $35 trillion.[27] (It should be noted that the later stages of the growth accelerations affect progressively richer people, so produce less utility from additional consumption.)
Thus, the benefits of growth are huge. And, as we shall now argue, the probability that economics can affect growth is also large enough to make the expected benefits of growth-friendly research and advocacy much larger than directly funding RD. There are a few ways to get purchase on this intuition.
All economists
The American Economics Association has 20,000 members. Assume there are twice as many economists globally costing around $150,000 each – at a total of $6bn. Suppose this was constant for 50 years and hence it cost $300bn to sustain the modern economics profession from 1960 to 2010. To be better than the graduation approach, the economics profession would need to have produced expected benefits in excess of ($300bn*1.6) = $480bn in NPV.
China’s growth acceleration from 1977 onwards produced $14 trillion NPV in cumulative economic output. Thus, if the only thing the economics profession achieved in 50 years was to increase by 4 percentage points the probability that the Chinese government shifted to this new economic strategy, then it would have had greater economic benefits than the Graduation approach.[28] It is implausible that the economics profession had an influence this small, and there is in fact a lot of evidence for substantial development economics influence on Chinese economic thinking at this time.[29] From the blurb of a recent book Unlikely Partners:
“When Mao Zedong died in 1976, his successors seized the opportunity to reassess the wisdom of China’s rigid commitment to Marxist doctrine. With Deng Xiaoping’s blessing, China’s economic gurus scoured the globe for fresh ideas that would put China on the path to domestic prosperity and ultimately global economic power. Leading foreign economists accepted invitations to visit China to share their expertise, while Chinese delegations traveled to the United States, Hungary, Great Britain, West Germany, Brazil, and other countries to examine new ideas. Chinese economists partnered with an array of brilliant thinkers, including Nobel Prize winners, World Bank officials, battle-scarred veterans of Eastern Europe’s economic struggles, and blunt-speaking free-market fundamentalists.”
Moreover, this does not count the influence the profession had over all of the other growth accelerations and avoided decelerations. There is clear evidence of the influence of development economics on growth accelerations in India, Taiwan, Indonesia, Vietnam and other countries (see Appendix 2.2). We believe that on a realistic assessment of the evidence on the impact of development economics, the average cost-effectiveness of standard development economics is orders of magnitude better than RD. It remains to be seen whether growth-friendly development is more cost-effective on the margin. That depends on what funding opportunities are available within the cause of advocacy for growth-friendly economic policies.
The World Bank
The World Bank’s expenditure on all of development economics in 2016 was about $50 million. To be better than the Graduation approach, this would have to have produced expected benefits greater than (1.6 * $50 million =) $80 million. The 2002 Indian growth acceleration was worth $2.5 trillion. Even if the only thing the World Bank achieved was to increase the probability of this occurring by 0.003%, then it would be better than the Graduation Approach.
The IMF
The total annual budget of the IMF is around $1.2 billion. If the IMF existed at that budget for 50 years at a cost of $60 billion cumulatively and even if all it ever did was have a 7% chance of averting a single $1 trillion crisis, then it would be better than the Graduation approach.
Philanthropic impact
Pritchett argues that philanthropists, and not just international institutions, have in the past helped to increase growth in low-income countries. For example, due to economic liberalisation causing growth accelerations in 1991 and 2002, India created an additional $3.6 trillion in GDP, relative to its “business as usual” growth trajectory.[30]
Pritchett argues that Ford Foundation funding of the Indian Council for Research on International Economic Relations (ICRIER) was integral in this growth episode:
“There is a narrative in which Ford Foundation, a global philanthropy, provides some millions of dollars of funding that play some role in creating a think tank [ICRIER] that itself then plays some role in providing the conditions in which good policy choices are made that then results in the creation of $3.6 trillion in additional output of Indians.” [31]
Pritchett asks us to suppose that the Ford Foundation gave ICRIER $36m.
“Optimistically, suppose this gift increased by 50 percent the chance ICRIER was created and became an effective think tank (perhaps other funding could have come along, perhaps not) and suppose the existence and actions of this think tank increased by 10 percent the odds India adopted growth accelerating policies (my read of the situation is that it was higher). Then the expected value of Ford Foundation’s 36 million of support was 180 billion dollars (bracketing discounting), a 5000-fold return per dollar of investment.
Pessimistically, suppose the Ford Foundation funding only increased the likelihood of an effective think tank by 10 percent (someone else almost certainly would have funded it) and the impact of ICRIER on the likelihood of a growth accelerating policy outcome was only 1 percent, the investment still returns 100-fold—3.6 billion on 36 million.
Suppose instead the Ford Foundation had given 36 million in what many regard as the highest return individualized investment: girl’s education. There are hundreds of studies showing a positive return both to wages and to other outcomes—fertility, child survival, empowerment, etc. Let’s suppose, super optimistically, the return on this investment was 20 percent. This means an additional 7.2 million dollars.”[32]
Spreadsheet model
Below we have a spreadsheet model comparing the relative effectiveness of direct funding of RD with a hypothetical growth intervention using some of the parameters from above.
Note that the model’s assumptions are based on figures from other sources. As such, this model aims to highlight and disentangle the debate about the relative effectiveness of the randomista approach in the literature.
The case for Growth:
Here, the Graduation approach has a 1.7x ROI. Ethiopia’s population is around 100 million. $1bn spent on the Graduation program would increase the GDP/capita by $17 and the overall return would be $1.7bn.
Pritchett compares this to spending $36m on research and advocacy increases the probability by 50% that a think tank is created. He assigns 10% probability that the think tank then affected India’s 1993 and 2002 growth episodes (3,572 billion or roughly 3.6 trillion). This would create $178.58bn in benefits and be 2918x as cost-effective as the Graduation approach.
The case for Randomista development:
In contrast to the case above, we find that the randomista approach is on a similar order of effectiveness as our hypothetical growth intervention, if we make the following assumptions:
We use Pritchett’s pessimistic numbers where $36m on research and advocacy only increases the probability by 10% that a think tank is created by 1% that the think tank affects policy
We use only the median growth episode in Pritchett’s sample (which is Vietnam, 1989, corresponding to an increase of $6,914 GDP per capita) to be affected by a think tank
We compare this to Malaria Consortium, which is 15.8x more cost-effective than the cash-transfers[33] and 3x as effective as the graduation approach[34]
5. Possible responses
5.1 Extreme scepticism about growth economics
One counterargument to this is to appeal to extreme scepticism about growth economics, specifically the claim that we know which economic policies can spur growth in the future. For example, Chris Blattman, a prominent randomista argues that “[the argument that advocacy for economic growth] has to be made partly on faith, because it is very, very difficult to connect the salary of a growth economist to somebody’s life being better off in 40 years.”[35] Banerjee and Duflo make a similar argument in ‘How Poverty Ends’ in Foreign Affairs essentially arguing that we know very little about how to increase growth.
The first thing to say about this argument is that evaluating it should be the focus of significant research attention from effective altruists working to reduce global poverty. Within EA funding alone, there is >$150m per year at stake in the choice between advocacy for growth and RD. If the case against growth relies on such a controversial claim, then assessing that claim should be a top priority in EA. In spite of this, to our knowledge, this question has received no publicly published attention from the EA community.
There are some arguments for the extreme sceptic position. The Industrial Revolution in England happened before the vast majority of development economics, and the cause of the Industrial Revolution is still a subject of active debate in the field.[36] However, as we have argued above, the ‘development era’ had started by 1950.
The extreme sceptic view outlined above implies that though in the last 70 years, we have witnessed more economic development than all prior human history combined, the deliberate and prominent efforts of economists had no effect on this happening. This is prima facie implausible. It is worth here quoting Pritchett at length:
“This argument is at odds with commonly accepted interpretations of events in a number of countries. One, there are a number of countries (e.g. China, India, Vietnam, Indonesia) that said (1) “Based on our reading of the existing evidence (including from economists) we are going to shift from policy stance X to policy stance Y in order to accelerate growth”, (2) these countries did in fact shift from policy stance X to Y and (3) the countries did in fact have a large (to massive) accelerations of growth relative to [business as usual] as measured by standard methods (Pritchett et al 2016).
One had to be particularly stubborn and clever to make the argument: “Politicians changed policies to promote growth based on evidence and then there was growth but (a) this was just dumb luck, the policy shift did not actually cause the shift in growth something else did or (b) (more subtly) the adopted policies did work but that was just dumb luck as there was not enough evidence the policies would work for this to count as a win for ‘evidence’ changing policy.”
There are also a fairly large number of countries that did the opposite. Economists (from their country and others) have said to the leadership of countries: (1) “If you persist in policy stance X you are going to experience large (to massive) negative consequences for economic growth,” (2) the leaders have not listened, and (3) there have been precisely the predicted negative consequences. The Venezuelan economy is not in 2018 spiraling into hyperinflation and in the midst of a tragic economic depression because “economists have little useful to say about economic growth” in the sense the advice, if followed, would be useful. If the argument is that research can learn reliable advice but this doesn’t mean it will change the course of events, then the question is whether it never changes the course of events. There are also cases in which governments have said “based on what economists say we are going to switch paths to avoid massive downturns/hyperinflation”, have done so, and it has worked (in the sense at least that a crisis did not happen). While the “growth accelerations” might have been hard to predict with standard policies (Hausmann, Pritchett, Rodrik 2005) there is empirical evidence that “growth collapses” are rather more predictable (Breuer and McDermott 2013).
This is not to say that all research based claims about policies for growth have been right. The “lost decades” in Latin America and the “transition depression” in some (not all) former Soviet dominated countries are both examples of adopting policies for growth based on recommendations that seemed not to work. However, as a paper in this volume points out, among the top ten most prescribed medicines many work on only a third of the patients. So because a recommendation is not universally successful does not mean it is not a good recommendation. If I can give you a tip that increases your odds of winning a million dollar lottery by 10 percent, it is massively worthwhile. More recent reviews suggest the “pox on all the houses of growth research” stance and a view recommendations had been worthless are too extreme (e.g. Easterly 2018 on the “Washington Consensus”, Irwin 2019 on trade).”[37]
In addition to this, as we have argued above, there is clear evidence that growth economics had an effect on Chinese economic policy, and this alone probably makes growth economics more cost-effective than the best that RD could do. We of course cannot settle the debate on the overall effect that growth economics has had here. However, as we have said, assessing its truth should be a top priority for proponents of RD and the EA community.
5.2. Economic growth and risk of harm
One other criticism of advocacy for growth is that it involves substantial risk of harm. Economists were involved in some of the growth decelerations that we have seen since the Second World War. The risk of harm is indeed a downside of advocacy for growth against RD.
Several things may be said in response to this. Firstly, this in effect concedes the argument against the extreme scepticism outlined above that development economics does influence national policy, and is therefore potentially high leverage. One cannot both claim that advocacy for growth-friendly economic policies has no effect on policy or on growth and also that it involves unacceptable risk of harm.
Secondly, RD also involves the risk of harm. For example, there was recently controversy about whether GiveDirectly’s cash transfer programme in the past imposed harm on non-recipients.[38]
Thirdly, the historical record since 1950 suggests that the net expected gains from advocacy for growth have been very large, even if they have sometimes involved harm.
One could respond that we ought to avoid interventions risking substantial harm, even if the expected value of the intervention is higher than all others. If this is the ethical assumption underlying RD, then it should be made explicit going forward.
Finally, we are here arguing for high-quality effective research on how to encourage growth, and advocacy for that research. If such research could prevent harm being done by international institutions or others, then there is good reason to think, per the cost-effectiveness argument above, that doing such research would be better than RD. Preventing, at reasonable cost, just one error by the IMF or the World Bank would have expected benefits far in excess of RD. Moreover, if harm minimisation is the ethical aim, then research on how to prevent bad growth policy looks highly promising.
Economists have been studying growth, created models of how countries grow, created a field of “growth diagnostics” (which uses historical and quantitative analysis to determine the causes of growth with the view of predicting growth bottlenecks of on a country-by-country basis), and make concrete policy prescriptions to cause growth (or prevent deceleration). Hauke discusses this in Appendix 2.
5.3. Is there anything to fund?
Another counterargument is that there are limited funding opportunities for philanthropists and that the space is already crowded with states and iNGOs, which usually aim to increase growth. Three things may be said in response. Firstly, establishing the truth of this claim should be a top priority for EAs who are focused on reducing global poverty. EAs are now moving more than a hundred million dollars every year in this space, so evaluating a crucial consideration such as this is of paramount importance.
Secondly, it is less clear whether advocacy for growth is crowded relative to its scale, which is the more relevant comparison. The scale of the problem economic growth solves are at least in the tens of trillions of dollars in net present value.
Thirdly, we present several suggestions for the kinds of things that could be funded in Appendix 4. These are not meant to be recommendations, but they do suggest that it is unlikely that careful analysis will find no promising funding opportunities in this space.
5.4. Politicisation
One additional downside of research and advocacy for growth-friendly economic policies is the politicised nature of such work. Direct poverty and health programmes, such as cash transfers or distributing malaria bednets, are fairly uncontroversial. In contrast, advocacy for economic policies like trade liberalisation or opening up economies to markets are highly politicised. Thus, if the EA movement did get involved in funding this sort of work, it would take on additional political risks. This is especially concerning for Western funders working in low- and middle-income countries.
However, it is worth noting that EA funders are already involved in some highly politicised work, such as advocacy for increasing migration and criminal justice reform. Nonetheless, the political risks are a strike against advocacy for growth-friendly economic policies, and need to be considered carefully.
5.5. GDP isn’t everything
We noted at the start of this post that economic growth is not all that we care about from a near-termist human welfare-maximising point of view. Income per head does not account for:
Inequality
Foregone consumption from investment
Leisure time
Social connection
Public goods
etc
To take the example of public goods, some public goods are at best weakly correlated with GDP per capita:
For public good provision, two factors are crucial: the responsiveness of the polity (i.e. how democratic it is) and state capacity. Pritchett has shown that environmental quality correlates well with measures of state capacity and responsiveness of polity.[39] To give another example, measures of personal safety do not correlate strongly with income per head or state responsiveness, but do correlate with state capacity.[40]
Pritchett constructs a broad measure of national development that includes income per head, polity responsiveness and state capacity. National development, thus defined, is extremely strongly correlated with subjective and objective measures of wellbeing.[41] At a given level of national development, a country can only increase welfare modestly, whereas increasing a country’s level of national development can increase welfare substantially.
In sum, while we have focused on GDP here to make the case against RD, growth is not everything: accounting for inequality, leisure time and consumption is crucial, as is accounting for the provision of public goods, which is best ensured by a responsive and capable state. Assessing the best way to improve these things, outside of the constraints of RD, should also be a priority for effective altruists.
6. Conclusion
Economic growth has been a major driver of human progress so far. In spite of this, within global development, EAs have largely ignored the question of how to increase growth. Instead they have instead focused on (promoting) directly funding the best interventions that can be tested by RCTs. There are plausible arguments which suggests that focusing on growth could be substantially more cost-effective than this dominant approach. This question should be the subject of significant attention from EAs working on global health and development. This is a crucial consideration, which could cause a major shift in our view of interventions.[42]
More strongly, we believe that a 4 person-year research effort would find donation opportunities working on growth that are substantially more cost-effective than GiveWell’s top charities.
It is less clear whether advocacy for growth-friendly economic policies is better than more “hits-based” randomista development, such as advocacy for national scale-up of RCT-backed programmes, research into vaccines and antibiotics, or gene drives for malaria. Moreover, as we have said, economic growth is not everything and there may be even larger gains from improving reducing inequality, or improving state responsiveness and state capability. Investigating these questions should be a top priority for near-term human welfare-focused effective altruists.
In any case, we would like to open a discussion on whether, by relaxing constraints on risk and ambiguity aversion, and taking more of a hits-based approach in global development, donors can greatly increase their impact.
7. Further reading
The two most compelling Pritchett papers on this topic are:
‘Alleviating Global Poverty: Labor Mobility, Direct Assistance, and Economic Growth’, Center for Global Development, (2018)
Pritchett on Econtalk podcast [43]
2018 Lecture by Pritchett titled “The Debate about RCTs in Development is over. We won. They lost.”
Easterly, ‘In Search of Reforms for Growth: New Stylized Facts on Policy and Growth Outcomes’, NBER (2019)
Popular book about the importance of economic growth: Tyler Cowen—Stubborn Attachments (audiobook takes <2h at 2x speed)
Contrapoint:
Banerjee and Duflo: Good Economics for Hard Times (especially chapters on trade liberalization and growth)
Banerjee and Duflo, ‘How Poverty Ends’, Foreign Affairs.
Aschenbrenner on Existential Risk and Economic Growth—EA Forum
8. Hauke’s appendices
Hauke has written some appendices to this document, but these do not necessarily represent John’s view.
9. References
[1] However, the hits-based version of RD does raise questions for proponents of RCT-focused development. Advocacy campaigns for evidence-based interventions cannot be tested by RCTs, but few proponents of RCTs would take this to be a reason not to do such campaigns. Why then should evaluability by RCTs be a condition on other interventions?
[2] Which cause is most popular depends on cause categorisation and most surveyed EAs seem to be long-termists in some broad sense. EA Survey 2018 Series: Cause Selection” 18 Jan 2019, EA Survey 2018 Series: Cause Selection. Accessed 29 Oct. 2019.
[3] “Currently, the best giving opportunities we’ve found in this category are recommended by GiveWell”. Open Philanthropy Project ‘Global Health and Development’
[4] Pritchett, “Randomizing Development: Method or Madness?” Accessed 29 Oct. 2019.
[5] These goods have a private good element because their consumption also requires the provision of certain public goods, such as an electricity grid, public safety, transport networks and so on. We discuss public goods in more depth in section 4.5.
[6] Jones and Klenow, ‘Beyond GDP? Welfare across Countries and Time’, American Economic Review 2016, pp. 2426–2457
[7] Jones and Klenow, ‘Beyond GDP? Welfare across Countries and Time’, American Economic Review 2016, p.2427.
[8] Ibid.
[9] Jones and Klenow, ‘Beyond GDP? Welfare across Countries and Time’, American Economic Review 2016, p.2439.
[10] We should in part expect this because the HDI includes GDP per capita. However two things may be said about this. Firstly, GDP per capita is included in the HDI because it is recognised to be a key determinant of human welfare. Secondly, GDP per capita is also correlated with the other weighted components of the HDI—life expectancy, literacy and educational enrolment.
[11] Jones and Klenow, ‘Beyond GDP? Welfare across Countries and Time’, American Economic Review 2016, pp.2427-2428.
[12] This was South Korea’s experience from 1950 to 2010. Data from the Our World in Data Economic Growth entry.
[13] Pritchett, “Randomizing Development: Method or Madness?” Page 7.
[14] Pritchett, “Is your impact evaluation asking questions that matter?”
[15] A recent meta-analysis by Brown University economist David Weil concludes “If improving health leads to growth, this would be a reason, beyond the welfare gain from better health itself, that governments might want to make such investments. However, the evidence for such an effect of health on growth is relatively weak. Cross-country empirical analyses that find large effects for this causal channel tend to have serious identification problems. The few studies that use better identification find small or even negative effects. Theoretical and empirical analyses of the individual causal channels by which health should raise growth find positive effects, but again these tend to be fairly small. Putting the different channels together into a simulation model shows that potential growth effects of better health are only modest, and arrive with a significant delay.” “Health and Economic Growth—CDN.” Health and Economic Growth. Accessed 20 Nov. 2018.
[16] World Bank, Education Quality and Economic Growth (2007).
[17] Pritchett, The Perils of Partial Attribution: Let’s All Play for Team Development
[18] Pritchett, Getting Kinky with Chickens
[19] Pritchett, Getting Kinky with Chickens
[20] Pritchett, “Randomizing Development: Method or Madness?” (2019), page 12.
[21] Pritchett, The Perils of Partial Attribution: Let’s All Play for Team Development
[22] Pritchett, The Perils of Partial Attribution: Let’s All Play for Team Development
[23] Banerjee et al. ‘A multifaceted program causes lasting progress for the very poor: Evidence from six countries’ Science, (2015): table 4 line 11. This is the average of all of the interventions.
[24] Alleviating Global Poverty: Labor Mobility, Direct Assistance, and Economic Growth by Lant Pritchett 25. Note that Pritchett’s estimate of the impact of the Graduation approach is slightly different to ours. We are not sure of how Pritchett arrived at his estimate.
[25] Pritchett, Trillions gained and lost: Estimating the magnitude of growth episodes, p289. Trillions gained and lost: Estimating the magnitude of growth episodes
[26] Pritchett, Trillions gained and lost: Estimating the magnitude of growth episodes, p290. Trillions gained and lost: Estimating the magnitude of growth episodes
[27] Pritchett, trillions, p289. Trillions gained and lost: Estimating the magnitude of growth episodes
[28] 480 billion / 14 trillion = 3.4%
[29] “Western economists and China’s rise—The Economist.” 5 Jan. 2017, Outsiders and the Middle Kingdom—Western economists and China’s rise | Books and arts. Accessed 4 Nov. 2019.
[30] Pritchett, perils of partial, The Perils of Partial Attribution: Let’s All Play for Team Development
[31] “The Perils of Partial Attribution: Let’s All Play for Team Development ….” 26 Oct. 2017, The Perils of Partial Attribution: Let’s All Play for Team Development. Accessed 19 Nov. 2018.
[32] “The Perils of Partial Attribution: Let’s All Play for Team Development ….” 26 Oct. 2017, The Perils of Partial Attribution: Let’s All Play for Team Development. Accessed 19 Nov. 2018.
[33] “2019 GiveWell Cost-Effectiveness Analysis—Google Docs.” 25 Nov. 2019, 2019 GiveWell Cost-Effectiveness Analysis — Version 6 (public). Accessed 15 Jan. 2020.
[34] Recall that Founders Pledge research suggests that Bandhan, a charity carrying out the Graduation approach, is 5x a cost-effective as cash. GiveWell estimates that Malaria Consortium is 15.8 times as cost-effective as cash. Thus, it seems fair to roughly assume that Malaria Consortium is around 3 times more cost-effective than the Graduation approach
[35] “Two views on fighting world poverty—Chris Blattman.” 28 Mar. 2017, Two views on fighting world poverty Accessed 7 Nov. 2019.
[36] Gregory Clark, A Farewell to Alms: A Brief Economic History of the World, Princeton University Press (2009).
[37] Pritchett, ‘Randomizing Development: Method or Madness?’ (2019), p. 23-24.
[38] Berk Özler, ‘Most good you can do. But for whom?’, World Bank Blogs (October 2018)
[39] Pritchett, “Randomizing Development: Method or Madness?” Page 17.
[40] Pritchett, “Randomizing Development: Method or Madness?” Page 17.
[41] Pritchett, “Randomizing Development: Method or Madness?” Page 14.
[42] “Crucial Considerations and Wise Philanthropy—Effective ….” 9 Jul. 2014, Crucial Considerations and Wise Philanthropy. Accessed 6 Nov. 2019.
[43] “Lant Pritchett on Poverty, Growth, and Experiments—Econlib—EconTalk.” 22 May. 2017, Lant Pritchett on Poverty, Growth, and Experiments. Accessed 6 Nov. 2018.
- The case of the missing cause prioritisation research by (16 Aug 2020 0:21 UTC; 311 points)
- Big List of Cause Candidates by (25 Dec 2020 16:34 UTC; 305 points)
- Lessons from my time in Effective Altruism by (15 Jan 2021 21:54 UTC; 292 points)
- Does Economic Growth Meaningfully Improve Well-being? An Optimistic Re-Analysis of Easterlin’s Research: Founders Pledge by (27 Sep 2022 16:28 UTC; 258 points)
- EA Infrastructure Fund’s Plan to Focus on Principles-First EA by (6 Dec 2023 3:24 UTC; 224 points)
- What do we really know about growth in LMICs? (Part 1: sectoral transformation) by (2 Dec 2023 17:04 UTC; 167 points)
- Results from the First Decade Review by (13 May 2022 15:01 UTC; 164 points)
- Can EA leverage an Elon-vs-world-hunger news cycle? by (2 Nov 2021 0:14 UTC; 133 points)
- The case for building more and better epistemic institutions in the effective altruism community by (29 Mar 2020 17:01 UTC; 131 points)
- GDP per capita in 2050 by (6 May 2024 15:14 UTC; 130 points)
- Intervention Report: Charter Cities by (12 Jun 2021 13:54 UTC; 126 points)
- Important Between-Cause Considerations: things every EA should know about by (28 Jan 2021 19:56 UTC; 122 points)
- Economic policy in poor countries by (7 Aug 2021 15:16 UTC; 108 points)
- Visualizing the development gap by (7 Dec 2022 12:57 UTC; 107 points)
- Convergence thesis between longtermism and neartermism by (30 Dec 2021 16:03 UTC; 100 points)
- How to use the Forum by (5 Sep 2018 17:22 UTC; 99 points)
- [edited] Inequality is a (small) problem for EA and economic growth by (8 Aug 2022 9:42 UTC; 99 points)
- Can we drive development at scale? An interim update on economic growth work by (27 Oct 2020 11:14 UTC; 98 points)
- If you value future people, why do you consider near term effects? by (8 Apr 2020 15:21 UTC; 96 points)
- The EA’s guide to Moral Ambition by (3 Jun 2025 9:06 UTC; 92 points)
- CEA Mid-year update (2020) by (11 Aug 2020 10:06 UTC; 86 points)
- EA Forum: Data analysis and deep learning by (12 May 2020 17:39 UTC; 82 points)
- Is Effective Altruism Neocolonial? (an overview of the arguments and counterarguments) by (22 Jul 2025 14:14 UTC; 79 points)
- Hits-based development: funding developing-country economists by (1 Jan 2022 0:28 UTC; 77 points)
- Getting a feel for changes of karma and controversy in the EA Forum over time by (7 Apr 2021 7:49 UTC; 75 points)
- CEA’s 2020 Annual Review by (10 Dec 2020 23:45 UTC; 69 points)
- Effective Charity ≠ Effective Development (Global Health Edition) by (1 Mar 2026 15:37 UTC; 69 points)
- Unpacking Martin Sandbu’s recent(ish) take on EA by (20 Jan 2024 1:16 UTC; 68 points)
- Guide to norms on the Forum by (28 Apr 2022 13:28 UTC; 65 points)
- Effects of anti-aging research on the long-term future by (27 Feb 2020 22:42 UTC; 61 points)
- Tax Havens and the case for Tax Justice by (15 Sep 2020 18:06 UTC; 60 points)
- It’s OK not to go into AI (for students) by (14 Jul 2022 15:16 UTC; 59 points)
- Intro Fellowship as Retreat: Reasons, Retrospective, and Resources by (2 Nov 2022 3:57 UTC; 55 points)
- The ten most-viewed posts of 2020 by (13 Jan 2021 12:21 UTC; 55 points)
- Love seems like a high priority by (19 Jan 2020 0:41 UTC; 55 points)
- Two Big-Picture Critiques of GiveWell’s Approach, and Six Lessons from Their Recent Work (Elie Hassenfeld on The 80,000 Hours Podcast) by (5 Jun 2023 13:51 UTC; 52 points)
- Preface to the sequence on economic growth by (LessWrong; 27 Aug 2020 20:29 UTC; 52 points)
- Has anything in the EA global health sphere changed since the critiques of “randomista development” 1-2 years ago? by (2 Dec 2021 12:14 UTC; 51 points)
- Global Development & Effective Altruism—A Brief Intro by (1 Apr 2022 16:20 UTC; 50 points)
- $1 billion grant to GiveWell: How Might This Change Who Gets Funded? by (25 Jul 2026 7:10 UTC; 48 points)
- EA Updates for January 2020 by (30 Jan 2020 18:38 UTC; 44 points)
- Effective Altruism focused on bednets while a malaria vaccine was stuck for 23 years. The case for Abundance. by (5 May 2026 18:52 UTC; 42 points)
- EA movement building: Should you run an experiment? by (5 Oct 2021 15:42 UTC; 41 points)
- Writing About My Job(s): Research Assistant at World Bank / IMF by (15 Sep 2023 19:44 UTC; 41 points)
- 's comment on Open Philanthropy Shallow Investigation: Civil Conflict Reduction by (13 Apr 2022 13:28 UTC; 39 points)
- 's comment on Some potential lessons from Carrick’s Congressional bid by (18 May 2022 23:12 UTC; 38 points)
- Lant Pritchett’s “smell test”: is your impact evaluation asking questions that matter? by (18 Mar 2020 23:38 UTC; 36 points)
- Impact in Global Development: A Discussion Series by (26 Feb 2025 9:33 UTC; 36 points)
- Rationalist Epistemics and Social Epistemology (Effective Altruist Definitions Sequence) by (11 Aug 2025 20:57 UTC; 34 points)
- 's comment on The Culture of Fear in Effective Altruism Is Much Worse than Commonly Recognized by (7 Feb 2022 1:17 UTC; 34 points)
- doing more good vs. doing the most good possible by (2 Jan 2022 16:27 UTC; 34 points)
- 's comment on Against cash benchmarking for global development RCTs by (21 Mar 2022 11:31 UTC; 33 points)
- 's comment on Flimsy Pet Theories, Enormous Initiatives by (10 Dec 2021 12:02 UTC; 32 points)
- 's comment on The case against “EA cause areas” by (22 Jul 2021 0:51 UTC; 31 points)
- Let’s Fund Living review: 2020 update by (12 Feb 2021 18:49 UTC; 31 points)
- An argument that EA should focus more on climate change by (8 Dec 2020 2:48 UTC; 30 points)
- Analyzing view metrics on the EA Forum by (11 Aug 2021 22:27 UTC; 30 points)
- A Cost-Effectiveness Case for For-Profit Impact: Tarrina Health by (15 Jul 2026 22:36 UTC; 30 points)
- Where should I donate? by (22 Nov 2021 20:56 UTC; 29 points)
- GDP per capita in 2050 by (LessWrong; 6 May 2024 15:14 UTC; 29 points)
- [Cause Exploration Prizes] Economic Growth and State Capacity by (24 Aug 2022 10:47 UTC; 28 points)
- [Job Ad] Help us make this Forum better by (25 Mar 2021 23:23 UTC; 27 points)
- Interpreting the Systemistas-Randomistas debate on development strategy by (29 Mar 2022 16:53 UTC; 27 points)
- EA Infrastructure Fund’s Plan to Focus on Principles-First EA by (LessWrong; 6 Dec 2023 3:24 UTC; 27 points)
- EA Forum Prize: Winners for January 2020 by (2 Mar 2020 12:02 UTC; 26 points)
- What are some (potentially) effective policy advocacy organizations in global health and development? by (28 Apr 2023 15:48 UTC; 24 points)
- The Case for Education by (14 Aug 2020 17:26 UTC; 24 points)
- The Case for Education by (LessWrong; 14 Aug 2020 17:20 UTC; 24 points)
- 's comment on AMA: Rob Mather, founder and CEO of the Against Malaria Foundation by (24 Jan 2020 9:51 UTC; 22 points)
- 's comment on EA capital allocation is an inner ring by (19 Mar 2021 17:15 UTC; 21 points)
- 's comment on AMA: Leah Edgerton, Executive Director of Animal Charity Evaluators by (17 Mar 2020 18:17 UTC; 19 points)
- EA reading list: global development and mental health by (3 Aug 2020 11:53 UTC; 17 points)
- 's comment on How effective is your Altruism? by (6 Jun 2022 13:35 UTC; 17 points)
- Choose 10^x Projects and Execute by (22 Feb 2021 9:14 UTC; 16 points)
- 's comment on EA Survey: Cause Prioritization by (16 May 2024 12:20 UTC; 16 points)
- 's comment on Deference for Bayesians by (17 Feb 2021 14:57 UTC; 15 points)
- 's comment on EA “Worldviews” Need Rethinking by (18 Mar 2024 15:55 UTC; 15 points)
- 's comment on The case for building more and better epistemic institutions in the effective altruism community by (30 Mar 2020 20:04 UTC; 14 points)
- What readings should we include in a “sequence” on global health and development by (1 Apr 2022 14:38 UTC; 13 points)
- 's comment on [Linkpost] Leif Wenar’s The Deaths of Effective Altruism by (29 Mar 2024 8:44 UTC; 13 points)
- Conflict and poverty (or should we tackle poverty in nuclear contexts more?) by (6 Mar 2020 21:59 UTC; 13 points)
- Ruth Levine and Caitlin Tulloch: The good, the bad, and the ugly of evidence-informed decision making in global development by (23 Jul 2020 14:35 UTC; 13 points)
- 's comment on Vox on cash transfers vs “graduation programs” for fighting extreme poverty by (7 Jul 2022 17:14 UTC; 13 points)
- Helping animals or saving human lives in high income countries is arguably better than saving human lives in low income countries? by (21 Mar 2024 9:05 UTC; 12 points)
- 's comment on Does Economic Growth Meaningfully Improve Well-being? An Optimistic Re-Analysis of Easterlin’s Research: Founders Pledge by (1 Oct 2022 2:52 UTC; 12 points)
- 's comment on Announcing a contest: EA Criticism and Red Teaming by (3 Jun 2022 20:00 UTC; 11 points)
- 's comment on Objections to Value-Alignment between Effective Altruists by (16 Jul 2020 10:35 UTC; 11 points)
- 's comment on What do we really know about growth in LMICs? (Part 1: sectoral transformation) by (8 Dec 2023 15:57 UTC; 11 points)
- Rethinking longtermism and global development by (2 Sep 2022 5:28 UTC; 10 points)
- [Podcast] Luke Freeman on Giving What We Can and Community Building by (31 Jan 2021 12:41 UTC; 10 points)
- 's comment on Discussion thread: Animal Welfare vs. Global Health Debate Week by (8 Oct 2024 20:16 UTC; 9 points)
- What value would Open Phil’s Global Health and Wellbeing framework put on economic growth? by (6 Jan 2022 7:43 UTC; 9 points)
- 's comment on Economic Growth—Donation suggestions and ideas by (11 Jan 2024 15:48 UTC; 8 points)
- 's comment on Existential Risk and Economic Growth by (11 Jan 2022 7:38 UTC; 8 points)
- 's comment on Pausing AI vs Degrowth in rich countries by (23 Sep 2023 10:42 UTC; 7 points)
- Where the QALY’s at in political science? by (5 Aug 2020 5:04 UTC; 7 points)
- 's comment on EA in the mainstream media: if you’re not at the table, you’re on the menu by (31 Jul 2022 16:17 UTC; 7 points)
- 's comment on Hauke Hillebrandt’s Quick takes by (7 Dec 2020 16:42 UTC; 7 points)
- 's comment on A Newcomer’s Critique of EA—Underprioritizing Systems Change? by (13 Nov 2022 3:57 UTC; 6 points)
- 's comment on Improving Institutional Decision-Making: a new working group by (28 Dec 2020 13:29 UTC; 6 points)
- 's comment on MichaelStJules’s Quick takes by (27 Mar 2020 4:19 UTC; 6 points)
- Differences in Impact: More to explore by (2 Jan 2021 0:33 UTC; 6 points)
- Hauke Hillebrandt’s Quick takes by (17 Apr 2020 10:13 UTC; 6 points)
- 's comment on Making EA more inclusive, representative, and impactful in Africa by (18 Aug 2023 14:09 UTC; 5 points)
- 's comment on New Focus Area: Abundance and Growth by (13 Mar 2025 1:48 UTC; 5 points)
- Discussion: Deux approches à l’aide internationale—Two approaches to aid by (16 Oct 2023 10:15 UTC; 4 points)
- 's comment on Charter Cities: why they’re exciting & how they might work by (18 Jul 2023 19:45 UTC; 4 points)
- 's comment on Democratizing the workplace as a cause area by (28 Nov 2022 11:19 UTC; 4 points)
- What do people make of growth diagnostics? by (Progress Forum; 23 Jan 2023 18:32 UTC; 4 points)
- 's comment on How to Eradicate Global Extreme Poverty [RA video with fundraiser!] by (LessWrong; 19 Oct 2023 15:20 UTC; 4 points)
- 's comment on Some thoughts on the effectiveness of the Fraunhofer Society by (3 Dec 2021 9:23 UTC; 3 points)
- 's comment on Mo Putera’s Quick takes by (28 Aug 2024 8:55 UTC; 3 points)
- 's comment on Dawn Drescher’s Quick takes by (23 Apr 2020 15:44 UTC; 3 points)
- 's comment on U.S. EAs Should Consider Applying to Join U.S. Diplomacy by (21 May 2022 16:45 UTC; 3 points)
- 's comment on Seeking Ripple Effects by (11 Oct 2024 19:11 UTC; 3 points)
- GDP per capita in 2050 by (Progress Forum; 7 May 2024 19:22 UTC; 3 points)
- 's comment on Prioritizing among the Sustainable Development Goals by (5 Mar 2020 16:17 UTC; 2 points)
- 's comment on AMA: Elie Hassenfeld, co-founder and CEO of GiveWell by (18 Mar 2020 21:37 UTC; 2 points)
- 's comment on Open Letter to Young EAs by (13 Oct 2024 19:41 UTC; 2 points)
- Effectiveness of Malala fund versus Global Health and Development Fund by (1 Oct 2022 2:35 UTC; 2 points)
- 's comment on Critique of OpenPhil’s macroeconomic policy advocacy by (30 Mar 2022 20:07 UTC; 2 points)
- 's comment on The Goldilocks Approach to Doing Good by (7 Jul 2023 20:31 UTC; 2 points)
- 's comment on Democratizing the workplace as a cause area by (27 Nov 2022 11:24 UTC; 2 points)
- 's comment on Valuing lives instrumentally leads to uncomfortable conclusions by (13 Sep 2022 17:48 UTC; 2 points)
- 課題候補のビッグリスト by (20 Aug 2023 14:59 UTC; 2 points)
- 's comment on How to think about an uncertain future: lessons from other sectors & mistakes of longtermist EAs by (6 Sep 2020 19:26 UTC; 2 points)
- 's comment on “Progress” alternative to GiveWell? by (Progress Forum; 3 Dec 2022 19:16 UTC; 2 points)
- 's comment on Africa and Trade: Competition, Rules & Prosperity by (2 Feb 2022 17:23 UTC; 1 point)
I am ridiculously late to the party, and I must confess that I have not read the entire article.
My comment is about what I would expect to happen if EA decided to shift towards encouraging pro-growth policies. What I have to say is perhaps a refining of objection 5.4, politicization. It is how I perceive this would be instantiated. My perceptions are informed by being from a middle-income country (Brazil) and living in another (Chile), while having lived in the developed world (America) to know what it’s like.
The authors correctly acknowledge that this has a “politicized nature”. For the time being, the only way to enact pro-growth policies would be to influence those who hold political power in the target countries.
My concern about this is: people in such countries do not want these policies. They show that by how they think, how they act, how they vote, how they protest. Here in Chile, for example, people have been fighting tooth and nail against the policies that made the country the wealthiest, most educated one in South America, the only OECD member in the subcontinent. The content of the protests is explicitly against the pro-market policies that have prevailed for the last 40 years here. It is likely that an April referendum on a new constitution will pass, and replace the current basic law with another, much less growth-oriented.
It is worth noting that late-development countries where pro-growth policies have been enacted were often authoritarian at the time (South Korea, Taiwan, Chile), or still are (China, Singapore); even democracies like India and Indonesia are not shining beacons of civil liberties. Poor democracies, as a rule, do not consistently choose growth.
The text points out: “However, it is worth noting that EA funders are already involved in some highly politicised work, such as advocacy for increasing migration and criminal justice reform.” This is true, but there is one factor to consider, and I’ll put it in an intended humorous way, hoping that it will not be taken as hostility because there is zero intent of that: you are all a bunch of gringos! Obviously this does not matter to discern whether what you are saying or doing is right or wrong, but there is an exceedingly easy (and wrong) pattern to match against, that will raise objections instantly as soon as EA decides to try to influence our countries towards growth: you will be perceived as greedy gringos trying to exploit us for your own good.
And why do I keep using the second person, when I consider myself as much of an effective altruist as the next person? Because there are not nearly enough of us here to influence policy. I would love to know how to do it, but I find it highly unlikely. Even if we were more numerous, at our current size (just me here in Chile that I know of, about one or two dozen of people with at least a vague attachment to EA ideas in Brazil) we already cannot coordinate politically (I have no idea who most of the others voted for in 2018, and there was no talk of it whatsoever that I recall). And the same pattern I mentioned above can easily be reused to portray us as sellouts.
So, in short, the big question about EA developing the world is, in my opinion, how to make people want it.
You should first find out how to make people (justifiably) trust those policies.
Sometimes I wonder if we’re in some sort of stalemate here. A can say: “economics show that, unless you adopt pro-business policies – e.g., lower your taxes, slash labor and consumer regulations – investors will avoid this country.” And B replies: “social science shows that, unless you adopt redistributive policies – e.g., tax the rich, protect workers and consumers – people won’t support the government.” Of course, that’s even worse when A and B identify themselves as belonging to specific classes—then it’s more a political bargain than a debate on economics. I’d like to know more about how developed countries actually faced this conundrum – as far as I know, very badly: 30 years later, the 80’s neoliberal policies are still the core of debates. But the difference between developed and developing countries regarding social trust (and trust in the government) is truly remarkable; I wonder what’s the direction of causality here.
But should we make people want pro-growth policies? I’m rather sceptic that there is a positive expected outcome from influencing certain politics. In the end, founding a think tank that lobbies in favor of development policies is, in a way, to believe we know better than development country voters themselves what is best for them (assuming we’re talking about functional democracies).
Although that line of argument may be attractive for a few reasons already mentioned on the forum (because people don’t trust institutions, because they lack basic education, because their education is leftist-biased etc), I’d argue that’s a very strong and probably wrong caveat.
Given that growth economics is a controversial subject, for the sake of argument let’s assume that, after thorough research, we could be 80% sure that Party X would be better for GDP growth than Party Y. Are we really sure that voters don’t know what’s best for them with an 80% confidence interval?
Even if that were true, I’m not sure a pro-growth think tank would be the best course of action. Maybe voters were “wrong” because of malfunctioning elections or low voter turnout. In that case, I think it would be best to advocate in favor of better-functioning elections and increasing voter turnout.
In my opinion, if we disagree with voters about what’s best for them, it’s far more likely that we’re wrong. In a sense, that’s also the argument behind providing cash transfers—should be oblige people to spend money on what we think is right for them or simply give them the cash and trust they’ll know its best use?
This may be interpreted as a general critique of Politicisation, but I don’t think that applies to some of the other topics the EA community has been involved (animals can’t vote and I would argue this critique doesn’t apply to trade liberalization as well, but this isn’t the forum).
I was with you until the very end, then I got confused. Do you think it is fair to say that people don’t know what’s best for them when it comes to trade liberalization? (I do.)
I have way fewer qualms about saying that voters don’t know what’s best for them. Take, for example, South Africa. They use a pretty darn good voting system—single-ballot closed-list proportional representation with half the seats coming from province-level lists and the other half from nationwide lists—and I think the conduct of the elections themselves is decently well-organized; turnout has been dropping recently, but it was a whopping 89.3% in 1999.
I (cherry-)picked that one election because it brought Thabo Mbeki to the Presidency. He didn’t believe HIV caused AIDS; he thought AIDS is caused by vitamin deficiencies. He oriented the country’s policy based on that belief. Southern Africa is one of the areas with the highest incidence of the disease in the world. So, yeah, in that particular case the 66.5% of South Africans who voted for him clearly did not know what was best for them.
Also, it could be that we know with only 80% confidence what the best policies are, but we know with a much higher certainty that some policies (like subsidizing gas until it costs less than USD 0.05 a liter, like Hugo Chavez did) are completely wrong. Yet people still vote for them.
So yes, I am fairly confident that by and large people here in poor countries do not want growth, or that they do not want to avoid the policies that we know are harmful to growth.
You could point out that I cherry picked that one election, and that is true. But I think that, generally speaking, elections at least here in Latin America are broadly representative of people’s will, or as much as is possible in a presidential system (I think parliamentarianism is stricly better). AFAIK most countries use proportional representation rather than single-member districts, which are a big cause of dysfunctional-ness in e.g. US politics. Basically, we’re not stuck in the same inadequate equilibria as the US is. And turnout in, say, Brazil is pretty high, because voting is mandatory.
So, for democracies here in Latin America, I’d be fairly confident on “people don’t get pro-growth policies because they choose not to” over “people would want pro-growth policies but fail to get them because of poor election methods or low turnout”. (The low turnout hypothesis would also be fishy in that it would suggest a correlation between turning out to vote and being against growth; I’d find that correlation surprising if it existed. If there was any meaningful correlation, I’d expect it to go in the other direction.)
I’m way less confident in African elections. Some countries, like Ghana and South Africa, conduct their elections pretty well, I believe, but that’s probably not the norm in the continent. Most countries have very little experience with democracy (the 1999 election I mentioned was only the second one). Then again, some cultures in Africa have traits like:
the belief that albino body parts are somehow good for disease;
female genital mutilation;
insistence on contact with bodies of Ebola victims.
Things like this, as well as political views that are clearly a majority in the continent (e.g. non-acceptance of homosexuality, which is still illegal in nearly 2⁄3 of African countries) give me substantial confidence that yeah, they don’t know what’s best for their countries.
(I’m not saying should try to make them want growth; what I am saying is that, if the article is right that that’s what EAs should focus on, then we need to keep that in mind.)
Thanks for this, I think you make a lot of good points here that anyone carrying out this research would need to think about carefully.
Chile was ahead of much of South America in 1950, I wouldn’t give credit solely to the last 40 years of policies. Data for Education, Income, Life Expectancy only Cuba was ahead in terms of both Income and Education (by a little bit) every other country was behind including Brazil
I would not put Singapore in the same bucket as China, overall agree that those countries were authoritarian, however plenty of other authoritarian countries did far worse. South Africa is one example. All of those countries in your list had universal basic education before economic growth, was that the driver in improvements in income?
Indonesia had a much more authoritarian history than India. India’s first Prime Minister prioritized industrialization calling dams and heavy industry as temples of modern india. Kerala a state in India (followed by Tamil Nadu later) prioritized basic education and healthcare which formed the Kerala Model and now ranks at the top of Indian state by HDI
They do want it, but first to evaluate “pro-growth” arguments they need basic education.
Lucy, thank you for your comment, even though I disagree with most of it :)
AFAIK, Chile crumbled in the 1970s. Electing Socialist Salvador Allende is an example of what I mean by “choosing anti-growth policies”; the first half of the Pinochet dictatorship didn’t help with growth (and, obviously, was a disaster for human rights).
I agree they’re quite different, but the point is that in both countries the leadership can just outright decide to shift their policies with little in the way of popular resistance.
Yes, I am not claiming that being authoritarian is sufficient, it clearly isn’t. It is not necessary either, but that seems to have helped a whole lot in the cases I mentioned. Even Brazil didn’t have a proper central bank until the 1964 military coup.
Notice that me pointing out authoritarianism helped with pro-growth policies is not in any way an endorsement of these authoritarian regimes.
India’s pre-1990s policies were not pro-growth, they were explicitly socialist. Industrialization per se is not inherently a pro-growth policy; countries need to be mindful of their comparative advantages. Nehru imposed all sorts of weird, distorting subsidies and price controls on things like coal and transportation. It was Manmohan Singh who implemented India’s first pro-growth policies, first as Finance Minister then as Prime Minister.
That depends on the kind of education. The way I see it, subjects that would help would be reading, math, science, economics. Policies that claim for “more education”, in Brazil at least, tend to emphasize a completely different skillset: far leftist-biased history, far leftist-biased geography, far leftist-biased sociology, far leftist-biased philosophy, arts and culture (there’s this perception that “more culture” is some sort of panacea), and “critical thinking”, which is usually code for “opposing pro-growth policies”. So getting more of this type of education in Brazil would be *worse* for growth.
Chile ranks highest in Latin America in the PISA international evaluation, and these most-educated-people completely thrashed their own metro system last year while protesting against fare hikes; a good deal of the stations are still unusable, especially in the poorest parts of Santiago, even 3.5 months after the rampage.
I do agree math & science are really wanting in the 3rd world, that they’re more fundamental for growth, and that we should focus on them. However, I disagree with the diagnosis; I believe the reason students are comparatively worse in hard sciences is, well, that they’re relatively harder—they require training and competence, from students AND teachers. If the problem were that we implemented leftist pro-culture policies, instead of improve hard sciences learning, we should at least observe improvements in some other capabilities—e.g., they should be able to read, interpret, and expose arguments on why, e.g., everything bad was caused by colonialism, patriarchy, etc.
I think we have a more complex inadequate equilibria: bad teachers in unions defending their interests, students from terrible backgrounds, talented people avoiding teaching (if you know calculus, why would you want to try to teach poor kids for a low salary?), and, of course, governments focused on whatever will win votes in the next election.
I do agree that any proposal on changing educational policies will meet a backlash, espacially from humanities, and that it will often carry a leftist taste—but we shouldn’t focus on this backlash, that’s not the cause of illiteracy, nor innumeracy. When we frame the issue as “the problem is that education is dominated by marxist thinking”, we’re just unnecessarily politicising it.
I’m not sure I get what the core of the disagreement is. Perhaps you could try expressing to me what your understanding of my view is, to clarify the comparison with yours? In general I think I agree with most of your comment.
Regarding Chile, Amartya Sen in his book Hunger and Public Action writes about it
https://www.oxfordscholarship.com/view/10.1093/0198283652.001.0001/acprof-9780198283652-chapter-10
https://www.oxfordscholarship.com/view/10.1093/0198283652.001.0001/acprof-9780198283652-chapter-12
life expectancy in Chile is on par with US, my interest about Chile would be more around how they have same life expectancy as US with less money.
Sure you can call them socialist, although I don’t like labels. Under Nehru basic education was neglected, as was basic healthcare. So does the label fit? I don’t want to argue or think about labels, it is just a waste of time. I am for universal basic education, and universal basic healthcare both of which were done better by China than India, or any “developed” country for that matter with their universal free public schooling systems.
Among countries that you gave as examples (South Korea, Taiwan, China, Singapore) had universal basic education provided by the government, I am not sure of Chile. Education is a necessary but not sufficient condition for economic growth.
My point about Nehru and industrialization was that there was a desire for economic growth, whether the right policies were followed is a different question.
It is not just the policies of Singh that made the difference, India had a large number of educated people by the year 1990 (along with enormous illiteracy). India and China opened up 10 years from each other, but India is 20-30 years behind China. This distance is mirrored in the education levels of China vs India, with China being ahead of India pre-1980 by 20-30 years.
Regarding Brazil, it is less educated than Chile or US, and its life expectancy is roughly 4 years behind both countries. Even today 18% of brazil’s kids have 6 years of schooling or less. In Chile that number is less than 2%
Basic Education makes a difference.
I think the outlier there is the US, not Chile.
I’m just going by India’s self-identification.
I don’t know enough to comment on this.
I find this particular label useful because it seems to anticorrelate fairly well with pro-growth policies, especially as long as the system hasn’t obviously failed yet (e.g. even Venezuela is somewhat liberalizing now).
Could I please have a source on China being that good, especially pre-Deng Xiaoping’s reforms? Does “better healthcare” include the several dozen million deaths in the Great Leap Ahead and other assorted atrocities? One has to keep in mind present-day China handpicks its best provinces to take part on PISA so the comparison is not apples to apples. Furthermore, this claim of Chinese citizens being particularly well-educated seems incongruous with the one about education being necessary to critcially evaluate public policy, since I’d expect Chinese education to be a total brainwash in favor of the Party.
Was there such desire? If that is the case, why were the right policies not followed? It is not like late 1940s economists couldn’t predict that Nehru’s policies would have pretty terrible results.
China also opened up more, and the one-child policy gave it a bigger demographic dividend. This by itself might be able to explain the growth difference (especially GDP per capita).
That does not explain the riots here in Chile. In fact, it does sound like you think education is a panacea. What do you think of North Korean education? Cuban? Costa Rican?
The life expectancy of China has consistently gone up since 1960[1] (where the World Bank data starts).
There is a larger change, in absolute terms, from 1960 to 1980 (roughly when the reforms seriously started) than from 1980 to 2017. The increase is from 44.3 in 1960 to 66.4 in 1979, which is much larger than the rest of the world(52.6 to 62.6). To put it in perspective, if you’re an average[2] Chinese person, it means that your life expectancy rose ~ as rapidly as your age for 20 full years, so if the curve continued you’d never die.
Of course, this is partially because the low-hanging fruits are plucked first because they are easier to pluck, but nonetheless it’s substantive evidence that public health before the reforms must have done something right.
[1] https://data.worldbank.org/indicator/SP.DYN.LE00.IN?locations=CN
[2] Somewhat misleading to use the average since some of the advances came from infant mortality, but still.
Thanks Linch. You are right.
Amartya Sen compared China and India 30 years ago in his book Hunger and Public Action, it is worth reading today after all these years.
https://www.oxfordscholarship.com/view/10.1093/0198283652.001.0001/acprof-9780198283652-chapter-11
I enjoyed reading Development as Freedom by Sen in undergrad. It was an interesting read for me to get an understanding of non-consequentialist approaches to development, though I still think he underestimated the value of flow-through effects from GDP/scientific progress.
I consider Hunger and Public Action as one of Sen’s best books, it is available as open access online here
Thank you, Linch. My question was more focused on the education part than the health part, although I agree I should have made that clearer. The information you provided is still good to know, though—and impressive indeed.
On a meta-level, in general I think your conversation with lucy is overly acrimonious, and it would be helpful to identify clear cruxes, have more of a scout’s mindset, etc.
My read of the situation is that you (and other EAs upvoting or downvoting content) have better global priors, but lucy has more domain knowledge in the specific areas they chose to talk about.
I do understand that it’s very frustrating for you to be in a developing country and constantly see people vote against their economic best interests, so I understand a need to vent, especially in a “safe space” of a pro-growth forum like this one.
However, lucy likely also feels frustrated about saying what they believe to be true things (or at least well-established beliefs in the field) and getting what they may perceive to be unjustifiably attacked by people who have different politics or epistemic worldviews.
My personal suggestion is to have a stronger “collaborative truth-seeking attitude” and engage more respectfully, though I understand if either you or lucy aren’t up for it, and would rather tap out.
Thank you for your admonition, Linch. I’d point out I wouldn’t like to be grouped together with people up- or downvoting lucy; I haven’t voted on their comments except but one each way. As for the actual content of the conversation, this is not how I wanted it to be perceived; I wonder if you could help me identify what went wrong at a more detailed level, in private. I know about identifying clear cruxes and having a scout’s mindset, I endorse collaborative truth-seeking, yet here I failed to implement these things and it is not clear to me why; I could use help with that.
(I talked more with brunoparga over PM).
For onlookers, I want to say I really appreciate bruno’s top-level comment and that I have a lot of respect for bruno’s contributions, both here and elsewhere. The comment I made two levels up was probably stronger than warranted and I really appreciate bruno taking it in stride, etc.
Great comment—strong upvote! :)
Apologies for the delayed response. I was surprised at not finding a single source (after several minutes of searching) that plotted literacy rates across time, however:
http://schugurensky.faculty.asu.edu/moments/1949china.html
https://www.statista.com/statistics/271336/literacy-in-china/
At least naively, this suggests a ~60% absolute change in literacy rates from 1949-~1980, which is higher than in the next 40 years (since you cannot go above 100%).
I think the change here actually understates the impact of the first 30 years, since there’s an obvious delay between the implementation of a schooling system and the adult literacy rate (plus at least naively, we would expect the Cultural Revolution to have wiped out some of the progress).
One thing to flag with cobbling sources together is that there’s a risk of using different (implicit or explicit) operationalizations, so the exact number can’t be relied upon as much.
However, I think it’s significantly more likely than not that under most reasonable operationalizations of adult literacy, the first 30 years of China under CCP rule was more influential than the next 40.
Thanks Linch, a better indicator than adult literacy is youth literacy.
In China 1950, for kids aged 15-19 21.86% of boys had no education, for girls 49.9% had no education.
By 1980 for kids 15-19 1.32% of boys and 3.88% of girls had no education. This is a dramatic improvement.
the cultural revolution only stalled increase in education beyond 9th grade, so it had very little effect on literacy rates
The nation with highest life expectancy is Japan at 84 years, Chile, USA and every “developed” country is 75+ I would say all of them are on par
Not useful. North Korea is Democratic People’s Republic of Korea, I guess republicans and democrats in USA should be thrilled. China is communist etc.. British were bringing civilization to the world etc...
Ouch. My mistake. I should have written clearer. China outshined India in both education and healthcare. Given its history pre-independence it did very well in terms of health and education w.r.t. to “developed” countries. It did not cross rich nations, but did MUCH better than expected for a poor country. My observation was simply that “developed” countries had free public schooling (socialist schooling)
Yes I am fully aware of China. I will simply quote Sen
a really sad thought for 2 reasons. very few people know about the tragedy in India. Secondly the deaths are continuing today preventable deaths are around 4 million a year worldwide.
Partly people really had no idea. They thought Import substitution industrialization was the answer. Secondly after capitalist Britain ruled (and ruined India) for 200 years would any country want to follow the system of Britain? Which economists should be followed? British ones? How about Dr. Ambedkar’s policies? he is an economist.
One child policy had no effect on China’s population size. It was their widespread education pre-1979 than reduced fertility.
The riots are a non-issue in the big scheme of things. Yes education is the fundamental factor for human well being. I have no idea about north korean education, cuban is very ideological I assume, no idea about Costa Rica, I assume it is similar to say Mexico.
Anyway it’s not what is taught in school that is important. It is the quantum jump that comes with being able to read, write, reason, interpret, understand the world that is important. As compared to a totally illiterate person.
If pretty much all developed countries have a similar life expectancy (apart from Japan), and the USA is quite significantly richer, than yes, it is the US that’s the outlier, not Chile.
I was going by India’s *socialist* self-identification. There’s reason to dispute e.g. North Korea’s democratic credentials. India said it was socialist, Venezuela still does (China appends the “with Chinese characteristics” euphemism/tautology, of course), Denmark doesn’t. I think it is reasonable to follow *that* self-identification, because I think the only people who would dispute that, say, Venezuela deserves the label are socialists who are sour about their ideology collapsing yet another country, and that is just not reasonable.
I dispute that equivalence.
The best ones.
I would like an *excellent* source on that claim.
If changing the Constitution is a non-issue, what counts as an issue to you?
What exactly do you *mean* by education here?
That much more than Chinese one? Or is it okay for it to be ideological?
As far as I know, it is excellent… yet the country is still poor.
Is your claim that, regardless of what is taught in school, as long as someone is not illiterate, they can adequately assess which policies are more conducive to growth and which ones are bad? Is this what you’re saying?
regarding one child policy of china
Feng, Wang; Yong, Cai; Gu, Baochang (2012). “Population, Policy, and Politics: How Will History Judge China’s One-Child Policy?” (PDF). Population and Development Review. 38: 115–29. doi:10.1111/j.1728-4457.2013.00555.x.
Whyte, Martin K.; Wang, Feng; Cai, Yong (2015). “Challenging Myths about China’s One-Child Policy” (PDF). The China Journal.
+ read demographic research from http://www.wittgensteincentre.org/en/index.htm
I actually took the time to look at those two sources, and as far as I can tell they provide no support whatsoever for your claim that “It was [China’s] widespread education pre-1979 that reduced fertility.” The word ‘education’ occurs exactly once in the first article, and in a sentence that doesn’t make any claims about education reducing fertility. As for the second article, to the extent that it attributes the fertility decline to anything, it attributes it not to “education”, but to economic development (pp. 158-159):
From “Challenging Myths about China’s One-Child Policy”
There were two separate claims that I made
1) One child policy had no effect on China’s total population
Yong Cai is the best researcher on this question. He clearly says one-child policy had little impact of China’s total population. Amartya Sen discusses this issue, and comes to similar conclusion.
2) Regarding effects of education of fertility.
Yong Cai is not the expert I would consult.
Income, education, urbanization all correlate with declining fertility, and he points that out clearly.
It is well known in the human development community that in 1979 pre-reform China had much better health, education, fertility indicators than would be expected given its level of income. The question is why? The answers lie in their social policies at that time (under Mao), where an emphasis was given to basic education and basic healthcare (with barefoot doctors 1 2)
I like Amartya Sen’s discussion on China best
Its interesting to note that I got downvoted for giving excellent sources. While you got upvoted for reading the articles and commenting. Basically I am outgroup/outcaste in EA.
Moving on.
I have read extensively on the topic of demographic change. Let me start with context it was asserted that
“China …. one-child policy gave it a bigger demographic dividend.”
I replied that one child policy had no effect on China’s population. My sources were Yong Cai et all, Amartya Sen has extensively commented on demographics and in his books explicitly compares Kerala, Tamil Nadu, China etc… and does not find differences in demographic trajectories of those places.
One child policy had no effect on China’s total population.
Regarding education and fertility, Yong Cai says socioeconomic development played a role in his paper “China’s Below-Replacement Fertility: Government Policy or Socioeconomic Development?”
He concludes
Yong Cai is a specialist demographer focused on China, and not on the link between education and fertility. The best research on the link between education and fertility comes from Wolfgang Lutz and his coauthors. Amartya Sen is worth reading too.
Is the Demographic Dividend an Education Dividend?
I’m not sure I’m the right person to comment on this, given that I’m one of the parties involved, but I’ll provide my perspective here anyway in case it is of any help or interest.
I don’t think you are characterizing this exchange or the reasons behind the pattern of votes accurately. Bruno asked you to provide a source in support of the following claim, which you made four comments above:
In response to that request, you provided two sources. I looked at them and found that both failed to support the assertion that “It was [China’s] widespread education pre-1979 than reduced fertility”, and that one directly contradicted it.
I didn’t downvote your comment, but I don’t think it’s unreasonable to expect some people to downvote it in light of this revelation. In fact, on reflection I’m inclined to favor a norm of downvoting comments that incorrectly claim that a scholarly source supports some proposition, since such a norm would incentivize epistemic hygiene and reduce the incidence of information cascades. I do agree with you that ingroup/outgroup dynamics sometimes explain observed behavior in the EA community, but I don’t think this is one of those cases. As one datapoint confirming this, consider that a month or two ago, when I pointed out that someone had mischaracterized the main theses of a paper, that person’s comment was heavily downvoted, despite this user being a regular commenter and not someone (I think) generally perceived to be an “outsider”.
Moving to the object-level, in your recent comment you appear to have modified your original contention. Whereas before your stated that “widespread education” was the factor explaining China’s reduced fertility, now you state that education was one factor among many. Although this difference may seem minor, in the present context it is crucial, because both in comments to this post and elsewhere in the Forum you have argued that EAs should prioritize education over growth. Yet if both of these factors account for the fertility reduction in China, your position cannot derive any support from this Chinese experience.
Regarding voting. I have consistently been “controversial” when I have positive karma on a comment, I can see both +ve and -ve votes. While a few are not voted, and a lot of my comments get voted down.
You have 200 comments with 2000+ karma, I have 100 comments with 25 karma.
This is a pattern I see consistently.
I pointed out the context in which I made my comment.
From reading Yong Cai and Amartya Sen etc.. its clear that one child policy had no effect on China’s population. First let’s agree on those facts.
Regarding education and fertility. I gave you a third paper by Yong Cai in which he acknowledges that education plays a role. Yong Cai is a China specialist not an expert on fertility and demography. As a scholar he reflects the thinking of his peers, and is cautious.
Wolfgang Lutz and others from IIASA and Wittgenstein center for demography research link between fertility and education. They are very clear that there is a strong link.
I didn’t restate my position. I only quoted Yong Cai, it does not mean I agree completely with him.
I said as much when I wrote
You have to appreciate that this takes a lot of time, and a mental toll. If I dont give all my sources, it is because I have pondered this question for years and have read quite a few papers and books. I am not an academic to keep track and source everything.
lucy, given Linch’s admonition elsethread, I am taking a break from engaging with the content you present. I am not sure how best to phrase this, but I just wanted to say I empathize with your perception of being viewed as an outgroup/outcaste. I think that must feel quite bad. In spite of so far not agreeing a lot, I don’t want to contribute to you feeling that way, quite the contrary; I want everyone to feel welcomed here and in all EA spaces, and I apologize if my actions unwittingly had the opposite effect.
hey brunoparga, it is not one interaction that I find problematic. i am happy to be voted down when people respond back. it is those downvotes without a response that troubles me.
i like to interact and try to see others point of view, so its totally ok if you d’ont agree with me, say so, and explain your reasons. we may not agree at the end, but atleast we can try to understand each other.
I agree with your concerns. It’s hard enough as an American citizen to fix America’s broken immigration citizen, and like you said, it would be harder still to lobby these foreign countries for exactly the kinds of pro-growth policies that they are distancing themselves from. I’m half-Taiwanese, but I can barely speak Mandarin and have 1% of the cultural context I’d need to be an effective political advocate there.
But there’s a lot we can do from the vantage point of rich countries to benefit citizens of poor countries, like lobbying for more immigration. In terms of benefits to the global poor, open borders would probably trump any policy that developing countries could enact on their own. And it’s probably more tractable if we focus on the countries whose political climates already favor immigration.
Here’s a central argument against focusing on growth per se that I find fairly plausible:
Obviously terrible growth-related policies are at historic lows. Our ability to produce more detailed/refined policy prescriptions is weak (see Pritchett’s acknowledgement of the lost decades and the transition depression). In fact, many of the greatest successes of development (China, Singapore, etc.) defied the economic orthodoxy in the details. Rather, they implemented policies that were tailored to and required deep understanding of local conditions. The key barrier to increased economic growth is not the absence of knowledge or advocacy but mundane implementation issues and the indifference or antipathy of the relevant political actors.
Thanks (strongly upvoted for trying to falsify a central claim). All opinions are mine.
1. While the interesting paper you cite shows that policies bad for growth are at historic lows and argues that much progress has been made, 20% of all countries still have bad policies, and 25% of SSA countries. Given the potential very high effectiveness of growth policy, that we tried to demonstrate in the piece, the value of information of looking into this further is high.
2. I do cite Rodrik in the Appendix who argues that these days, “standard prescriptions” (i.e. Washington Consensus) might not work any longer and we should be skeptical of top-down, comprehensive, universal solutions (though perhaps there are some more generalizable policy prescriptions to be discovered with further research—Rodrik for instance expands the Washington consensus with an additional 10 policy prescriptions).
However, technical assistance by more specialized agencies (e.g. DFID, USAID, GIZ as well as the World Bank’s country offices), and also NGOs such as the International Growth Center, the Copenhagen Consensus, etc. might be able to do “growth diagnostics” to find out where growth is bottlenecked and then help with tailor-made policies on a country-by-country basis.
They might also help with implementation issues, and even indifference issues.
A close thing I’ve seen to the “growth diagnostics” you describe is the country strategies & likely growth products sections of the Atlas of Economic Complexity (https://atlas.cid.harvard.edu/).
Explainers… https://youtu.be/2FeugaLv5Bo
https://youtu.be/5jjKDH6ijrQ
https://youtu.be/KQAarHByMTM
Yup, agree that the argument I outline is not definitive and thoughtful work in this area is worthwhile. I think I may be more pessimistic on the politics aspect (i.e. I may think it’s a more tightly-binding constraint and harder for outsiders to work on), but my sense of that is kind of inchoate and not worth much at the moment.
Wild speculation:
I think one reason this area may get less attention in EA is that if you’re willing to sign up for high-risk high-return scenarios that are more theory-driven and less retrospective-data-driven (like economic growth), you’re also more sympathetic to long-termist areas like x-risk. And once you’re comparing x-risk to economic growth, there’s no guarantee that growth wins.
In other words, I think economic growth may be competing against x-risk—not RCTs—among EAs.
(Though certain ethical views may argue against long-termist interventions like x-risk reduction. A focus on economic growth may be the best fit for people that are “epistemically permissive” but “ethically conservative”, if that makes sense.)
Yes, interesting take.
Aside from risk aversion, in the appendix, I list some more cognitive biases that might be at play for why people prefer RCTs.
Relatedly, perhaps people sympathetic to long-termism might believe that speeding up growth might speed up GCRs from emerging technologies. And while it is unclear when growth will speed up x-risk at all (see for instance), I think that when it comes to differential technological development, not all growth is equal.
What speeds up risks from emerging technologies is mostly growth in highly technical sectors in high-income countries. Growth in low-income countries will not increase world growth much and is less likely to cause risks from emerging technologies.
Put simply: Burundi’s catch-up growth won’t speed up global growth by much, is unlikely to speed up risks from AI or bio any time soon. Growth has been argued to lead to “Greater opportunity, tolerance of diversity, social mobility, commitment to fairness, and dedication to democracy.” Perhaps growth in poor countries will actually increase stability and thus be good from a differential technological development point.
Lower skilled labor also competes with AI R&D and so increasing trade and migration decrease AI R&D (see “Why Are [Silicon Valley] Geniuses Destroying Jobs in Uganda?”.
But even if growth in poor countries will slightly increase x-risks, then it might still be optimal to support it and offset the x-risk increase through targeted interventions to decrease x-risks. This is because multiobjective optimization for both x-risk reduction and global poverty is likely harder than single objective optimization for the most effective interventions in each category separately.
If lower-skilled labor reduces AI R&D and therefore slows the pace of AI development, wouldn’t it also reduce the risk of x-risks from AI?
Rather than being wild speculation, I think this is clearly correct. And needs to be mentioned anytime someone criticizes EA for having too much focus on proven interventions instead of things like economic growth.
However there are other causes which can be good under such a moderate epistemic view: growing Effective Altruism, curing aging, fighting climate change, partisan politics, improving foreign policy, etc. All of these have been recognized by some Effective Altruists as important and will compete with economic growth for attention.
This is speculative, but I suspect many of the things you mentioned fall in the category of things that seem pretty impactful, potentially on par with EA’s main cause areas (poverty, animals, x-risk), but it doesn’t seem like it makes sense to devote that much EA manpower or resources to it right now—so a small number of EAs who identify one such area can work on it, and it’s great, (and the EA movement should encourage that, with sufficient justification of the impact), but I can see why the EA movement doesn’t put them as a main cause.
(I don’t necessarily agree with all of the ideas you mentioned as belonging to theses categories, and I probably don’t know enough about them to do so, though I can see many of them being such an area.)
A digression, but I do wonder if people working on these smaller, niche areas with an EA spirit, (assuming they did make the right call on the impact and it’s just an area that can’t absorb a lot of EA resources) feel sidelined or dismissed by the EA movement. (Might be the case for climate for instance.) And I wonder if this were really the case how the EA movement can be better at encouraging such independent thinking and work.
The answer is simply to grow the EA movement so that more causes have adequate numbers of people working on them. Rather worrying about giving people equal slices of the pie.
Would you say that, almost 4 years later, we’ve made progress on that front?
It’s not binary, though. Think of the intermediate micro utility maximization problem: you allocate your budget across goods until marginal utility per dollar is equalized. With diminishing marginal utility, you generally will spread your budget across multiple goods.
Similarly, we should expect to allocate the EA budget across a portfolio of causes. Yes, it’s possible that one cause has the highest MU/$, and that diminishing returns won’t affect anything in the range of our budget (ie, after spending our entire budget on that cause, it still has the highest MU/$), but I see no reason to assume this is the default case.
More here.
The reason to make that assumption is that EA is just a very small component of the global budget and we are typically dealing with large problems, so our funding usually does little to change marginal returns.
In some cases, like AI risk, the problem is “small” (i.e. our small amount of extra funding can meet the main practical requirements for the time being). However, for big economic issues, that doesn’t seem to be the case.
We should disaggregate down to the level of specific funding opportunities. Eg, suppose the top three interventions for hits-based development are {funding think tanks in developing countries, funding academic research, charter cities} with corresponding MU/$ {1000, 200, 100}. Suppose it takes $100M to fully fund developing-country think tanks, after which there’s a large drop in MU/$ (moving to the next intervention, academic research). In this case, despite economic development being a huge problem area, we do see diminishing returns at the intervention level within the range of the EA budget.
I think that kind of spikiness (1000, 200, 100 with big gaps between) isn’t the norm. Often one can proceed to weaker and indirect versions of a top intervention (funding scholarships to expand the talent pipelines for said think-tanks, buying them more Google Ads to publicize their research) with lower marginal utility that smooth out the returns curve, as you do progressively less appealing and more ancillary versions of the 1000-intervention until they start to get down into the 200-intervention range.
Do you think that affects the conclusion about diminishing returns?
Yup, agreed.
That’s very plausible. So, if someone wants EA to focus on growth, they should use different strategies to convince x-riskers that it’s better for the long-term (ex: “read Tyler Cowen”) or welfare/equality EAs that it’s better for low-income people (“read… Tyler Cowen?”).
Someone emailed me this and asked for thoughts, so I thought I’d share some cleaned up reactions here. Full disclosure—I work at Open Phil on some related issues:
Thanks for the post—I think it’s helpful, and I agree that I would like to see the EA community engage more with Lant’s arguments.
If we’re focused primarily on near term human welfare (which seems to be the frame for the post), I think it’s really important to think (and do back of the envelope calculations) more explicitly in terms of utility rather than in terms of absolute dollars. In the post, you allude to the need to adjust for this (“It should be noted that the later stages of the growth accelerations affect progressively richer people, so produce less utility from additional consumption.”), but I think it’s actually first order. In general, I think true humanitarian welfare is distributed much more linearly than exponentially, and that Jones and Klenow’s welfare concept doesn’t map very well to how I think about utility. I don’t have any knock-down arguments here, but I think looking at life satisfaction survey data and lifespan data both suggest the relevant metric is much closer to log(GDP) than pure GDP: many people in rich countries are 100x richer than in poor countries, but I don’t think their lives are 100x (or even 10x) better, and they live <2x longer on average. I could propose some thought examples here (willingness-to-pay to save different lives, how many lives would you live in one place in exchange for just one in another), but I think the intuition is pretty straightforward. Some other thoughts on using GDP $ instead of something like average(log($)) or total(log($)) as your unit:
Using GDP $ ignores distribution, which is key to, e.g., the GiveDirectly case, which explicitly isn’t aiming at global GDP. More generally, growth accelerations typically increase inequality (at least for a while), and in the quick data I googled for India, the median income is less than half of the average; just adjusting for GDP/capita will miss some of the median income dynamics you recognize as important.
Using raw GDP makes you more likely to focus on rich countries: for instance, if I thought that relaxing zoning constraints would increase US GDP by 5% (example source), the perpetuity of that increase would be worth 6 times Lant’s calculation of the Indian growth episodes combined, even though it seems far less morally valuable to me. Log($) type considerations are, I think, a lot of what motivates a focus on developing countries in the first place, and would push towards more attention to poorer countries and domestic inequality within those countries, relative to a GDP-first framework.
Logging $ to get to utility terms generally removes the compounding dynamic in absolute $ that I think partially attracts people to growth arguments; I tend to think that’s good and correct, but am not sure, and would be interested in reading more on this if people have pointers.
One part of the case for a focus on GDP that I think might be right but that I’m uncertain about and would be interested in seeing quantified more is that growth itself causes others benefits (like health, education, etc) that should be counted separately from the more direct economic/subjective wellbeing benefits of growth. That seems like an obvious way that a log(GDP) utility function could be understating the value of growth. My intuition is that it would be surprising if more of the humanitarian impact (according to my values) of growth ran through second order impacts on health than through the direct impact on income/SWB, but I’m not sure about how the causal magnitudes would pencil out.
I think Carl Shulman’s old posts on log income and the right proxies for measuring long-run flow-through effects are interesting on this.
I totally grant that GDP is important and tightly correlated with lots of other good things, but I think using it as your comparison unit biases the calculation towards growth, since the randomistas are explicitly not aiming to increasing growth, while both groups are aiming to increase welfare all things considered.
Overall, I do find it likely that some form of policy interventions (maybe focused on growth, maybe not) will likely pencil out better than the current GW top charities, but I think measuring impacts in terms of raw GDP is likely to be more distracting than beneficial on that path.
If people are interested in taking up the mantle here and pushing these arguments further, I would be interested to see more of a focus on (a) detailed historical cases where outside efforts to improve policy to accelerate growth have worked—I think it’s unfortunate that we don’t have more concrete evidence on the amount of funding or role of the Indian think tank Lant cites; and (b) concrete proposed interventions/things to do. I agree that the “there’s nothing to do” argument is not a show-stopper, but I do think a real weakness of this overall direction of argument at the moment is answering that question. And in general, I expect an inverse relationship between “clarity/convincingness of policy impact/benefit” and “tractability/policy feasibility” (it seems to me that the clearest growth prescription is more immigration to rich countries, and ~equally clear that we shouldn’t expect major policy changes there), so I think getting the argument down into the weeds about what has worked in the past and where opportunities exist now might be more productive.
FWIW, I agree with the comment from @cole_haus speculating that part of the reason these arguments haven’t gotten traction in EA is that it seems most people who are willing to bite the “high uncertainty, high upside” bullet tend to go further, towards animals or the far future, rather than stop at “advocate for policies to promote growth.”
Again, just want to reiterate that I think this is an interesting and worthwhile question and that I’m sympathetic to the case that EAs should focus more on policy interventions writ large.
(Also, not sure I got formatting right, so let me know if links don’t work and I can try to edit—thanks!)
Thanks for these comments Alex. I agree that it would be best to look at how growth translates into subjective wellbeing, and I am planning to do this or to get someone else to do it soon. However, I’m not sure that this defeats our main claim which is that research on and advocacy for growth are likely to be better than GW top charities. There are a few arguments for this.
(1) GW estimates that deworming is the best way to improve economic outcomes for the extreme poor, in expectation. This seems to me very unlikely to be true since deworming explains almost none of the variance in economic outcomes across the world today, and research on and advocacy for growth looks a much better bet unless you endorse extreme scepticism about growth economics, which no EA has yet argued for. On the welfare metrics endorsed by GiveWell’s staff, deworming is roughly as good as their top charities. It is therefore very unlikely that GW’s top charities are better than research and advocacy for growth.
(2) The cost-effectiveness argument. Many of the huge growth episodes analysed by Lant occurred in countries that were extremely poor before those growth episodes. Looking to the past, it seems unreasonable to deny that funding research on and advocacy for growth is better than the best that one could do with a randomista intervention. The Chinese experience alone seems to me to clearly make this case. Looking to the future, our conjecture is that a 4 person year research effort will show that research and advocacy targeted at LMICs is better than the best GW charities. This takes account of the diminishing marginal utility of money. The case for this claim is unproven, but I think our argument provides strong support for it being probably true.
On the ‘risk-lovers would work on animals/long-termism’ point, I don’t think i agree. To me it seems that people work on these causes because of ethical assumptions about the weight of animals and future beings rather than because of attitudes to risk.
I agree that getting into the weeds is important for our predictive conjecture: the aim of our piece was precisely to motivate getting into these weeds. Moreover, someone needed to make these general arguments at some point as they had been around for many years without response.
This is one of the most thought-provoking (for me) posts that I’ve seen on the forum for a while. Thanks to you both for taking the time to put this together!
(Context: I’ve been engaging in “RD” research since my econ PhD focusing on development, and in my past 2.5 years working at IDinsight. All views are my own.)
Thanks a lot for the post. I agree that a more hits-based approach to development within EA is needed. GiveWell says they eventually want to look at economic growth, but they’re starting with health policy which is easier to evaluate and it’s unclear how long it will take them to look at policies aiming at increasing growth, so it seems valuable for other EAs to look at it in the meantime.
A few questions / comments (apology for the length):
(Perhaps answers to some questions here will only emerge after you do some more research. I wrote this before looking at other comments to avoid being influenced, and decided to just post it all to reflect the full set of my reactions even though some content overlaps, so feel free to not comment on what you already responded to.)
I’m curious what methodologies you have in mind in assessing donation opportunities on growth.
I’m not sure what methodologies GiveWell is using to assess policy interventions since they haven’t published an intervention or charity report on this—they have given grants to Center for Pesticide Suicide Prevention and JPAL’s Government Partnership Initiative but haven’t published reports as detailed as for their top charities or interventions.
Slightly less relevant, but in terms of what econ academia will do about it: I was initially pessimistic as development economists may not like methods that aren’t “rigorous” as RCTs as they like to be scientific and not very speculative, but I wonder if this is just because we are currently in a “randomista” paradigm in development econ, and there is a chance that it will shift to being more macro like before. And I don’t have a great sense of the track record of macroeconomics in shaping policy—clearly it’s a very hard field, but it seems to have had some positive influence.)
What do you think of growth diagnostics? Clearly it’s more macro and has lower level of certainty and rigor as RCTs, but I wonder 1) what you think of their theory, 2) what the track record has been in applying it, 3) what barriers there are barriers in applying it (e.g. governments being uninterested)? (I’m not very familiar with the specifics; I would appreciate if you could link some good intro material.)
Apart from knowing what specific policies help increase growth (which we don’t know very well yet), how to get them adopted is a major issue. Apart from knowing what China, India, and the Asian tigers did right, we need to understand why their leaders did the right thing at that time—how much of that is a function of the leaders’ characteristics (which we can’t change) and how much traction outside influence can have. I’m not sure what’s the best way to get them adopted: trying to replicate what economists did to influence China and India (though they did seek out advice unlike many other countries), understanding how governments work and finding effective ways to lobby governments that otherwise wouldn’t be receptive, promoting better institutions and governance (e.g. voter information interventions) to help select better leaders who are more inclined to do helpful reforms (could be political so more caution is needed) etc.
I’m glad you mention other aspects of welfare, and agree that overall “development”, for which GDP per capita is a main indicator / correlate, touches on all of them. It reminds me of what Esther Duflo said in this interview :”I think one should have a healthy respect for growth rates and treat them as useful companions and people that you have to make work for you. I think we should think of growth rate as chief of staff, not something I think we should fall in love with.” Pursuing growth is overall a good bet, but we should always keep in mind what we ultimately care about is a “social transformation” (as your Pritchett quote says) that improves human welfare.
In particular, environment and public health seem very important for welfare in developing countries (e.g. cost of air pollution in China, India, and Sub-Saharan Africa). How to address these issues also deserves attentions from EAs (GiveWell is looking into tobacco and lead regulations and may one day look into these; just like for growth, the non-EA development and philanthropy sector have worked on it, which doesn’t mean EA can’t add value). Agree with you that we should think separately about growth and climate change, but I also think if we figure out how to influence governments to adopt growth-friendly policies, it’s important to think about whether one can promote sustainable growth, environmental policies, climate change adaptation etc. with this opportunity.
Also, I strongly recommend you frame your message in a way that’s less antagonistic to the randomista development community in future work (e.g. something other than “against randomista development”). You may think a more controversial title can catch more attention, and some other RCT skeptics have done it (e.g. Lant Pritchett, Angus Deaton), but I don’t think this is the right strategy, and it just makes it harder for people to talk to each other (e.g. I have heard complaints about Pritchett’s rhetoric among the randomista community which probably makes them less likely to want to give his other ideas a serious look). Clearly you do see “RD” as useful in improving the huge amount of funding and many organizations in the development space and creating a nontrivial amount of positive impact in human welfare (e.g. GiveWell top charities, Evidence Action, some JPAL/IPA partners), and that randomistas are motivated by such impact potential in their work. I’m really glad you point out that we need to invest more in a higher risk and higher turns approach in our portfolio, in addition to the “safe assets” of “RD”. But I think economics academia and the EA movement are harmed by antagonistic feelings among people holding different opinions that want to achieve fundamentally the same goals. (No one is perfectly rational, so even if an “RD” economist—which currently many mainstream development economists are—tries to be rational they may at first find your message hard to stomach; we don’t need antagonistic-sounding headlines to make that even harder and create enemies in people who could become allies. Of course, they do potentially compete for human and monetary resources in the development field, but we don’t need to exacerbate whatever rivalry they already have.)
(One example where growth-friendly policies and “RD” can complement one another: investing in education may be important for long-term growth as a country would want to upgrade from labor-intensive sector to human capital intensive sectors, and “RD” can help find the answer to what education interventions the government should invest in conditional on trying to improve education. Arguably Singapore etc. did this without advice from “RD”, but “RD” may be able to help with improving education in other developing countries like they already do.)
Overall I am with you in thinking that more research is needed and am very excited that someone in EA is thinking of working on this, including proposing to research the neglectedness and tractability of the field from an EA perspective. (I’ve long felt the lack of hits-based approach in development in EA and not sure what can be done about it as GiveWell, the main EA development research org, is expanding into new territories at a slow-ish rate—which might well be the right choice given their capacity constraint—and Open Phil has largely deferred development research to GiveWell. I would guess some EAs interested in development and some others in the development sector have similarly thoughts, but feel unsure or pessimistic about the tractability of more speculative approaches like Banerjee, Duflo, Blattman, Glennerster etc. -- more research is definitely helpful in updating people’s views.)
Hello, thanks for these comments! On the antagonistic point, I personally don’t think the post is antagonistic. I think calling something “the case against view x” is what you would expect of a post criticising a particular view. I also don’t think there are any parts of the substantive post itself that involve any snark, sneering or things like that. Where we do put forward critical opinions, they seem to me to be stated neutrally and directly, without flourish, rather than in an antagonistic way.
This being said, it has been mentioned to me that stuff I write can come off as antagonistic when it isn’t meant to be, and I come from philosophy where discussion norms are highly confrontational, so I am open to suggestions as to how this piece could be less confrontational.
I agree that we should keep our focus on human welfare rather than on gdp per capita as such, and that proposed research agenda should consider a broad question such as “how can we ensure democratic, sustainable and equitably shared growth?” As we say, I do think this is best approached outside of RCTs.
Do we know if anyone from GiveWell intends to respond to this?
Hi Peter,
Catherine from GiveWell here. We appreciate the dialogue this piece has generated. We agree that economic growth is an important area to consider evaluating, due to its potential for significant and positive impacts on well-being.
Today, our top charities list comprises charities implementing programs that have been studied via randomized controlled trials (RCTs). By pointing to these trials (and the monitoring conducted by our charities), we can serve our donors by making a public, vettable case for our recommendations and demonstrating their likely impact. We believe these are excellent, cost-effective opportunities for donors to help people alive today.
As John and Hauke note, GiveWell is not just focused on RCTs. We’ve expanded GiveWell’s focus to include new areas that may be more challenging to measure than the programs our current top charities implement,and we will therefore consider potential top charities that don’t have RCTs of their work. Our goal in expanding our focus is to identify programs that are more cost-effective than our current top charities (which we believe are highly cost-effective and difficult to beat). We wrote a blog post in February 2019 outlining our early plans for this work: https://blog.givewell.org/2019/02/07/how-givewells-research-is-evolving/.
We plan to expand our focus gradually, starting with areas in which we think we can make significant progress. We’re looking into health policy interventions—like alcohol control, ambient air pollution, micronutrient fortification in India, pesticide regulation, and lead paint regulation—based on our understanding of the existing research within these areas and our experience evaluating health interventions. From an institutional and research perspective, we think this is the right starting point for our expansion.
That doesn’t mean we’ll stop there. In that February 2019 blog post, one of the areas we listed as under consideration for future research was “Increasing economic growth and redistribution.” We hope to be able to deepen our understanding of this topic soon, although we don’t expect to do so in the very near future, so unfortunately don’t have substantive additions to the above discussion at this time.
Preliminarily, we guess that it might be particularly difficult to analyze giving opportunities in “economic growth” broadly because we perceive that growth is the result of a complex interplay between many different areas one could make grants in. These areas include infrastructure development, fiscal policy, monetary policy, industrial policy, peace and stability, individually-targeted programs, health, and so on. We haven’t yet done substantial work to map this space, but we expect that considering the more granular cause areas within the broad economic growth space will help us make progress on prioritizing further research.
We look forward to following the research that is done in this space and we are excited that other researchers are focusing on international development, as we think this will improve our research and recommendations in the long term.
I’m quite excited to see an impassioned case for more of a focus on systemic change in EA.
I used to be quite excited about interventions targeting growth or innovation, but I’ve recently been more worried about accelerating technological risks. Specific things that I expect accelerated growth to effect negatively include:
Climate Change
AGI Risk
Nuclear and Biological Weapons Research
Cheaper weapons in general
Curious about your thoughts on the potential harm that could come if the growth interventions are indeed successful.
I do think this is a concern that we need to consider carefully. On the standard FHI/Open Phil view of ex risk, AI and bio account for most of the ex risk we face this century. I find it difficult to see how increasing economic development LMICs could affect AI risk. China’s massive growth is something of a special case on the AI risk front I think.
I think growth probably reduces biorisk by increasing the capacity of health systems in poor countries. It seems that leading edge bioscience research is most likely to happen in advanced economies.
On climate, it seems clear that it would exacerbate climate change, but it would also increase the capacity of very poor countries to deal with climate change. Most of the up to 2100 damages seem to me to stem from dryer dry places and wetter wet places, and I think economic development is a good way to deal with these problems for poor countries—they can do desalination, more efficient agriculture, and build flood defences. It would of course be better if they did this with clean energy, but it seems that working on that separately is the best way forward. It’s not like stopping Africa growing is a top priority for environmentalists.
On nuclear, economic growth is a major risk factor for nuclear weapons status, much more important than other factors people often talk about such as pursuing a civilian nuclear power programme. But the ex risk of nuclear war is debatable and seems to stem from the unique features of US v Russia tensions—it seems v unlikely that today’s LMICs would come to possess thousands of warheads.
On the alternative boring long-termist view, these risks seem a much weaker concern.
Generally, I disagree with Cowen that increasing growth is the best thing to do from a long-termist point of view. Though, as we argue, it does seem good from a person-affecting point of view
I think catch-up growth in developing countries, based on adopting existing technologies, would have positive effects on climate change, AI risk, etc. In contrast, ‘frontier’ growth in developed countries is based on technological innovation, and is potentially more dangerous.
I’m curious about the intuitions behind this. I think developing countries with fast growth have historically had quite high pollution and carbon output. I also think that more countries joining the “developed” category could quite possibly make coordination around technological risks harder.
I think what you’re saying is plausible but I don’t know of the arguments for that case.
If the case for growth in rich and poor is very different (possibly negative in the one but not the other case), then it starts to matter a lot whether we can promote growth in poor countries without promoting growth in rich countries as a side-effect. I don’t know how the proposed interventions fare in this respect?
It seems useful to point out (because I presume not all readers will know this) that subjective well-being is often divided into positive affect, negative affect, and life satisfaction. Of the three, life satisfaction tends to be the most tightly correlated with measures like GDP per capita. So the correlation between GDP per capita and life satisfaction isn’t quite as definitive a statement about subjective well-being as it might naively appear.
I’m a bit late to the party, but thank you for creating this post! It’s gotten me interested in “longtermist-style” global development interventions that seek to improve human well-being over timescales of 20 years or more—and I’d like to see even more research into this area.
That said, I’m skeptical of your claim that growth causes health, but that health does not cause growth. You cite the “Health and Economic Growth” paper by David N. Weil in at least two places in your appendix entitled “Health does not cause growth, but improving cognitive development might”.
First, you cite the paper as saying:
Later on, you cite the paper again in your claim that “growth causes population health”. However, this paper does not seem to support the conclusion that growth increases population health. Instead, it says that the empirical effects of increases in income on health are mixed, with some studies showing a positive effect and others showing a negative effect. It also states that many of the studies have identification issues, and “also suffer from the difficulty that feasibly identified estimates may only pick up a short-run effect” (p. 649).
Later in the paper, Weil writes:
To be fair, the paper’s conclusion does state:
This seems to support your conclusion that growth causes increases in population health. However, it only applies to the macrohistorical trend of growth in already industrialized countries coupled with the scientific and technological innovations that made improvements in health possible. It doesn’t apply to the context of catch-up growth in developing countries, as the healthcare innovations that these countries need to improve population health already exist! To quote Weil again:
Thus I’m not convinced that altruists interested in longtermist global development ought to prioritize growth over health, especially because there is some evidence that people in developing countries prefer health improvements highly relative to poverty reduction (e.g. Stein, Redfern and Li 2021). Rather, it might be better to look for interventions that can promote both health improvements and poverty reduction (such as institutional quality), or opportunities to reform health policy in developing countries so as to improve health outcomes over a long timeframe (such as LEEP).
Excellent comment—thanks! I agree with a lot of what you say- what I meant was that “economic development causes health improvements in the long-run, but not in the short-run” as per the Weil paper you quoted.
I wanted to push back on global health rhetoric arguing that health causes a lot of growth in poor countries, which has a lot of intuitive force as we’ve all been sick and couldn’t work. However, poor population health isn’t generally the bottleneck for growth when a country is still poor, as there’s an oversupply of labor (many subsistence farmers) competing for (fewer) manufacturing jobs and so it doesn’t matter if people get sick often, as workers can be replaced. Population health only becomes the bottleneck for growth at later stages of development.
I disagree: the problem is not that the health innovations do not exist—a lot of the health gains historically are due to old public health “technology” like WASH, better nutrition, basic vaccinations, reducing infectious disease. Rather the problem is that it’s costly to role them out for large populations if GDP is low. Poor countries like the DRC often spend only on the order of ~$10 / head/ y on health, rich countries like the US spend on the order of ~$1-10k/head/y. With ~1bn people in extreme poverty, needing around ~$100/ head / year to get maybe 80% of the health gains that we have in rich countries is still a lot of money (~$100bn - $1trn/ y ). Even the best “Political will and institutional efficiency” won’t help if you don’t have the GDP to finance health yourself, and aid and philanthropy seems unlikely to adequately fund population health in poor countries. A good paper on this.
But if you want to give away many billions then global health interventions might make sense—see Alex Berger on the 80k podcast:
Responds might not be aware that if growth might improve health more.
I think increasing institutional quality to create growth via good economic policy is the way to go and perhaps more important than health policy, from my appendix:
“Just as one example, take the importance of trade liberalization on infant mortality (trade (liberalization) is usually consider to cause growth ). For instance, one natural experiment suggests that a US trade agreement with Sub-saharan Africa caused infant mortality to drop by ~9%. Another study found trade liberalization reduced child mortality in ~50% of developing countries they looked at and in most of those countries child mortality was reduced by more than 20%. This is big, if true.”
Tyler Cowen included this in today’s Marginal Revolution links.
There’s tons of back-and-forth on the Easterlin paradox (“The paradox states that at a point in time happiness varies directly with income both among and within nations, but over time happiness does not trend upward as income continues to grow.”), but if we’re talking about national development over time (i.e. policy-oriented growth) this seems of pretty central relevance. In particular, it’s plausibly more of a problem for growth-oriented national development than for RD because one plausible explanation for the paradox is the importance of positional goods (I care not just about my absolute income but how it compares to my neighbors or how it compares to my expectations which are influenced by neighbors). If the whole country (everyone in my comparison class) grows their GDP per capita at exactly the same rate, everyone’s position is unchanged; if the poorest are targeted by RD, their positions can be improved with minimal harm to others.
(This shades into inequality as an important consideration beyond GDP as the post mentions, but it’s not quite the same.)
The Easterlin paradox notwithstanding, as we say in the post, economic growth does buy you a lot of subjective wellbeing improvement in a country. It would be interesting to explore how far increasing growth in a country would improve subjective wellbeing in LMICs. The path to impact in HICs seems much less clear imo
I might not be understanding you, but it seems like this tries to smuggle in causation and assume away the problem. As I see things, there are two conflicting pieces of correlational evidence:
Cross-country regressions show strong correlation at a point in time between income and SWB (what the post highlights)
Time series regressions within countries show a weak correlation between income and SWB (Easterlin paradox)
I don’t currently know of a fully convincing resolution of this conflict, but the second correlation actually seems a bit more central for the question of the causal effect of growth over time on SWB.
Easterlin on LMIC and the paradox:
(For the record, I would be surprised if the Easterlin paradox turned out to 100% correct and rising national income over time had 0 positive effect on subjective well-being. But I am significantly uncertain about this, could imagine the effect being quite substantial, and knowing the magnitude of the effect seems very important.)
Updated research on the Easterlin Paradox here. Free working draft here. Nice audio/visual overview from one of the authors here. Good discussion on the EA forum here.
I am an academic economist. I agree that economic development is important and is likely responsible for the majority of welfare gains in poor countries (although the spread of medical treatments, eliminating polio etc., are also huge). Yes, we have some good evidence that certain policies substantially inhibit development. And we should advocate against these policies.
However, some parts of the argument seem a bit overstated or unfair to me. Some points
“Randomista”: that is not the term the advocates would prefer, is it?
Even if the best policies are pursued, the benefits will be slow and uneven. In the meanwhile, donations to prevent malaria, fund micronutrients, and even provide fistula and eye surgery can have a huge impact/$.
I don’t think many donors will decide between giving $ to bednets and giving it to fund advocacy for pro-trade policies. However, presenting the benefits of the former as ‘a drop in a vast ocean’ will discourage giving overall
The benefits of these health interventions are not primarily their impact on boosting economic growth/income. They yield direct welfare benefits. The comparisons you highlight above make it seem as if the main intention of these is to boost growth/income.
The main issue: You state
Perhaps, but that is not the issue from a donor point of view. The issue is the cost-effectiveness of money donated to support these policies. I see very little reason to believe that “funding a bunch more economists” (again, I say this as an economist myself) would have a substantial beneficial impact, much less on a per-dollar basis.
Maybe it would, but I think there are orders of magnitude of uncertainty over this impact. The assumptions for this in the spreadsheet seem simply like guesses to me.
My reason to be a bit skeptical… we have many many economists out there. I don’t see how more economists–or even more think tanks–will do much to clearly advance the argument against the known-to-be-bad growth policies.
There are a few claims like this in the post. I think there is prior related work. Narrowly, a recent example is Effective Altruism and International Trade. More broadly, I think there are strong links between the line of debate in this post and the perennial “systemic change objection” (as alluded to by jonathanpaulson in another comment). Recent stuff on the systemic change objection includes e.g. Effective Altruism and Systemic Change and Some personal thoughts on EA and systemic change.
(I don’t want to get into a full explanation/discussion of the analogies between the systemic change discussion and the growth objection in this comment but just for the sake of clarity:
Both about relatively small and certain impacts vs large and more speculative impacts
Both about interventions with substantial empirical evidence vs more theory-driven interventions
Both about policy/institutions
)
Hopefully pointing out these related discussions comes across as a helpful pointer to further thinking and not a “Gotcha!”.
In the piece, we say that there is no publicly published treatments by EAs of (1) how best to increase growth, (2) the claim that we know nothing about how to increase growth. I don’t see that claim being discussed in either the Broi post or the Shulman post—neither of them mentions economic growth. I hadn’t seen the thing on trade, but this also can’t really be classed as a treatment of either question—it just discusses one way to increase growth, it doesn’t compare and rank different ways of increasing growth.
Pritchett’s arguments are a form of the systemic change objection, which has been discussed a bit. But there are lots of different forms of the systemic change and the forms that have been raised previously are either (i) socialist or (ii) people misrepresenting what EA actually does by saying that EA is in principle opposed to systemic change or that it never does systemic change, both of which are obviously false.
Yup, agreed that none of the linked things are on growth per se. I just think the link to the systemic change objection is useful because it gives hints as to what problems there might be with the growth-focus argument, how people are likely to react to the growth-focus argument, which arguments are persuasive, etc.
We have also ranked American political policies and candidates in terms of how much impact they will have on growth (and other issues), giving quantitative weighting to different issues.
https://1drv.ms/b/s!At2KcPiXB5rkyABaEsATaMrRDxwj?e=VvVnl2
It is very rough and tentative but suggests that housing and immigration liberalization are the most important areas for U.S. domestic policy to improve economic growth. Different Fed policy and child allowance might be very good too.
Not sure if already mentioned but this post by Ben Kuhn is also relevant https://forum.effectivealtruism.org/posts/M9RD8S7fRFhY6mnYN/why-nations-fail-and-the-long-termist-view-of-global-poverty
Thanks for this very well argued piece.
I think the central claim is that this area is under studied and that we should fund a ~4 person team to investigate more.
Is there a more specific grant proposal available? Or to put it another way, is there a shovel-ready project that we could quickly fund?
Depending on the size and cost of the project, I may be able to help. Happy to continue this conversation over email if you prefer.
This is clearly fairly tangential to the main point of your post, but since you mention it, the more recent EA Survey 2019: Cause Prioritization post offers clearer evidence for your claim that most surveyed EAs seem to be long-termists, as 40.08% selected the ‘Long Term Future / Catastrophic and Existential Risk Reduction’ (versus 32.3% selecting Global Poverty) when presented with just 4 broad EA cause areas. That said, the claim in the main body of your text that “Global poverty remains a popular cause area among people interested in EA” is also clearly true, since Global Poverty was the highest rated and most often selected ‘top cause’ among the more fine-grained cause areas (22%).
40.08% isn’t “most”. :P
That’s certainly true. I don’t know exactly what they had in mind when they claimed that “most seem to be long-termists in some broad sense,” but the 2019 survey at least has data directly on that question, whereas 2018 just has the best approximation we could give, by combining respondents who selected any of the specific causes that seemed broadly long-termist and Long Term Future lost out to Global Poverty using that method in both 2018 and 2019.*
*As noted in the posts, that method depends on the controversial question of what fine-grained causes should be counted as part of the ‘Long Term Future’ group. If Climate Change (the 2nd most popular cause in 2019, 3rd in 2018) were counted as part of LTF, then LTF would win by a mile. However, I am sceptical that most Climate Change respondents in our samples count as LTF in the relevant (EA) sense. i.e. normal (non-EA) climate change supporters who have no familiarity with LTF reasoning and think we need to be sustainable and think about the world 100 years or more in advance, seem quite different from long-termist EA (it seems they don’t and generally would not endorse LTF reasoning about other areas). An argument against this is that that we see from the 2019 analysis, that people who selected Climate Change as a specific cause predominantly broke in favour of LTF when asked to select a broader cause area. I’m not sure how dispositive that is though. It seems likely to me that people who most support a specific cause other than Global Poverty (or Animals or Meta) would probably be more to select a broader, vaguer cause category, which their preferred cause could plausibly fit into (as Climate Change does into ‘long term future/existential risk’), than one of the other specific causes, and as noted above, people might like the vague category of concern for the ‘long term future’ without actually supporting LTF the EA cause area. Some evidence for this comes from the other analyses in 2018 and 2019 which found that respondents who supported Climate Change were quite dissimilar from those who supported LTF causes in almost all respects (e.g. they tended to be newer to EA- very heavily skewed towards the most recent years- and less engaged with EA, generally following the same trends as Global Poverty and the opposite to AI, see here).
I think this post makes a very good point in a very important conversation, namely that we can do better than our currently identified best interventions for development.
The argument is convincing, and I would like to see both more people working on growth-oriented interventions, and counter-arguments to this.
As a PhD in economics, this post may influence what topic I choose to work on during the dissertation phase. I think most EA economists at the start of their PhD would benefit from reading this.
I wonder whether taking moral uncertainty seriously may make EA’s focus on RA health interventions a bit more robust.
The article is right to point out how important economic growth is to improving welfare. However, if you take the concern for a right to life seriously, or the greater importance of saving lives to improving overall well-being (the position of many contractarians and deontologists), we ought to prioritize health interventions which save lives over maximizing growth.
This is all to say: Sacrificing human life to allow for increased future consumption is position we shouldn’t act on if we take moral uncertainty seriously.
Good to see some of these arguments making their way into EA analysis!
Given the number of economists, the number of countries and that there does seem to be relatively wide agreement behind some important economic policies: are there lists floating around of remaining low-hanging fruit for economic policy changes in certain countries?
I would have thought that there are just so many economists, think tanks etc., and people keen to make money/prestige off of advising governments on how to run their economy, that most those remaining low-hanging fruit policy changes are stuck where they are for some very-hard-to-change reason.
Hm, just found the appendix mentioned in 5.3 - so never mind! I think I’m persuaded that it’s likely very valuable looking for opportunities.
I’ll look through the linked paper, but I’d be surprised if one paper is enough to convince me of the spirit of this claim (which I take to be not just that health is not the best but not even especially good or worth targeting). The impression I get is that consensus in development economics is that human capital interventions (e.g. education and health) are very well-regarded. For example Using Randomized Controlled Trials to Estimate Long-Run Impacts in Development Economics says:
The paper we cited is a comprehensive recent meta-analysis on the topic of health and growth that synthesizes the literature on this topic.
The paper concludes:
We did however acknowledge that this claim is controversial:
This is a topic of ongoing debate in the literature—future research could look into this topic more and a starting point could be the citation trail from the study above.
Having looked at the paper now, I definitely have a different take as to how definitive it is. My maximally contrarian take would be that it’s a non-systematic review in which many (most?) of the works reviewed are in favor of an important causal link running from health to income. I do agree that the overall macro-scale evidence is weak (which is distinct from strong evidence of a weak effect), but this is exactly why people like RCTs over national development! Causal inference at a macro scale is hard!
(Health and Economic Growth: Reconciling the Micro and Macro Evidence also looks like a good source that I’ll look at.)
I just read the paper. It’s more a literature review plus data analysis than a classic meta-analysis (i.e., a paper aggregating the results of many different observations into a single statistical pooled estimate).
I interpret “Improving health is not the best way to increase growth” as: growth usually leads to better health (sure!), and that (very plausibly) investment in economic development (on average) tends to be more cost-effective than investing in health, in the long-term.
However, for EAs, I’d first remark that what matters is not so much “what’s the causal direction in the growth-health correlation?” – which is David Weil’s point – but “what prevents the 3rd world from developing—low GDP or poor health?”. The first question would have for scope even current US and Norway. Since growth trajectories are path dependent and affected by many different things, we should distinguish analyses related to current low and high-income countries, and account for the possibility that different countries will find distinct paths to growth (at least if I understand D. Rodrik’s main point). E.x.: the question “why Senegal still has a low GDP per capita and life expectancy” may turn out to be quite unrelated to “why France has increased its HDI in XXth century”. I’d be marveled if health statistics (which, at least for latin America, includes violence) didn’t play a role in the first case; my personal anecdotal evidence is that prospects for life deeply affect one’s plans, so that, e.g., it’s really hard to design savings and insurance systems, with stable interest rates, in countries where people do not expect to reach old age.
Second, I am very wary of certain conclusions/analysis:
- “differences in life expectancy at birth tend to be far smaller than differences in life expectancy at birth” (p. 3 of the file – 626 in the book)… so what? Life expectancy is still significantly different across countries, income levels and regions, otherwise every age pyramid would be similar to all the others, except that in poor countries it’d have a larger base. Second, if you’re using life expectancy as a proxy for health in general, child mortality is relevant because it provides information about other sanitary conditions.
David Weil calculates the return to health using height as a proxy. I will suspend my judgement until further inquiry and maybe look at the raw data, but I suspect of regressional Goodhart.
This post reminds me of a common left/socialist reaction to EA: “Charity is pointless, overthrowing capitalism is clearly the best way to increase human welfare.” This is a subset of the “politics” objection; promoting growth (in the ways economists advise) is much more controversial and uncertain than RCT-based programs. I think “uncertain” is a separate bad from “controversial”. The best reply to the left/socialists is probably that their empirical track record is much worse (although there are successes and failures from both approaches).
Care to explain?
As an american i think “socialist” healthcare is UK or Europe/Canada as better. Basic education until 12 grade (hight school) in USA is free another “socialist” policy
Why are those “left/socialist” policies bad, and what is the track record that you are referring to.
The author didn’t say that all “left/socialist” policies are bad. The first sentence of his comment reads:
When he later writes that “[t]he best reply to the left/socialists is probably that their empirical track record is much worse”, he is referring specifically to the empirical track record of attempts to overthrow capitalism, which is indisputably abysmal.
The sentence ended with “(although there are successes and failures from both approaches)” which changes the meaning to me. Will wait for the author to clarify.
This is the reason I don’t like labels of left/right/socialist/communist/capitalist/fascist etc.. It is much better to discuss policy.
The track record of attempts to overthrow any system of power are abysmal, I don’t see much point in thinking or discussing overthrowing anything.
I think you are seriously mistaken. Attempts to overthrow monarchy do not remotely have the track record of attempts to overthrow capitalism. Compare, say, the American and French revolutions of the 18th century with the Russian and Chinese revolutions of the 20th century.
[I have edited my comment to make it less confrontational.]
From the dawn of agriculture until the industrial revolution, we were ruled by kings, dynasties came and went, but the basic structure of kings remains.
What we have today is a continuation of that old system, in a new garb.
Is decolonization an overthrow of capitalism? Yes the russian revolutions was overthrown, but the authoritarian Chinese government is still in place, as are plenty of dictatorships e.g. Saudi Arabia, Cuba.
In any case I have no interest in revolution, overthrowing systems, or even thinking about them.
My original question was asking about comparison between “capitalist” and “socialist” systems. Since it was asserted that “left/socialists is probably that their empirical track record is much worse”.
That’s exactly one of the main problems with the leftist reaction that jonathanpaulson mentioned. I’m not sure what you are disagreeing about.
I am not disagreeing, I am asking for clarification for the following sentence
“best reply to the left/socialists is probably that their empirical track record is much worse”″
OK, I don’t think he means that social welfare policies like public education and healthcare (as done in the context of a capitalist economy) are generally bad, but rather that properly socialist countries are bad. After all he did say that there are successes and failures from both approaches.
ok cool. we are in agreement that communist countries had serious problems. even so China pre-reform (1979) had good social indicators that should not be dismissed as if they dont exist.
For a general look at the problems of socialism, see my post: https://forum.effectivealtruism.org/posts/ktEfsoGfBFGsaiY46/overview-of-capitalism-and-socialism-for-effective-altruism
I re-read that post kbog, I am not advocating any -isms here. However I do see a bias for capitalism/free markets on the forum and ask for clarification.
I asked an unanswered question on that post some time ago https://forum.effectivealtruism.org/posts/ktEfsoGfBFGsaiY46/overview-of-capitalism-and-socialism-for-effective-altruism#TuY7ouzjFpeS7zYB2
In general I dislike arguing about -isms. I think policy. For me Universal Basic Education, Universal Basic Healthcare, Universal Basic Income are policies that I strongly support.
The order is also important first Basic Education, then Basic Healthcare, then Basic Income that is how an ideal government would prioritize.
I’m the one who upvoted that comment that you made, and broadly agree with it. As I tried to make clear in the post: the main reason we talk broadly about socialism is that there is a broad socialist movement which cannot be reduced to a specific policy platform, and it can be useful to know whether we should encourage, discourage or ignore this broad movement.
It is perfectly consistent to say that the socialist movement mostly points in a bad policy direction, while also believing that real policy evaluation should be done in more specific terms, that boundaries between socialism and capitalism are fuzzy, and that there have been successes and failures from both approaches.
Excerpt from Abhijit V. Banerjee and Esther Duflo book, Poor Economics:
“Economists (and other experts) seem to have very little useful to say about why some countries grow and others do not. Basket cases, such as Bangladesh or Cambodia, turn into small miracles. Poster children, such as Côte d’Ivoire, fall into the “bottom billion.” In retrospect, it is always possible to construct a rationale for what happened in each place. But the truth is, we are largely incapable of predicting where growth will happen, and we don’t understand very well why things suddenly fire up.
Given that economic growth requires manpower and brainpower, it seems plausible, however, that whenever that spark occurs, it is more likely to catch fire if women and men are properly educated, well fed, and healthy, and if citizens feel secure and confident enough to invest in their children, and to let them leave home to get the new jobs in the city.
It is also probably true that until that happens, something needs to be done to make that wait for the spark more bearable. If misery and frustration are allowed to have their way, and anger and violence take over, it is not clear that the spark will ever arrive. A social policy that works, that keeps people from striking out because they feel that they have nothing to lose, may be a crucial step toward preserving the country’s date with that elusive takeoff.
(...)
We may not have much to say about macroeconomic policies or institutional reform, but don’t let the apparent modesty of the enterprise fool you: Small changes can have big effects. Intestinal worms might be the last subject you want to bring up on a hot date, but kids in Kenya who were treated for their worms at school for two years, rather than one (at the cost of $1.36 USD PPP per child and per year, all included), earned 20 percent more as adults every year, meaning $3,269 USD PPP over a lifetime. The effect might be lower if deworming became universal: The children lucky enough to have been dewormed may have been in part taking the jobs of others. But to scale this number, note that Kenya’s highest sustained per capita growth rate in modern memory was about 4.5 percent in 2006–2008. If we could press a macroeconomic policy lever that could make that kind of unprecedented growth happen again, it would still take four years to raise average incomes by the same 20 percent. And, as it turns out, no one has such a lever.”
I have a section in the appendices “Quotes from Duflo and Banerjee” with more quotes from them from their latest book.
We actually cite Pritchett above directly replying to this quote:
“The Venezuelan economy is not in 2018 spiraling into hyperinflation and in the midst of a tragic economic depression because “economists have little useful to say about economic growth” in the sense the advice, if followed, would be useful.”
Whole paper is worth a read:
https://d101vc9winf8ln.cloudfront.net/documents/32264/original/RCTs_and_the_big_questions_10000words_june30.pdf?1565974982
From our piece above: Admittedly, GDP and health are strongly correlated. Healthier people can work harder and learn more in school and so one might expect better health to cause growth. However, the evidence for health causing growth is weak and the effect is small:
“If improving health leads to growth, this would be a reason, beyond the welfare gain from better health itself, that governments might want to make such investments. However, the evidence for such an effect of health on growth is relatively weak. Cross-country empirical analyses that find large effects for this causal channel tend to have serious identification problems. The few studies that use better identification find small or even negative effects. Theoretical and empirical analyses of the individual causal channels by which health should raise growth find positive effects, but again these tend to be fairly small. Putting the different channels together into a simulation model shows that potential growth effects of better health are only modest, and arrive with a significant delay.” “Health and Economic Growth—CDN.” Health and Economic Growth. Accessed 20 Nov. 2018.
(Though there is some disagreement in the literature—for instance, “targeted interventions to improve the health conditions of women and children, such as iodine supplementation or vaccination against human papilloma virus, are likely to yield very high returns in terms of economic growth, well-being, and long-run development.)”)
1. Indeed, it is crucial that there’s no general equilibrium theory of deworming and we don’t know whether these effects scale to the whole population as well as growth does. 2. Of course, the literature on this is hotly debated (c.f. worm wars). Perhaps some targeted effective investments in health might cause growth or otherwise have outsized effects on welfare.
Our best bet is the literature on the “fetal origins hypothesis” and child development, where early environment affects cognitive development and later life outcomes. Some of the effect sizes are downright incredible and its implications might be big (if true). For example, salt iodization is cheap and might improve (population-level) cognitive development and IQ. , Other examples are pollution, nutrition, disease, weather, smoking, alcohol etc.
A counterpoint though is that because growth causes population health, and income has also been shown to improve birth weight, test scores etc, growth might still dominate this.
3. Increasing growth benefits almost everyone in the economy and improving policies such as trade policies reach users with ‘zero marginal cost’. In other words, a think tank advocating for lower tariffs for Nigeria to EU markets provides a public good for all 190 million Nigerians. Adding another Nigerian due to population growth is increasing this intervention effectiveness at zero marginal cost.
How Poverty Ends: The Many Paths to Progress—and Why They Might Not Continue is from Abhijit V. Banerjee and Esther Duflo (the recent econ Nobel Laureates who won for their RCT work) and I think can reasonably be read as a response to the criticisms of Lant Pritchett (probably the most vocal advocate of the line of thinking this post represents).
Key excerpts:
Yes, I list a couple more quotes from this article, but also many quotes from their Duflo and Banerjee’s book in the Appendix. I think these quotes really get to the crux of the disagreement between growth and randomista development.
From their Foreign affairs article:
Quotes from Duflo and Banerjee
From “Good Economics for Hard Times”
Thanks for an excellent summary of the literature, Hauke! This interview we did with Lant in 2017 touches on some of these ideas. We don’t go as deep but I think Lant makes some insightful points about the intellectual history of the debate and I found it interesting to hear him think out loud. I recommend skipping to around min 20. https://harvardeapodcast.com/2019/09/24/the-turing-test-9-lant-pritchett/amp/
Thanks for writing this! I am coming somewhat late to the party , but I wanted to add my support for what you have both written here. I back the concerted research effort you propose and believe it somewhat likely that it will have the benefits you suggest are probable.
I was digging through the Pritchett paper in hopes of doing my own analysis, and I do have a question: how did you calculate the median figure for Vietnam that you reference in section 4 ($6,914 GDP per capita)? I’ve been looking at the Pritchett paper and I can’t quite figure it out. It seems close to the median absolute growth in $PPP presented in Pritchett’s Table 4, but I imagine that’s not right since Table 4 only lists the top 20 growth episodes from the full set of about 300. When I look at the those figures in Appendix A, though, it seems like the median growth episode calculated using PRM (without reference to dollar size) is somewhere around Ecuador’s negative growth in 1978, which doesn’t seem like it would line up even with the conversion to $PPP.
EDIT:
I see that you’ve written that Vietnam/89 is the median growth episode “to be affected by a think tank,” and a little research reveals that Vietnam began a concerted economic liberalization in 1986, so perhaps you have a secondary subset of growth episodes that you believe were affected by think tanks?
I can also sort of see a case for selecting the median from Table 4 of the top 20 but that seems strange since (a) the cutoff is arbitrary and (b) it doesn’t factor in the risk of harm from a think tank-influenced growth episode.
Excellent comment—strongly upvoted for engaging with the data.
The sheet where we calculated the median growth episode within the spreadsheet is here:
https://docs.google.com/spreadsheets/d/1VcQ2r5zuCztd1_2vRscK8UOEAiQqhvvhkJVfagCzpqQ/edit#gid=1331750623&range=D26
Source: Pritchett, Labor p23
Vietnam was just the median of these selected growth episodes- because Pritchett in his example uses quite a big growth episode. Pritchett calculates the NPV gain from growth acceleration per person from this median case as $6,914. This is for illustrative purposes, picking Vietnam has no special significance here. “To be affected by a think tank” also has no special significance, we didn’t check whether this growth episode was likely affected by a think tank.
These are selected by Pritchett:
so… re your question:
Yes, this is likely largely due to Vietnam having a roughly ~10x higher population and being 10x poorer back then.
I think it is okay to use, as Pritchett does, these selected growth episodes, because if one wants to maximize effectiveness using policy one can strategically only look at big poor countries. One could further look at only those countries where growth is sluggish and perhaps where economic policy is particularly bad.
I write about this in the appendix:
Thanks for your response! I still have some confusion, but this is somewhat tangentially related. In your CBA, you use an NPV figure of $3752bn as the output gain from growth. This is apparently derived from India’s 1993 and 2002 growth episodes.
The CBA calculation calculates the EV of the GDP increase therefore as 0.5*0.1*3572 = $178.56 bn. You acknowledge elsewhere in your writeup that efforts to increase GDP entail some risk of harm (and likewise with the randomista approach) so my confusion lies with the elision of this possible harm from the EV calculation.
Even if the probability that a think tank induces a growth episode—e.g. the probability that a think tank influences economic policy in country X according to its own recommendations—is 10%, then there is still obviously a probability distribution over the possible influence that successfully implemented think tank recommendations would have. This should include possible harms and their attendant likelihoods, right?
I recognize that the $3,572bn figure comes directly from Pritchett as part of an assessment of the Indian experience, but it’s not obvious to me that the number encapsulates the range of possibilities for a successful (in the sense of being implemented) intervention. I may be missing something, but it seems to me that a (perhaps only slightly) more rigorous CBA would have to itself include an expected value of success that incorporates possible benefits and harms for both Growth and Randomista approaches in the line of your spreadsheet model reading “NPV (@ 5%) of output loss from growth deceleration relative to counter-factual growth.”
I understand that what you’re envisioning is a sort of high-confidence approach to growth advocacy: target only countries where improvements are mostly obvious, and then only with the most robustly accepted recommendations. I still think there is a risk of harm and that the CBA may not capture a meaningful qualitative difference between the growth and randomista approaches. In principle, at least, the use of localized, small-scale RCTs to test development programs before they are deployed avoids large-scale harm and (in my view) pushes the mass of the distribution of possible outcomes largely above 0. No such obstacle to large harms exists, or indeed is even possible, in the case of growth recommendations. Pro-growth recommendations by economists have not been uniformly productive in the past and (I think) are unlikely to be so in the future.
I still favor this approach you suggest but, given the state of the field of growth economics—and the failure of GDP/capita to capture many welfare-relevant variables that you cite at the end of the writeup—I’d be keen to see more highly quantified conversation around possible harms.
Thanks for this piece, I thought it was interesting!
A small error I noticed while reading through one of the references is that the line “For example, France’s GDP per capita is around 60% of US GDP per capita.[7]” is incorrectly summarizing the cited material. The value needs to be 67% to make this sentence correct. The relevant section in the underlying material is: “As an example, suppose we wish to compare living standards in France and the United States. GDP per person is markedly lower in France: France had a per capita GDP in 2005 of just 67 percent of the U.S. value. Consumption per person in France was even lower — only 60 percent of the U.S., even adding government consumption to private consumption.”
I think this argument equivocates between the probability of any reform and the probability of a particular reform. Because the reform policy was academic-economist-inflected, denying the influence of economists sounds silly. But I think we should instead think about two separate chunks:
the wedge between the status quo growth trajectory and the reform trajectory that would have obtained had Chinese reformers only had e.g. 1960s economics knowledge
the wedge between the 1960s-style-reform trajectory and the actual reform trajectory
Economists since the 1960s get 100% of the credit for the second wedge, but I think it’s plausibly extremely small (especially since Chinese reforms didn’t hew particularly closely to economic orthodoxy in the details). Economists since the 1960s only get any credit for the first wedge insofar as they were the impetus for major economic reforms. My limited knowledge of Chinese economic history suggests that this probability could easily be very small.
Phrased differently, we can model this as:
Without post-1960s economists:
Status quo had X% chance of continuing
Reform had (1-X)% chance of happening and represented a $Z gain
With post-1960s economists:
Status quo had X-A% chance of continuing
Reform had (1-X)+A% chance of continuing and represented a $Z+B gain
I can easily imagine A and B both being quite small but the original presentation disguises that.
This is my first venture at a comment on this forum. I have recently joined, and this was one of the recommended articles. Sorry my comment is many years after the fact.
I was not aware that EA was so “fixated” on RCT’s. It seems a very limiting position to take, and somewhat inconsistent with the idea of doing the most good. Surely deciding that you’ll only invest in things that can be validated by RCT’s is no different than saying you’ll only invest in things which start with a consonant? The criterion seems almost irrelevant to the potential value of the intervention. I’m sure I’m vastly oversimplifying the position. But nonetheless, I wanted to make a comment on how to handle testability as a parameter.
In many areas of life (e.g. financial markets) there is an acceptance that testability / provability comes with a cost. A low-volatility stock costs more than a stock with the same expected value but higher volatility. People who are willing to accept more uncertainty are, on average, rewarded.
Is there a similar situation here. Insisting on RCTability is a very conservative approach. Laudable if the goal is to prove (for our own satisfaction) that we’re adding value, but not necessarily the option which does the most good, because some options have been excluded because they are not testable.
In my career in business, this is a constant challenge. Successful companies certainly do RCT’s when they can, but they are very careful to distinguish between ideas which RCT’s show to be inefficient and ideas which are not RCTable. For the latter, it is normal to look at an analysis like the one in this article and use judgment to sometimes take non RCTed decisions.
I am sure this is something that could be quantified, much in the way that the cost of volatility is quantified; that one could reach a reasonable position relating how much extra “expected value” would be necessary to compensate for the lack of RCTability of that expected value.
It’s kind of analogous to the way that you compare high-risk / high-reward vs. low-risk / low-reward scenarios by using expected value, except here even the expected value is very uncertain for reasons related not to risk but to testability.
I will go and learn more about this, and probably realise that what I’m writing here is misguided. (feel free not to publish this comment if it doesn’t make sense :D—or otherwise, just delete this last part!)
You probably know this by now, but what the heck. I don’t think EA as a whole is RCT-only. GiveWell is, AFAIK, very randomista. But there are other EA-affiliated organizations that are not as randomista as GiveWell, notably Open Philanthropy and anything with a more x-risk or long-termist focus.
Thanks Michael!
An interesting piece, and a good conversation to have. My point below is less about the conclusions regarding the effectiveness of economic growth, and more about a particular section that argues against the role of these interventions in progress.
---
In Section 3, under the sub-heading “Economic growth as a driver of progress and the limitations of RD”, the case against the RCT-backed interventions currently recommended by GW is laid out as follows:
“we do not believe that the vast majority of RD interventions are plausibly among the top 100 ways to increase growth… The reason these things are unlikely to be the best way to increase growth is that they play no role in the causal story of the huge differences in GDP per capita across space and time. To illustrate:
It is not the case that Danish people are better off than Ugandans because they have implemented direct programmatic efforts of this kind to a greater extent.
It is not the case that Danish people today are better off than Danish people 100 years ago because they implemented this type of intervention.
When looking at the huge human welfare gains in China, Indonesia, Vietnam, Singapore, South Korea and Hong Kong in the second half of the 20th century, no-one argues that this was because they engaged in more interventions of this type.”
It’s correct to say that the specific interventions recommended are not necessary conditions of economic growth on a global scale. They did not contribute to Danish economic growth and welfare, but this is because these weren’t necessary—either at all (e.g. deworming), or at the time of rapid economic growth (e.g. one could make the case for HIV education). But this a very narrow form of the argument.
The broader question—and the question has to be broader, if considering the “causal story… across space and time”—is whether this type of intervention might be among the top 100 ways to increase growth. Many of the RD interventions are health programmes that work to combat causes of sickness and mortality that are significant in country-specific contexts. Re-writing the second point above, in light of this, I find the statement less convincing:
“It is not the case that Danish people today are better off than Danish people 100 years ago because they implemented [health programmes to deal with significant causes of sickness and mortality in Denmark]”.
Obviously such programmes aren’t sufficient conditions for economic growth alone, but the argument above seems to suggest they’re not necessary either, which I don’t see the evidence for. The ultimate argument of the authors may be that both are necessary, but focusing on economic growth is more effective, which is fine, but this section seems misleading to me.
Agreed.
I’m not so sure. What matters is not the scale x impact of the problem, but of the intervention, and so the matter is if an additional contribution would scale. I’m pretty sure that economic growth is hugely important and that policies conducing to it must be supported, but the question is if there’s any low-hanging fruit that I can grab myself here. Show me a proposal and I’m gonna ask “why isn’t the government/ banks / World Bank / Bill Gates funding it?” (damn convergent interests and institutional altruists eating all the low-hanging fruit!)
However, I do concede that RD is not very neglected anymore.
Actually, that’d be Appendix 5, right? I liked them, in general. BTW, I’m very curious about what happened to appendix 4.
I’d be very keen to see someone fully operationalize “A ~4 person-year research effort will find donation opportunities working on economic growth in LMICs which are substantially better than GiveWell’s top charities from a current generation human welfare-focused point of view” and put it on a prediction market like Metaculus.
I think (on not that much reflection) that I’d be inclined to bet at <50% odds on my idealized view of what this fully operationalized statement would be, though I concede that ideal objective resolution criteria may overly assume the randomista worldview
I think one possible explanation (I’ve not heard this anywhere explicitly; it’s just me making things up.) that I find moderately persuasive is:
Development RCTs rose to prominence in the wake of the ‘“lost decades” in Latin America and the “transition depression” in some (not all) former Soviet dominated countries’. These failures and the broader (perceived) failures of the Washington Consensus provoked a crisis of confidence in economic policy prescriptions. In particular, large-scale economic theory is hard to make accountable to empirical evidence. RCTs shore up this epistemic weakness—they allow economists to test their theories against reality and build up more certain knowledge which can perhaps eventually be applied to big questions of national development. Without RCTs, economic prescriptions are much more reliant on theory (even non-RCT causal inference from empirical data is more theory-laden) and it doesn’t seem great to cut out (almost) one whole category of evidence. (See What randomization can and cannot do for a good discussion of the interplay of theory and RCTs.)
I think epistemics is plausibly a crux for in the randomista vs big national development debate.
Note that RCTs are still a minority in published academic research. I think Pritchett’s criticism is that NGOs have been dominated by randomistas; eg, even the International Growth Centre does a lot of RCTs, instead of following his preferred growth diagnostics approach.
To the extent that this is true, I think there are pretty benign possible explanations:
The data on growth (e.g. GDP) and RD interventions typically operate at different scales. Even if GiveDirectly substantially increases the long-term growth in a village, that’s not going to show up in national aggregate data.
Making empirical growth claims requires data accumulated over time. The randomista trend is pretty recent. Using Randomized Controlled Trials to Estimate Long-Run Impacts in Development Economics mentions that looking at long-run impacts will become more and more possible as more early RCTs reach the age of maturity.
hi! have two things in response. Firstly, Randomistas are not trying to increase growth. Some of them, such as Blattman, Banerjee and Duflo are explicit about this. Secondly, for the reasons we discuss in the post, it is implausible that RCT-backed interventions are among the top 100 ways to increase growth.
Effects of growth/degrowth in short term and long term
What you call “economic growth” I would call it “consumption growth and resources degrowth”. The consumption growth has a positive effect in the short term while the resources depletion and ecosystems degradation have a negative effect in the long term. Therefore, I prefer to talk about growth/degrowth as both consumption growth (GDP) and resources degrowth goes together.
Recent consumption growth rate is correlated with many good things, as you show in several charts. But this short-term improvement based on huge material and energy consumption is reducing drastically the opportunities for future beings. If we would plot the evolution of minerals, energy resources and ecosystems available for future generations what we would see is a rapid degrowth in the last decades.
In my mind the focus of the 4 person-year research about growth should be on how to replace GDP as a misleading KPI by other KPIs which take into account the future. My only concern is whether 4 people will really add something, as the UN report they already have >100 people working in a concept https://seea.un.org/ecosystem-accounting
Median income and GDP per capita correlate very strongly (.93 in one sample).
Generally, for emerging economies, growth (raising GDP per capita) seems sufficient to increase median income (https://en.wikipedia.org/wiki/A_rising_tide_lifts_all_boats).
Amongst countries with a GDP per capita > $10,000 (~Namibia), no country has a median income below the extreme poverty line (1.90*365 = $693.5).
And raising median income is sufficient and necessary to eliminate extreme poverty.
Interesting post, very stimulating. A couple of thoughts:
Randomista is clearly not a neutral term, and I think constitutes a kind of name calling (e.g. Corbynista in the UK). Do proponents of RCT development use this term for themselves?
I’m not sure the ‘extreme scepticism’ (perhaps we could just call it scepticism?) argument is given a fair shake. Note that answering the question of what causes a country to grow is basically the big question of development economics, and as such it has received considerable attention from economists. In the Duflo and Banarjee piece, they argue that economists did find good low hanging fruit, notably misallocation of resources, but they argue this is reaching a point of diminishing returns. Economists are now struggling to find great opportunities in growth economics, and so there is a good case for looking at different approaches to development. This argument feels plausible to me, and it means you do not have to make the apparently crazy claim that economists never had significant influence on past effective growth policies.
I find it plausible that it would be valuable to get some more EA perspective on this issue, particularly for things like identifying particularly effective charities in this area. So I appreciate that contribution.
What’s your basis for claiming that ‘randomista’ is a non-neutral term? That is not my impression. A popular book that presents a positive picture of the field is titled Randomistas: How Radical Researchers Are Changing Our World. A recent article by one of the world’s most prestigious science journals uses the headline “‘Randomistas’ who used controlled trials to fight poverty win economics Nobel”, and includes the following line: “Kremer, Banerjee and Duflo are at the vanguard of the ‘randomista’ movement, which applies the methods of rigorous medical trials — in which large numbers of participants are randomized to receive either a particular intervention or a standard treatment, and followed over time — to social interventions such as improving education.” And Mark Ravallion, a leading authority on the economics of poverty, explicitly writes: “That term ‘randomistas’ is not pejorative.” (p. 2)
We did not use it in a name calling way but rather as a neutral term to describe the intellectual movement. The term is used by mainstream economists who are critical in a respectful way, but also by randomistas themselves (note for instance that Duflo or Blattman have used the term).
However, it is true that
A few people have mentioned that they think the title is inflammatory—it wasn’t intended as such. I had never thought that the term randomista is pejorative, e.g. you can find various examples of eg chris blattman owning it
I think even if it isn’t inflammatory, a different title might make the intended audience less defensive and more likely to change their minds as it isn’t about their identity, and more about how much weight to give RCTs versus other evaluation methods.
Yes I think that’s a fair point
I have no doubt that the term was used in good faith. I apologise that my post was worded a bit poorly, so it sounded like I was accusing you of name-calling.
The ‘-ista’ suffix sounds pejorative to me in English,like someone who is a zealous dogmatic advocate. Corbynista was the example I referred to, which is a term used often to in the UK to bash the left.
Etymologically, it sounds like my suspicion was correct (see Hauke’s post above). Of course these words often get reclaimed, and it appears that’s happened here too, hence why I asked whether the RCT proponents call themselves that.
It’s obviously not that important, and I don’t want to start a battle over words, but David makes a good point about how you engage your critics.
Yes, I steelman this view in the Appendix (my view not necessarily John’s):
However, there is a debate about this and counterarguments:
Pritchett too seems much more optimistic about growth diagnostics and believes that while we might not know everything, we generally have a reasonable understanding of what causes growth and can even influence it.
Pritchett has edited a whole volume on growth diagnostics, including on the causes of growth in India.
Generally, my take is that growth diagnostics might get harder the richer a country becomes, by virtue of there being less and less data from other countries on how they developed. Thus, for the poorest countries, growth diagnostics might be easiest because we can draw lessons from all other countries on they developed.
Because effective altruism often tries to focus on the poorest countries, where a dollar goes 100x further than in rich countries, there is perhaps most hope for growth diagnostics.
So perhaps Duflo is right in that “Growth is likely to slow, at least in China and India, and there may be very little that anyone can do about it.” And this is actually born out in China’s and India’s performance on the World Bank’s Doing Business indicators, where they score 63th and 31st out of 189 countries, though being relatively poor. Thus, there seem no low hanging fruit to improve their economic policy.
But in the Appendix I have an analysis where I multiply population size of every country by their poverty multiplier (i.e. $1 is worth x times more going to this country than to the richest country in the sample. See appendix 2 of this doc for more info). This can then be ordered by the utility created by increasing GDP per capita by $1. India comes out on top because of its large population (1.3bn) and relatively low GDP per capita ($6,574). China comes 3rd, because though it has a large population, it is already relatively rich ($15,531). Recall that the problem is that we might not know how to increase growth in India and China.
However, there are many very poor countries in the top 10 sample such as DRC, Bangladesh and Ethiopia—very poor countries with +100 million population. This can then also multiplied further by neglectedness/tractability criteria. For instance, in a country’s ranking on the WB Doing Business ranking divided by GDP. There one can see that, relative to its GDP per capita, China already does quite well on the Doing Business ranking. However, the DRC and Ethiopia do poorly on the doing business ranking, even relative to their GDP. These countries could be most cost-effective for economic policy assistance.
The Copenhagen Consensus Center is actually doing something along the lines of assisting countries / highlighting the need to improve their economic policies. For instance they are helping Bangladesh to improve its economy and prioritize which policies would have the highest social, economic and environmental benefits for every dollar spent. On top of their list is e-procurement across government and land records digitization—related to criteria used to rank countries on the WB Doing Business index.
These seem like clearly insufficient arguments. They strike me as analogous to:
Different circumstances apply in different places and focusing on and importing salient characteristics of the winners is not likely to be successful because it’s almost never the case in complex domains like this that a single factor is sufficient for success on its own.
More concretely, while no one argues that deworming is a top cause of the huge economic transformation, plenty of people argue that disease environment/burden (or geography more broadly) is an important cause of differential economic success. For example, Historical Development references arguments that the tsetse fly had substantial impacts on Africa’s path of development (“by inhibiting the development of intensive agriculture using draft animals, resulted in lower populations, less urbanization, and less state development”).
I think this view would probably be endorsed by many prominent development economists. But I concede that there are also development economists who believe that health and education is very important.
When I first read about Rodrik’s theory of development, I updated in the direction that health and education are not that important for growth at least for very poor countries, even though it’s quite unintuitive.
From the appendix doc:
Again quoting Weil’s review of “Health and growth” (emphasis mine):
re: Nunn: I’m not ruling out that invariant geographical factors influence economic development by way of health. But it’s a different question on whether we can do anything about that by ramping up health spending and ameliorate these differences and whether that’s important for growth.
Perhaps tangential, but unless the urban workers are fed by imports, in order to allow rural to urban migration, the country needs agricultural improvements so that people can feed a lot more than themselves. So I think the green revolution technologies of fertilizer, pesticides, and improved crop varieties (mentioned by the OP) are quite important beyond the direct food supply improvement, and the penetration of these is much lower in Africa.
Yeah, I will have to look into this perspective more.
I do think it’s an open question though.
It seems like one of the key implicit claims in the post is that growth effects are better/more important than level effects (e.g. The post says “Moreover, the vast majority of proponents of RD do not tackle the question of whether the interventions they assess increase economic growth.” which is true, but RD proponents often focus on level effects) . I think it would be good to state and argue for this point explicitly.
Relatedly, I think the anti-RD perspective advocated in this post require the claim that level effects don’t affect growth rates. If boosting someone’s assets or income leads to a persistent increase in their income growth, the RD-caused level effect also gets the growth benefits this post argues for. The low-level equilibrium trap is a pretty popular model which describes just this dynamic.
In my opinion, randomistas do not focus on growth at all, be it level effects or growth effects.
Though to be fair there’s this short passage in Duflo’s new book on this:
Also we do say that “we do not think that the things assessed by RD do not increase economic growth at all: indeed some RD health interventions increase earnings and consumption later in life, and thus do increase growth to an extent. However, evaluating whether the effect size is trivial or not should be a top priority for proponents of RD.”
Just saw this on Marginal Revolution and wondered what people here make of it, e.g. if the recent slowdown or instability in major countries Nigeria, Ethiopia and South Africa is a noticeable update for them against the promise of economic growth work in Africa.
https://marginalrevolution.com/marginalrevolution/2021/08/is-africa-losing-its-growth-window.html
We’ve taken a first step at identifying a growth-focused cause area that could be very cost effective, charter cities: https://www.chartercitiesinstitute.org/post/case-for-charter-cities-effective-altruism.
Planning to release an updated version of this soon that incorporates feedback received from the EA Forum and elsewhere.
https://www.chartercitiesinstitute.org/post/case-for-charter-cities-effective-altruism
try this link, one above is 404ing for some reason
Thanks for this! You might want to make clearer who the authors are; I take it that John Halstead is a co-author, but his last name doesn’t appear as far as I can see.
Thanks—yes, John Halstead and I co-authored this post.
(We’ll use the forum’s new co-authoring function, this is why I accidentally omitted the authors when first posting, but it will take a little time reflect it, so I’ve fixed this provisionally).
2 immediate thoughts -
Firstly, in terms of human welfare per economic value, the graduation approach is probably more effient. The received by graduates is received by people who were previously in poverty (and people close to them, particularly their children). I expect that Growth in general, like that experienced by China in the Deng Xiaoping period, is less efficiently distributed than the graduation approach. But I expect the efficiency factor is less than 10. So Hallestead and Hillebrandts position stands that critique.
Secondly, H&H strawman the randomista position. Dufflo and Bannergjee argue in Poor Economics that the gains from effective charities are large relative to regular charities. But more importantly, the randomista development can shift the policies of development countries on important issues below macro-economics. The growth potential to changing textbook purchasing in India through RD could compete with development economics. If a RD study leads to new textbooks, tens of millions of children would read them per year. That lever is comparable to the lever described by H&H (one study to millions of children receiving an education-year-equivalent). For more of this perspective, check out the 80k interview with Rachel Glennerster - http://documents.worldbank.org/curated/en/243261538075151093/pdf/WPS8591.pdf
The second point defends IPA, JPAL, One Acre fund from H&H’s critique because each produce research outputs that may change developing country policies (da big lever). For the malaria and give directly approach H&H’s critique stands.
“[R. W. Hafer] found that a country’s average IQ predicted its subsequent growth in GDP per capita, together with growth in noneconomic measures of well-being like longevity and leisure time. An 11-point increase in IQ, he estimated, would accelerate a country’s growth rate enough to double well-being just 19 years rather than 27.
Policies that hurry the Flynn effect along, namely investments in health, nutrition, and education, could make a country richer, better governed, and happier down the road.”
Extracted from Pinker, Enlightment Now.
Health, nutrition and education improvements also have positive impact on GDP growth, not just the other way around. By expanding access to vitamin A (Helen Keller Foundation, recomended intervention by GW) for eg, we are also having a tremendous, long-run, economic impact.
Precisely. This is the story of Kerala, China (pre-reform)
I’ve guessed this is the case on ‘back of the envelope’ grounds for a while, so nice to see someone put more time into evaluating it.
It’s not true to say EAs have been blindly on board with RCTs — I’ve been saying economic policy is probably the top priority for years and plenty of people have agreed that’s likely the case. But I don’t work on poverty so unfortunately wasn’t able to take it further than that.
Any discussion of how much it might cost to change a given economic policy / the limiting factor that has kept it from changing thus far?
(I think this is also the big question with health policy)
I’m gonna write a slightly more detailed top-level comment about this, but the gist of it is: policies that can reasonably be expected to produce growth are *strongly opposed* in the countries that need them.
Thanks for writing this up! I’m very interested in this area (was/am actually working on something related) and open/sympathetic to the overall claim. I’ll make my substantive comments separately (to work better with comment threading/nesting).
thanks for all the comments! responding above
Great work. I’m very interested in this claim
In which volume was this claim made?
[37] Pritchett, ‘Randomizing Development: Method or Madness?’ (2019), p. 23-24. see:
https://d101vc9winf8ln.cloudfront.net/documents/32264/original/RCTs_and_the_big_questions_10000words_june30.pdf#page=23
Is green growth or degrowth the best near-term future?
I have followed this debate for many years, and my summary and my conclusion is different from this post. It’s hard to analyze growth overall without more analysis about the effect on climate and other planetary boundaries, when we already exceed 6 of these 9 boundaries. In 2015, it was 4 out of 9. Updated study to be published later this year. This source is not yet available in English, but all links below are in English. https://landetsfria.nu/2021/nummer-282/fler-hallbara-granser-kan-ha-passerats
From the European Environmental Bureau 2019:
The executive summary states: Is it possible to enjoy both economic growth and environmental sustainability? …
The conclusion is both overwhelmingly clear and sobering: not only is there no empirical evidence supporting the existence of a decoupling of economic growth from environmental pressures on anywhere near the scale needed to deal with environmental breakdown, but also, and perhaps more importantly, such decoupling appears unlikely to happen in the future. …
policy strategies … [must include] the direct downscaling of economic production in many sectors and parallel reduction of consumption that together will enable the good life within the planet’s ecological limits …
It is a reason to have major concerns about the predominant focus of policymakers on green growth, this focus being based on the flawed assumption that sufficient decoupling can be achieved through increased efficiency without limiting economic production and consumption.
https://eeb.org/library/decoupling-debunked
As I see it degrowth is not a goal, but might be a consequence of reaching our environmental goals in time. There is a lot of important new research about degrowth, so I will try to summarize: Most humans try to solve problems by adding, but we should more often reduce. More complexity increases risks: https://podbay.fm/p/sean-carrolls-mindscape-science-society-philosophy-culture-arts-and-ideas/e/1630327697
Degrowth researchers I talked to say that we have convincing findings that green growth is not likely. We might see decoupling, but not rapid enough and not for all major environmental problems. So we have to choose between economic growth or reaching our environmental goals in time. Meta-study based on more than 10,000 scientific papers:
https://iopscience.iop.org/article/10.1088/1748-9326/ab8429 https://iopscience.iop.org/article/10.1088/1748-9326/ab842a
More research: https://www.researchgate.net/publication/301857037_A_Simple_extension_of_Dematerialization_Theory_Incorporation_of_Technical_Progress_and_the_Rebound_Effect https://tel.archives-ouvertes.fr/tel-02499463/document
https://degrowth.org
The world might fail in reaching further growth even if we continue trying. So what happens if we globally soon encounter a long period of degrowth? Probably not as much as many fear. Research has found that the need for growth is much about expectations. Like investments and loan decisions are made in the belief that growth will continue. But more is not the same thing as better. A large Swedish report in English about four different scenarios of a future beyond growth: https://bortombnptillvaxt.se/english/startpage.4.21d4e98614280ba6d9e68d.html#.YSfAq8gvND8
All together, this new research indicates that GDP increases if we work more hours or use more resources (capital, energy, raw materials) per hours. Economic growth is not equivalent to efficiency, creativity or development, but is primarily driven by capital investments: https://www.mdpi.com/2071-1050/8/5/490?fbclid=IwAR35JaACj8pRq54I-K4bFTB2gk1rqjq_1_Brz6ThdFRlVcz0p8HKu0iZPzc
In reports by the UN panel on climate change (IPCC) and the corresponding body for biodiversity – IPBES – the researchers are increasingly more outspoken about overconsumption. The IPBES report from 2019 is based on more than 15 000 scientific publications and was compiled by more than 400 experts from 50 countries. One of the key messages is that a sustainable global economy needs to focus on decreasing levels of consumption and new visions for a good life – quality of life instead of a focus on economic growth. https://zenodo.org/record/3553579#.YSzCGMgvND9
We can still have a lot of growth in important areas, but not overall. So perhaps the best way if you want long-term growth beyond the Earth is degrowth right now, but not for space exploration?
Income level is the single largest contributor explaining the variation in greenhouse gas emissions between households in Sweden, so maybe we should embrace the popular opinion to choose more free time on the society level, instead of raising high salaries even higher? https://onlinelibrary.wiley.com/doi/abs/10.1111/jiec.12168?fbclid=IwAR028wFiJx7k6LNK__BmuNqyzJb2XTmKyXgJP-9jxiFi08OKdWsFuQGWKQM
Even during the pandemic, Americans want to prioritize environment more than growth: https://news.gallup.com/poll/344252/americans-emphasis-environmental-protection-shrinks.aspx
We also see global public support for more focus on environment and well-being at the expense of economic growth: https://globalcommonsalliance.org/news/global-commons-alliance/global-commons-g20-survey
Finally, a report about where we have scientific consensus about growth, and where we have the real difference in opinions: https://cogito.nu/publikationer/ten-thoughts-on-growth
Your thoughts about this?
This post was awarded an EA Forum Prize; see the prize announcement for more details.
My notes on what I liked about the post, from the announcement:
Thanks for this very interesting post! It brings to discussion a sensitive political topic: whether to promote “economic growth” is a cost-effective cause area.
I take your invite to open the discussion and share a couple of comments:
5.4 Politisation
I personally see the option of growth increase as a political idea competing to the ones you also recognize: “reducing inequality, or improving state responsiveness and state capability”. Each one of these topics is very complex. It is very difficult to decide whether we should prioritize one over the others. As it is so hard to study them, to translate the assumptions into figures and to prove whether the predictions are validated, some bias based on personal values and political preferences is always influencing each person’s selection of the top one. Also, we have to take into account that work improving one of them may diminish the other.
With regards to your proposal of “a 4 person-year research effort would find donation opportunities working on growth” I suspect it could take more than 4 person-years of debate to create a consensus in the community that we should prioritize growth over inequality 😉
It might be more effective to take 4 people to explore opportunities in growth, 4 people in inequality reduction and 4 people in state responsiveness and capability, rather than figuring out which one of those should go first.
Is growth the best approach to maximizing the good we can do? What is the effect on the environment? How much consumption is too much? Where does this leave future generations?
What if instead low income countries were granted debt relief, so their policies were not driven by creditors? What about a global minimum wage? Or tax justice, like a universal minimum corporate tax? And what to do about climate reparations?
These ideas are not my own, they are from this podcast:
https://soundcloud.com/citationsneeded/episode-58-the-neoliberal-optimism-industry
Much of the challenge of measuring growth is it occurs as a country-level analysis, where the growth of global north rich countries in the last two centuries was at least partially gained on the resources and human capital of the global south, and continues, so similar growth cannot be replicated.
Therefore I would wonder if global governance policy is an important and neglected area to be considered? (I will allow that tractability may be the roadblock).
I would therefore also wonder about the EA response to “poor countries don’t need charity, they need justice”?
Besides the interventions mentioned for increasing free trade, immigration, or charter cities, I wonder if there is any capacity for additional less political interventions.
With new tools like the Atlas of Economic Complexity (https://atlas.cid.harvard.edu/), might there be some effective ways to support entrepreneurs moving up the value-add & product complexity scale to products related to the existing products & skill-sets in a country? Explainers…
https://youtu.be/2FeugaLv5Bo
https://youtu.be/5jjKDH6ijrQ
https://youtu.be/KQAarHByMTM
Or
Is there more capacity for poverty alleviation measures that can be somewhat measured by potential increases in income from products? Like JPAL or Paul Polak interventions of developing domestic production of new income generating or income saving products (treadle pumps, low-cost drip irrigation, electro-chlorination vendors, etc)? https://youtu.be/H_F8xpat4sc
Many thanks for this very insightful article. I fully support your stance on moving beyond only RCT’s, and short term solutions to poverty. I also think it’s a very promising line of argumentation and would be happy to see more of these types of discussion in the EA community. I have written down a few comments/thoughts I had while reading this article. I recognize that already many comments have been made; if so feel free to redirect me or simply state it was answered already and I can look for it.
1: I’d like to push a bit on the neglectedness argument. Let’s say we want to donate to advocacy groups for policies we feel confident are effective. I believe that there is quite some tension between the degree of certainty that some policy is effective, and its neglectedness. In other words, the policies where we can feel most confident they are effective might already have so much funding and attention that each additional donor or career might have much less marginal benefit. Conversely, the strategies that are most neglected might also carry more uncertainty, as they have been less critically vetted by a large diversity of economists. What are your thoughts on this?
2: more generally, can you outline in what way current incentive structures in the economics field and other institutions might cause sub-optimal policies to be advocated in a way that effective altruists (through being effective altruists) can mitigate?
3: Daron Acemoglu argues that the main obstacle to economic development in developing countries are institutions that are not conducive to growth, by being extractive, i.e. having excessively concentrated power which among other things slows down innovation. This seems to be something more difficult to address for Westerners. Relatedly, countries with insufficiently inclusive political institutions may grow but without such institutions are unlikely to improve the welfare of the poorest.
4: “However, no one can reliably and rigorously demonstrate exactly which actions best promote development (…) This should lead us to be sceptical about RD.” You could also argue for the opposite conclusion. Since we cannot reliably know which actions promote development, RD can at least help us alleviate suffering of those who are poor today.
Christiaan
Thank you for your questions. I do write about neglectedness elsewher
This is an excellent point—you highlight a very interesting dynamic. Basically, the reason why RD is called sometimes called neglected (i.e. “neglected tropical diseases”, “global poverty is neglected”) is not necessarily due a low amount of money going to the cause in absolute terms, but because the problem is so huge. For instance, transnational wealth transfers through cash transfers can absorb virtually infinite amounts of donor money at not very rapidly diminishing returns. When these funding gaps are very hard to fill even for mega donors (e.g. billionaires and sovereigns), then that’s a good reason for them to be more neglected than say research and advocacy for economic growth. The entire economics profession at $6bn a year that we guesstimated above could be roughly bankrolled indefinitely by the wealth of the Gates foundation.
However, given that there’s still a lot of very suboptimal economic policy (e.g. see Venezuela or how poorly some countries do in absolute on the World Bank Doing Business indicators) and very little growth advocacy for and there are like still many unfunded opportunities. Btw—my intuition is that similar arguments can be made about other research (e.g. agricultural research) that would benefit emerging economies.
I write more in the appendix under the heading “Growth is not as neglected as RD, its low-hanging fruit have been picked, and the marginal dollar is not as effective”
Great question: General EA heuristics might be at play here: people are less likely to care for people far removed from them and thus less likely to give to International development think tanks that advocate for them. This domestic bias manifests in suboptimal allocation of research effort—fewer PhDs becoming development economists relative to its effectiveness (100x multiplier) vs. people who become advanced economy labor economists (e.g. studying the effect of minimum wage on employment.
I think generally the world might spend too little on R&D (~1.7%) in general relative to the ~100 trillion in GDP.
I highlight a few more biases in the appendices under the heading (Appendix 5. Biases against growth/for RD ).
Yes, you’re raising a great point here. However, there are some attempts to use ODA to strengthen non-extractive institutions. Better and more transparent tax collection might one thing that also falls under economic policy advice. Another example is the Budget Strengthening Initiative
see
https://www.odi.org/blogs/9847-why-uganda-more-transparent-norway
“In Uganda, a government website allows the public to find out both what the Ugandan government plans – and actually does – in districts around the country. A toll-free number lets concerned citizens complain directly with the government if they spot any wrongdoing. The initiative also trains journalists in making the most effective use of the data available.”
Research and software for things like that scale and imho would be aid better spent than direct funding of randomista interventions.
This is precisely the point of the contention that the Randomista camp with Duflo et al. has with the Growth camp with Pritchett et al.
I write more about this in the appendix under the heading “The field of “Growth diagnostics”” and “Quotes from Duflo and Banerjee”.
I happen to agree with the Pritchett et al. camp and think the Nobel prize winners are wrong on this, which of course is a strong claim.
As we argue in the piece, the value of information of getting to the bottom of who is right here is likely very high.
I’m confused what type of EA would primarily be interested in strategies for increasing economic growth. Perhaps someone can help me understand this argument better.
The reason presented for why we should care about economic growth seemed to be a long-termist one. That is, economic growth has large payoffs in the long-run, and if we care about future lives equally to current lives, then we should invest in growth. However, Nick Bostrom argued in 2003 that a longtermist utilitarian should primarily care about minimizing existential risk, rather than increasing economic growth. Therefore, accepting this post requires you to both be a longtermist, but simultanously reject Bostrom’s argument. Am I correct in that assumption? If it’s true, then what arguments are there for rejecting his thesis?
Let’s say you believe two things:
1. Growth will have flowthrough effects on existential risk.
2. You have a comparative advantage effecting growth over x-risk.
You can agree with Bostrom that x-risk is important, and also think that you should be working on growth. This is something very close to my personal view on what I’m working on.
This makes sense as an assumption, but the post itself didn’t argue for this thesis at all.
If the argument was that the best way to help the longterm future is to minimize existential risk, and the best way to minimize existential risk is by increasing economic growth, then you’d expect the post to primarily talk about how economic growth decreases existential risk. Instead, the post focuses on human welfare, which is important, but secondary to the argument you are making.
Can you go more into detail? I’m also very interested in how increased economic growth impacts existential risk. This is a very important question because it could determine the influence from accelerating economic-growth inducing technologies such as AI and anti-aging.
It seems to me that there’s a background assumption of many global poverty EAs that human welfare has positive flowthrough effects for basically everything else.
At one point I was focused on accelerating innovation, but have come to be more worried about increasing x-risk (I have a question somewhere else on the post that gets at this).
I’ve since added a constraint into my innovation acceleration efforts, and now am basically focused on “asymmetric, wisdom-constrained innovation.”
If this is true, is there a post that expands on this argument, or is it something left implicit?
I think Bostrom has talked about something similar: namely, differential technological development (he talks about technology rather than economic growth, but the two are very related). The idea is that fast innovation in some fields is preferable to fast innovation in others, and we should try to find which areas to speed up the most.
No, I actually think the post is ignoring x-risk as a cause area to focus on now. It makes sense under certain assumptions and heuristics (e.g. if you think near term x-risk is highly unlikely, or you’re using absurdity heuristics), I think I was more giving my argument for how this post could be compatible with Bostrom.
I’m confused here. It seems like there are examples of RCTs addressing at least:
Geography: It seems like No Lean Season, Duflo’s fertilizer nudges, and deworming (edit: I try to make the link between these and geography more obvious in a grandchild comment.) are all examples of RCTs targeting various aspects of geography depending on how you want to interpret the term.
Human capital: Education and health are clear focus areas for development RCTs.
Culture: It seems likely that many RCTs have flow-through effects on culture.
Is the argument not that RCTs can’t address things in these categories but that they aren’t good at it?
I think it is unreasonable to interpret geography in the way you suggest. I don’t see how migration loans or deworming change the geography of a place. RCTs may have had an effect on culture but it seems likely a very small one wrt culture affecting growth.
I agree on the human capital point.
The link I was thinking of is that migration loans are relevant for urbanization, agglomeration effects, and generally the distribution and density of humans (which seem like they fit into human geography—”Human geography attends to human patterns of social interaction, as well as spatial level interdependencies”—and urban geography).
Deworming doesn’t change the geography of a place in itself but it mediates the impact of that geography on humans/the economy/society (supposing that we consider the disease environment a part of geography similar to the way we might consider forestation and the endowment of domesticable animals as geographic factors).
Similarly, fertilization mediates the impact of poor soils which are prevalent in equatorial regions.
Not sure if that makes the examples and their connection to geography more scrutable.
What are you thinking of when you emphasize geography as a determinant of growth? Stuff like shipping access and which countries are neighbors?
Can you help clarify what the causal evidence is? I don’t really see any non-correlational evidence in the preceding section. (I’m assuming that’s what this sentence is emphasizing given that the opening sentence in the preceding paragraph is “The foregoing arguments show that GDP per capita is strongly correlated with many objective and subjective measures of welfare.”) I think causality and evidence of it is actually pretty central to the debate—one of the chief advantages of RCTs is the ability to make causal claims. You can of course use things like instrumental variables and natural experiments to make causal claims about national development-type interventions but that’s pretty hard (see e.g. The Skeptics Guide to Institutions—Part 1).
The claim that increased GDP per capita causes other beneficial changes seems plausible to me, but I also don’t have too much trouble half-convincing myself that all these things are driven by common causes (e.g. it’s pretty easy for me to believe (based on a substantial literature) that increased social trust leads to both increased GDP per capita and increased welfare).
hello. The causal evidence was the claim that we would expect people with more income to buy more basic private goods which improve their private welfare.
This could go the other way also. Education can cause reduced disease risk burden, education allows people to participate in industrial economy, and therefore increases money.
How do we know that when countries transform from illiterate to educated. It is an effect of money, and not government policy?
How exactly does the transformation happen? Suppose there were no public schools in the USA or UK would the population be able to buy education? Would the country be more or less educated?
I saw this post included in a discussion of the book Doughnut Economics, seemingly to argue in favor of GDP as a goal, and against, for example, Raworth’s Doughnut (model from the just-mentioned book). I have the following two problems with GDP as a goal, and I think Raworth’s Doughnut or a variation thereof is better. 1) The arguments used here in favor of GDP as a goal are statistical in nature, going for associations instead of understanding. This is dangerous, a point that Lawrence Krauss likes to make often, and David Deutsch makes in Fabric of Reality, or at 15 minutes into his TED Talk on the same topic: https://www.ted.com/talks/david_deutsch_a_new_way_to_explain_explanation For example, an increase in oil spills and/or child labor is/are also positively correlated with a growth in GDP, but are presumably not positive. 2) To echo an argument Sam Harris makes on religious texts: even if they do good, they can likely be better, and then to prevent editing, prevents improvements and opportunities to mitigate harm. In conclusion, we need to go beyond statistics, towards understanding, GDP. And then (by analogy with the second problem with GDP as a goal / argument against GDP as a goal) we need to gradually improve this measure and our goal, for example taking inspiration from the Doughnut model from Doughnut economics, but at a minimum by for example not positively valuing oil spills.
Is growth the best approach to maximizing the good we can do? What is the effect on the environment? How much consumption is too much?
What if low income countries were granted debt relief, so their policies were not driven by creditors? What about a global minimum wage? Or tax justice, like a universal minimum corporate tax? And what to do about climate reparations?
None of these ideas are my own, they are from this podcast:
https://soundcloud.com/citationsneeded/episode-58-the-neoliberal-optimism-industry
I would also wonder about the EA response to “poor countries don’t need charity, they need justice”
A bit late, but perhaps you will find it interesting anyway—I have seen a couple of posts discussing Jason Hickel’s ideas on the EA forum. For example these posts are really interesting:
https://forum.effectivealtruism.org/posts/hptEKkvtFgCGeFjw8/the-case-for-green-growth-skepticism-and-gdp-agnosticism
https://forum.effectivealtruism.org/posts/RnmsaX5TEDoaH6XcB/systemic-change-global-poverty-eradication-and-a-career-plan
Every single one of them via government policy ensured that their kids had basic education (upto 12 years of schooling). This was prior to their economic growth. How do we know that human well being today is not caused by investments in education?
Do you have a better analysis of this? Lots of things happened before economic growth and could have plausibly contributed to it. Remember not to select on the dependent variable: perhaps countries which didn’t produce huge welfare gains also implemented widespread K-12 education.
That list of countries is zero.
On the contrary, countries with widespread education always had huge welfare gains. They did well in terms of life expectancy, under 5 mortality rate, babies per woman (a reasonable indicator for modernity, and women’s empowerment).
If they were market economies like Singapore, South Korea, Taiwan, Hong Kong they also had gains in income. China saw major improvements in education and social indicators pre-1979 reforms, it saw improvements in income after opening up, and social indicators have since improved (after a stall in 1980′s). (Not forgetting or dismissing the great Chinese famine)
visualization here
Cuba on the other hand has high life expectancy but very little money. It’s educational levels for women aged 15-24 are close to USA (not talking about quality) 13.3 vs 13.9
visualization here
No surprise that the life expectancy of Cuba and USA are also close
visualization here
In summary Education drives Health, and in case of market economies it drives wealth also.
I’d like to see a source for that, given the Gapminder chart of years of schooling vs. GDP has plenty of examples of countries which have increased the number of years of schooling and seen no increase in GDP—e.g. Kyrgyz Republic, Moldova, Micronesia et al
Like I mentioned earlier, I have very little interest in economic growth. Education is a necessary but not sufficient condition, I said as much when I wrote ” Education drives Health, and in case of market economies it drives wealth also.” implying that other policies have an effect on wealth. Cuba is a good example, it is almost on par with USA in terms of life expectancy, babies per woman, but not money. This is because of their education levels.
Kyrgyz Republic, Moldova are ex USSR countries, the transition from communism had been catastrophic in 1990′s. Even so their human development indicators are decent with life expectancy at 70+ years. Micronesia is behind at 65 years life expectancy.
Babies per women are around 3 for micronesia and Kyrgyz Republic, with moldova less than 2. Those countries are doing ok, even as I wish things were better for all of them.
I already listed the best papers I have read above in addition you can read Amartya Sen’s books.
Hunger and Public Action published in 1991 is still worth reading, his comparison of India, China, Kerala is illuminating.
https://www.oxfordscholarship.com/view/10.1093/0198283652.001.0001/acprof-9780198283652-chapter-11
Wolfgang Lutz and his coauthors papers are good too
https://scholar.google.at/citations?user=QRH1wRYAAAAJ&hl=en
Will have a look at those links.
But my point was that your blanket statement about there being no countries which implemented widespread K-12 education and didn’t have huge welfare gains (whether as wealth or e.g. HDI) is wrong on its face. e.g. South Africa and Switzerland since 1990 increased mean years of schooling by 50% (from 8y to 12y); South Africa saw its HDI increase by 0.04 but Switzerland saw it increase by 0.11 over the same period. OTOH, there are countries with very little increase in time spent in school which have seen huge increases in HDI.
oh good. now we are thinking about individual countries their histories and lessons that they can offer. Amartya Sen/Jean Dreze introduced me to this way of thinking in their book Hunger and Public Action, their latest “An Uncertain Glory: India and its contradictions” is good too.
Glad you brought up HDI which consists of three parts Education, Life Expectancy and Income.
In South Africa Education as you noted is up, Income is basically flat, Life Expectancy on the other hand in back to 1993 levels after crashing hard due to he AIDS crisis. South Africa given the history of apartheid should be analyzed as two populations 1) White 2) Blacks + others. Unfortunately I don’t have the disaggregated data for those groups.
Care to share the list? Oil (or resource) wealth is one way HDI increases without any real change in people’s lives. I discount that kind of HDI improvements.
Relevant latest data on HDI
http://hdr.undp.org/sites/default/files/hdro_statistical_data_table7_15.pdf
I wrote that to be slightly provocative, can we find one country that is an exception it’s possible (I have been looking and haven’t found one). The fundamental point being that when we look at countries and their history we find that education levels explain life expectancy. This can be seen from China (pre-reform 1979), Taiwan, South Korea, Jamaica, Sri Lanka, Kerala, Mauritius, Cuba etc..
Easterlin Paradox can be explained by Education levels
Education and Happiness: a Further Explanation to the Easterlin Paradox?
I’m not going to get into this, but if you think this is the answer to big questions of how to increase economic growth, it would be better to properly define the dataset and show an analysis which demonstrates causation rather than mere correlation.
I have very little interest in economic growth. I value basic education, followed by health.
The best papers on the subject are Education and Health: Redrawing the Preston Curve Wolfgang Lutz Endale Kebede
Global Sustainable Development priorities 500 y after Luther: Sola schola et sanitate Wolfgang Lutz
You can find detailed education dataset at http://dataexplorer.wittgensteincentre.org/wcde-v2/
Gapminder which i linked to earlier has a lot of data loaded into it. https://www.gapminder.org/tools
The idea that education is important is not new. Since the early 1990′s UNDP has published Human Development Index, consisting of Education, Health and Income. Why the EA community discarded education is beyond my understanding.
The HDI of 1990′s is itself based on the older Kerala Model https://en.wikipedia.org/wiki/Kerala_model
Kerala had good social indicators by 1970 just 2 decades after independence and has been ahead of China until very recently in those indices. Amartya Sen discusses Kerala, China, Tamil Nadu in his books.
I have never had positive karma on this forum. Don’t be abusive EA forum.
If you think I am wrong vote me down no problem. However take the time to explain why.
Getting downvoted isn’t ‘abuse’ - it’s just a signal that people disagree with you. :) I’m not convinced of the case you’re making for education, for example.
I hope that karma isn’t a signal of disagreement! We’ve always had norms of karma being a signal for good and bad content, and explicitly not about whether you agree or disagree with someone. I definitely upvote many things I disagree with, and downvote many things that argue badly for conclusions I agree with.
This seems fair—though I would hope there would be significant overlap between ‘I agree with this’ and ‘this is a good argument’.
I agree with all of this.
Like Habryka, I agree that downvotes aren’t abuse, but I’d prefer downvotes to be used for poor quality or inaccurate arguments rather than skepticism or respectful disagreement.
Hello Henry_Stanley,
Any one downvote without comment is understandable. I persistently get downvoted. At that point most people leave the community. Are those the norms that we want to create?
I never downvote people I disagree with, I ask them why and try to learn from them (or teach them).
I agree EA community relies on RCT’s too much.
However Education not economic growth is key for human well being. I have written on this subject multiple times on the forum.
A partial response is at https://docs.google.com/document/d/1aKWCxW76z_jHcweyGDNMzdt4hajJcF_sBDcQr6hkxCA/edit?usp=sharing
Posting it as a doc with everyone having comment access
I wish forum authors would avoid framing their arguments as “us vs them”. It makes me spend far more time engaging with the piece than I would have rationally chose to!
Thanks again for the valuable thought provocation anyway though :)
In the case of this post, was your engagement a result of a drive to “defend” one side or the other? Was it because the idea of conflict made the post more tempting to read than had it been something like “a positive argument for more development research, without comparison to other types of research”?
Agreed. Also you should call people by what they refer to themselves as. I think ‘Randomista’ comes across of a pejorative.
There is a very interesting new post about the coming energy descent.
https://forum.effectivealtruism.org/posts/wXzc75txE5hbHqYug/the-great-energy-descent-short-version-an-important-thing-ea
As energy and GDP are highly coupled we should expect economic activity degrowth rather than growth later this century and we shoul prepare for that.
This post seeks to start a conversation on the extent to which economic growth and RCT-evaluated programs should be prioritized in EA. It implies that RCT-researched programs relate to health interventions, which does not need to be the case. It suggests trade liberalization as a possible solution, while omitting a discussion on the possible implications of various trade policy strategies. The piece omits a discussion on the potential complementarity between growth and RCT-based programs. The Self-reported Life Satisfaction vs GDP per capita graph uses a semi-log plot, which shows a logarithmic relationship as a line and can thus lead some readers to assign a relatively greater value to increasing GDP at higher income levels. Thus, while this piece can be an excellent conversation starter, it should not inform the prioritization of specific interventions.